April 18, 2021 Analysis of USA state data
Individual state histories
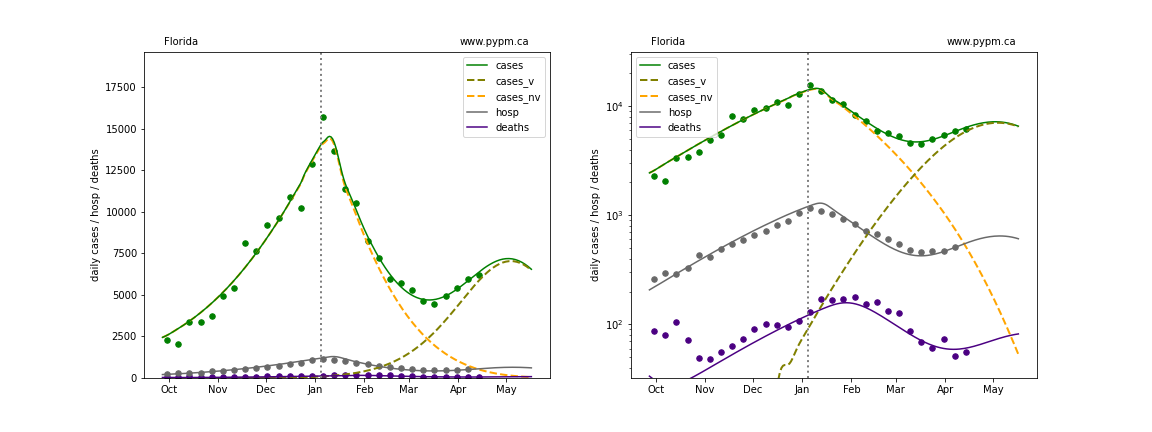
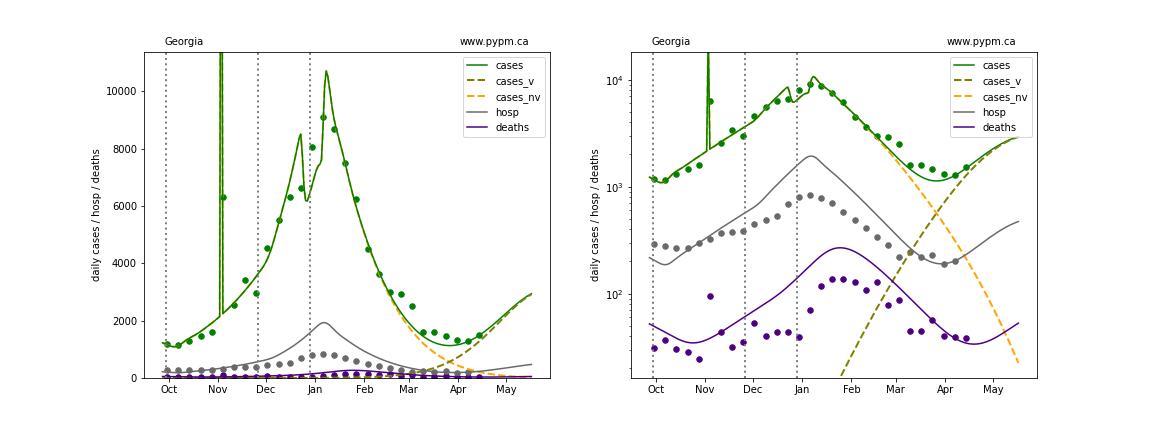
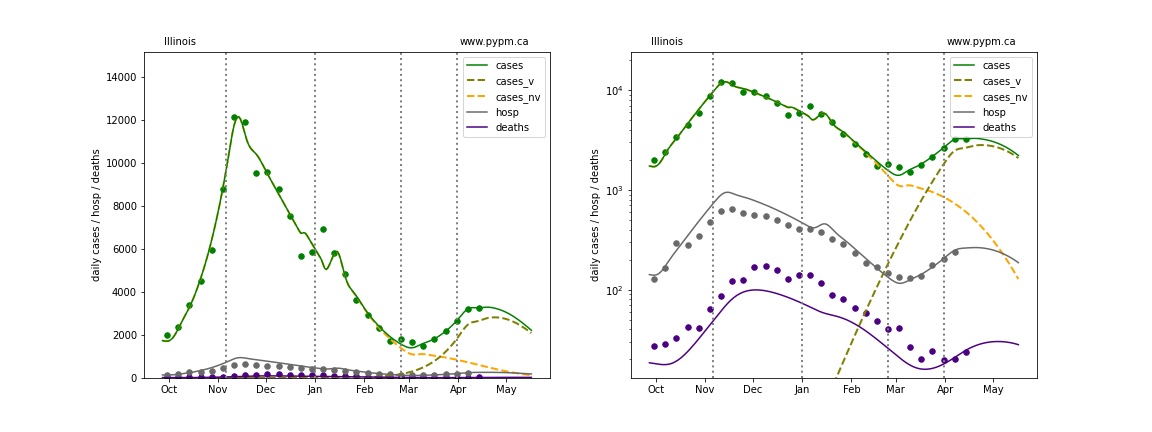
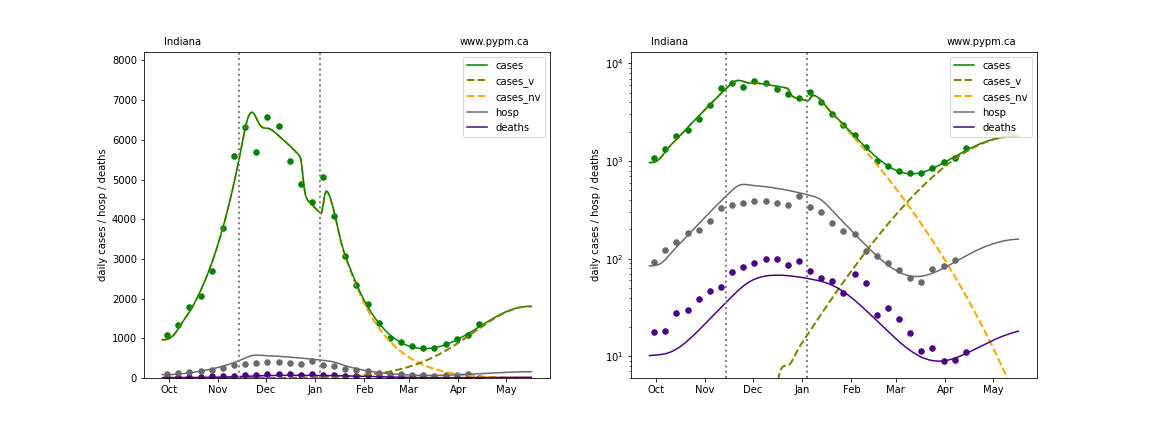
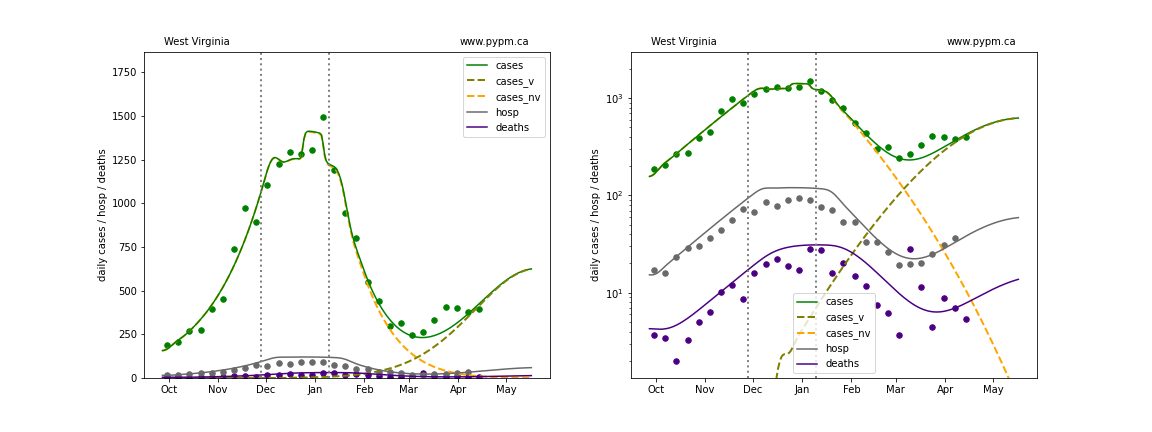
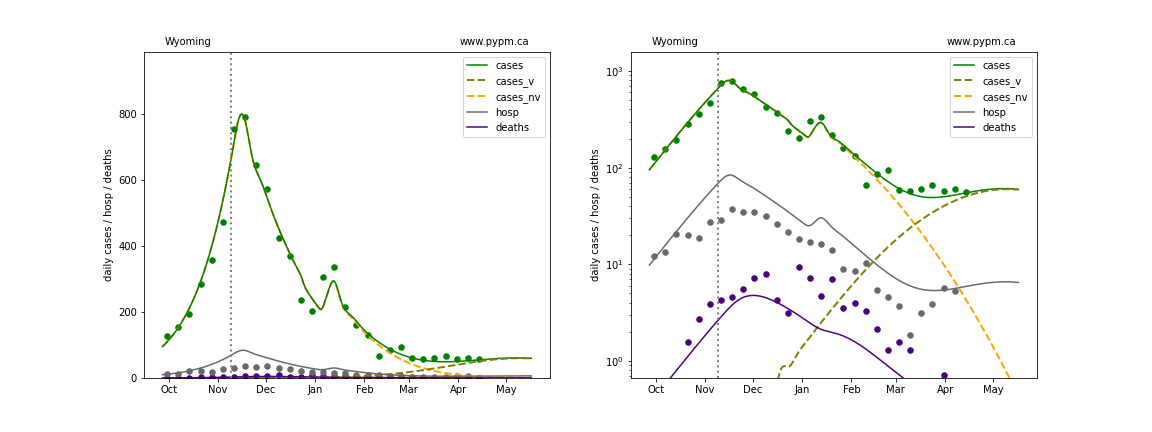
The plots below show the case / hospitalization / deaths data for all 50 states, DC, and PR. The data fits were done using data up until April 17, 2021.
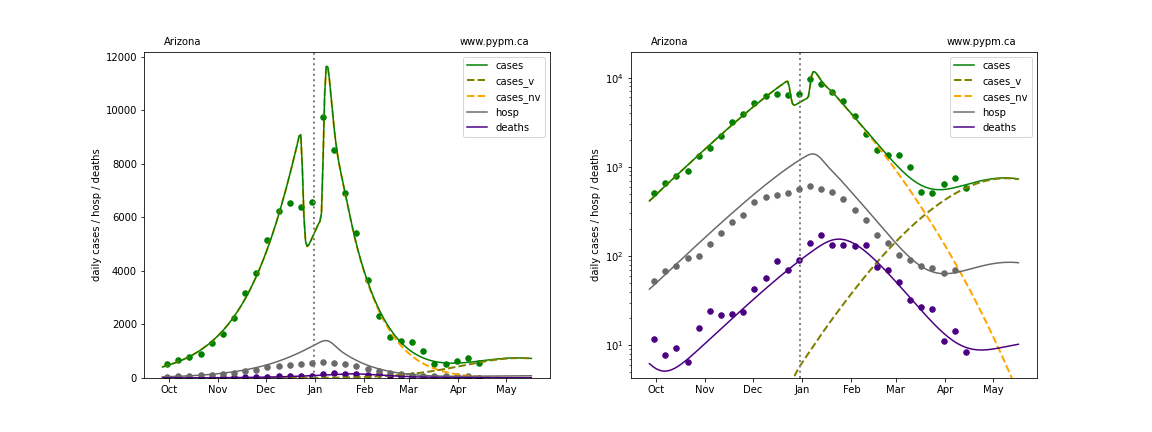
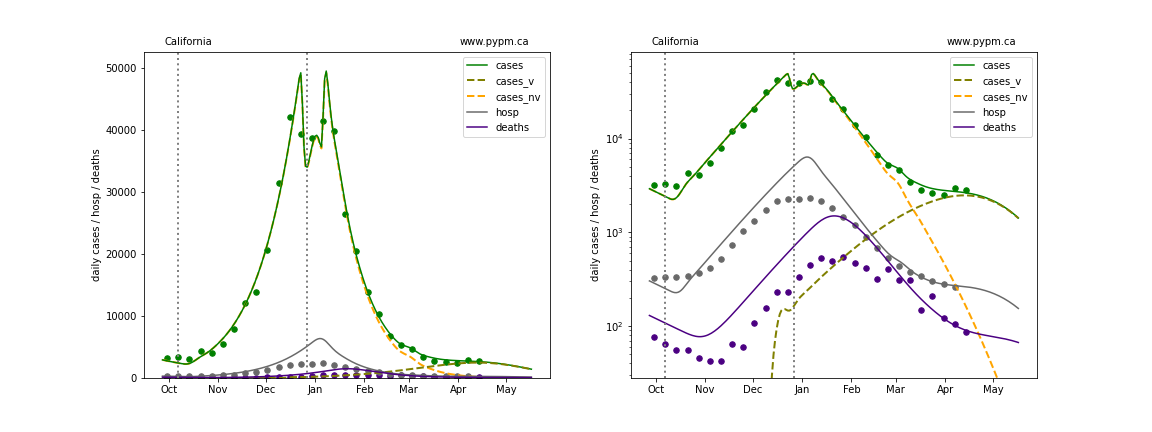
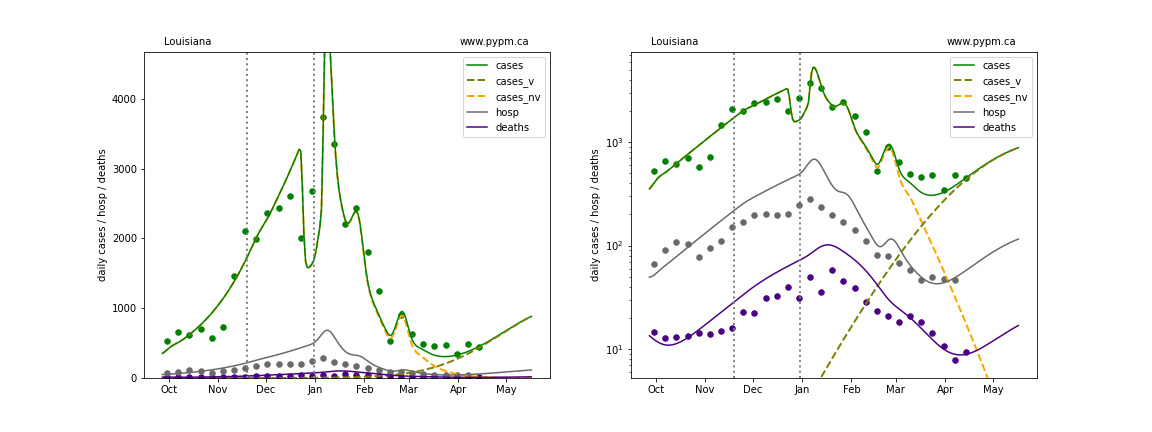
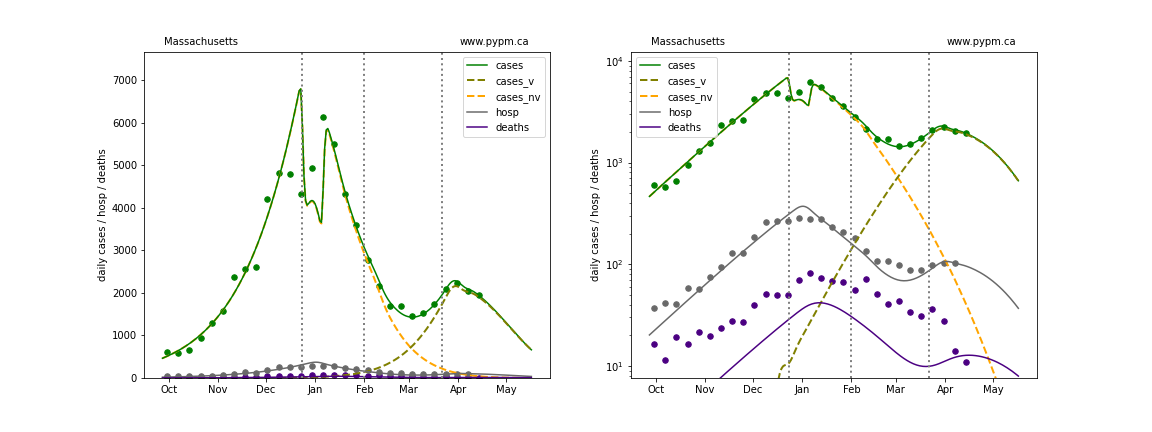
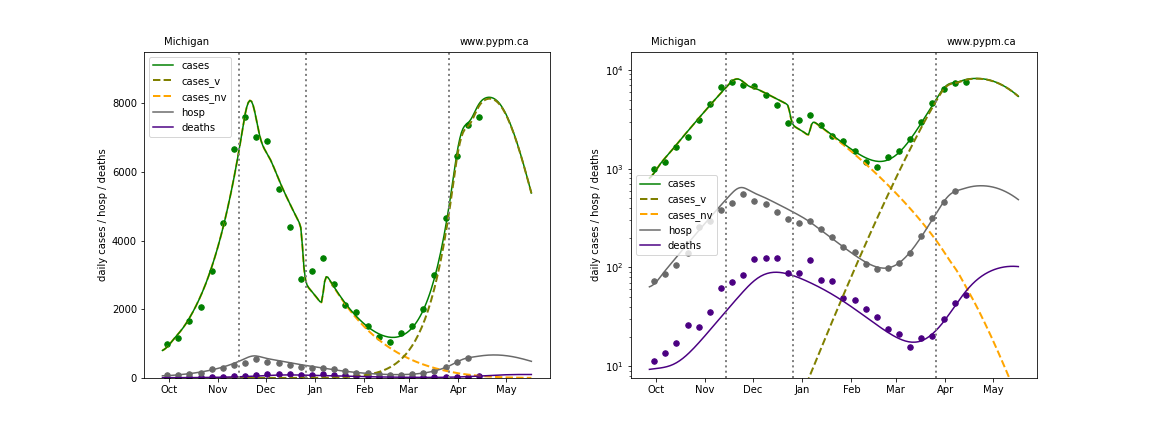
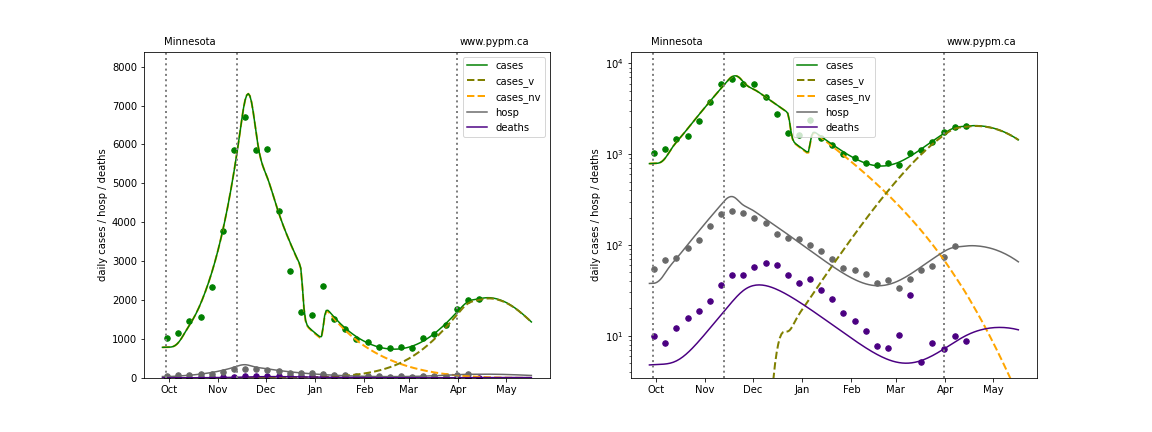
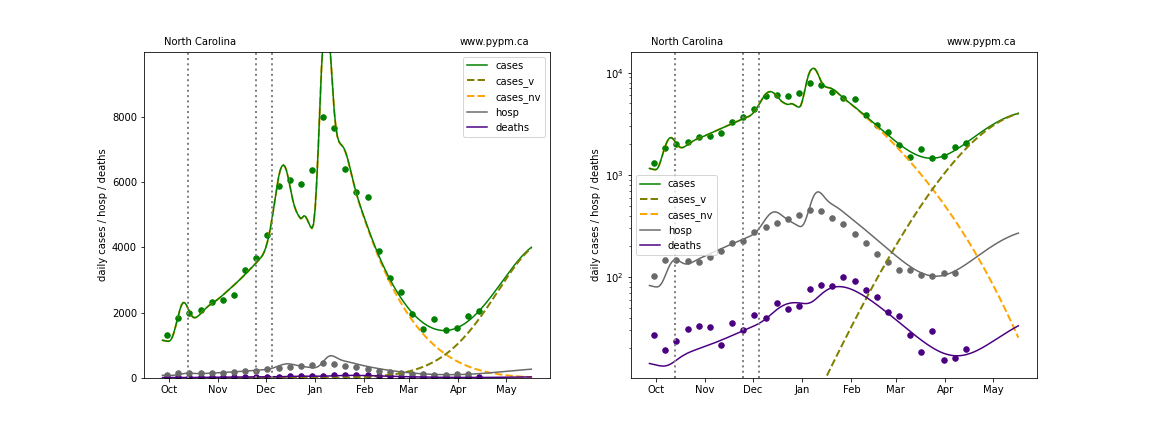
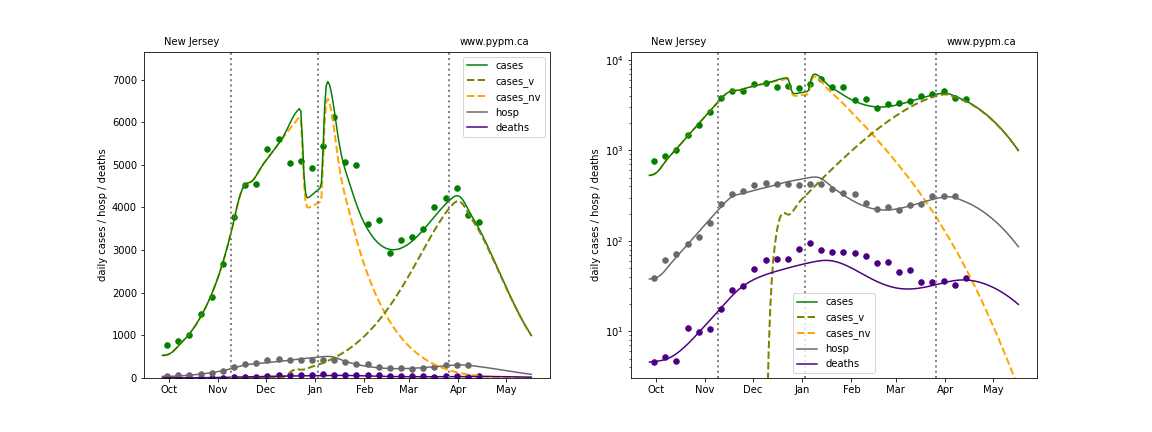
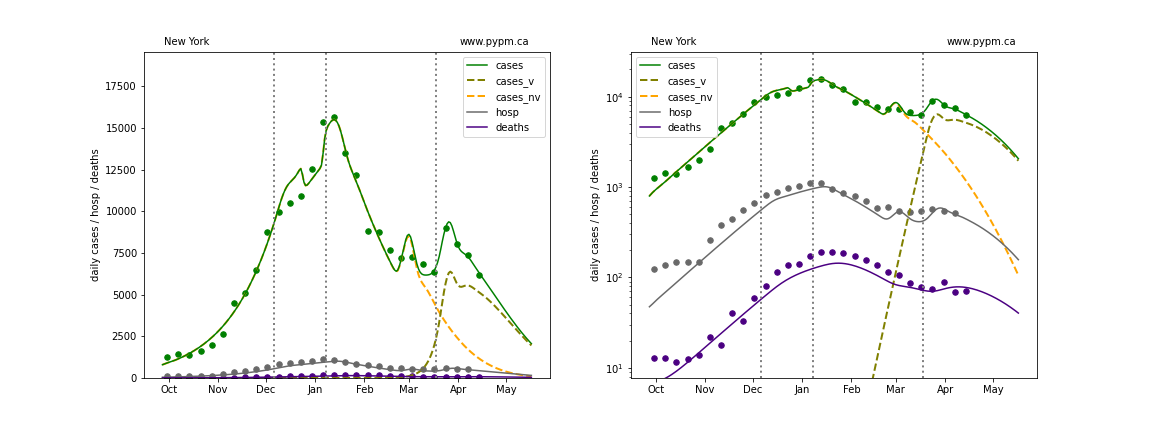
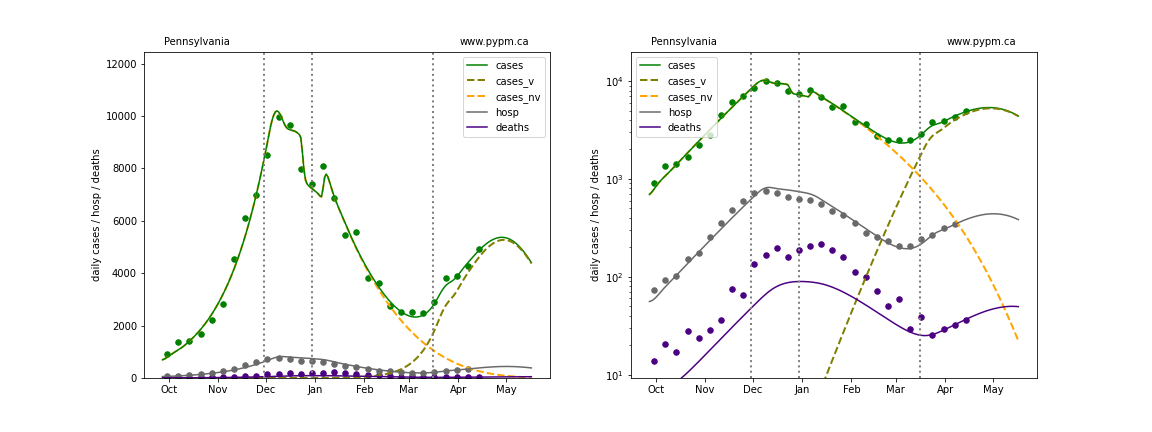
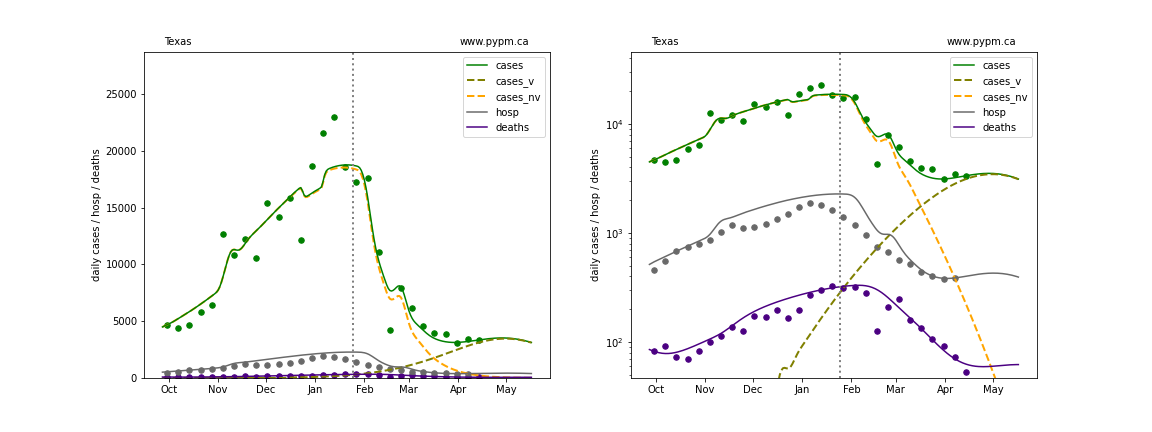
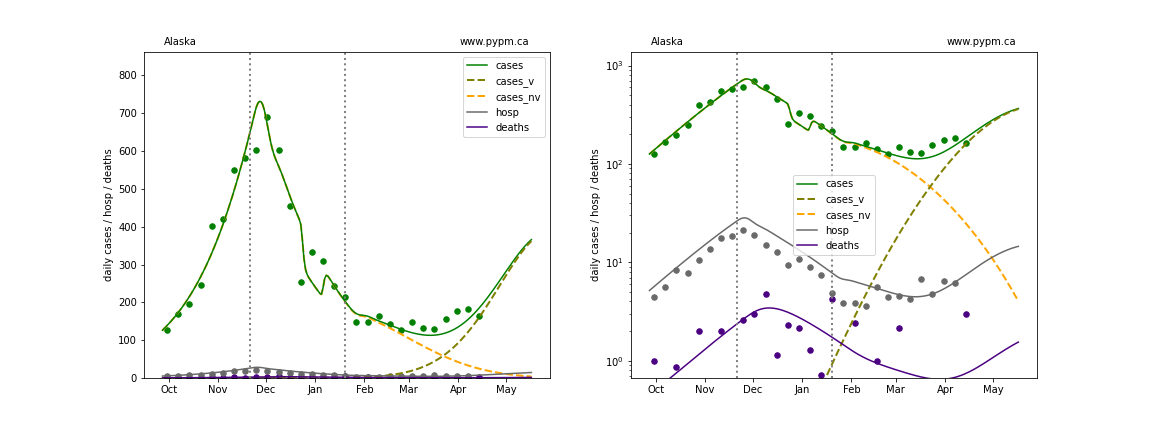
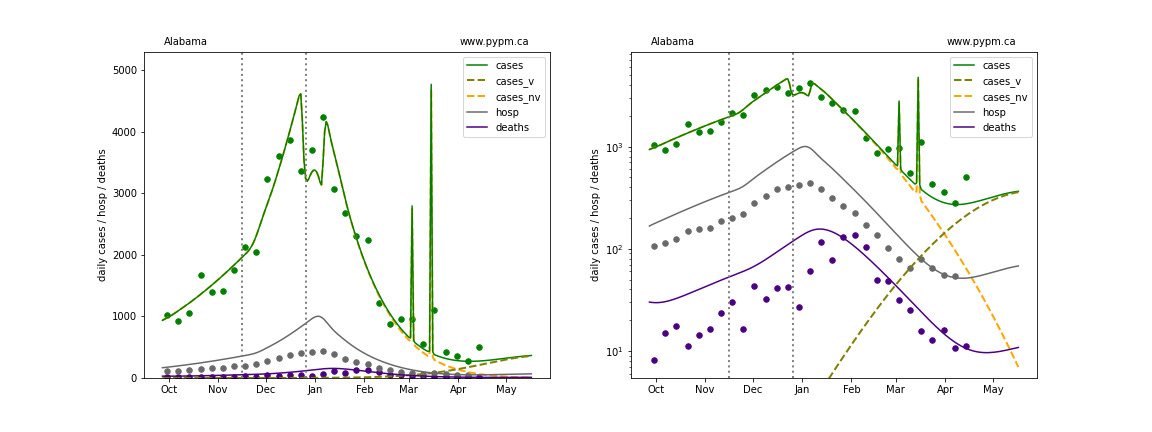
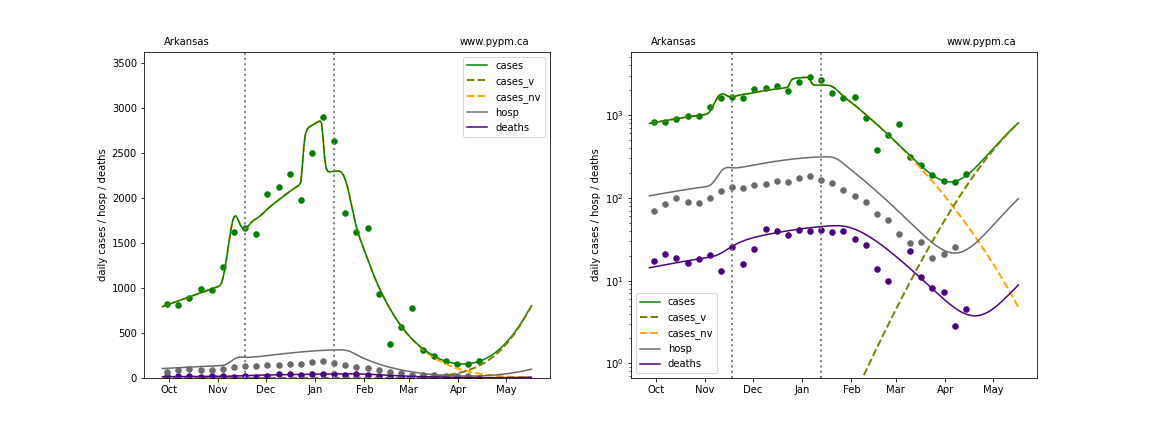
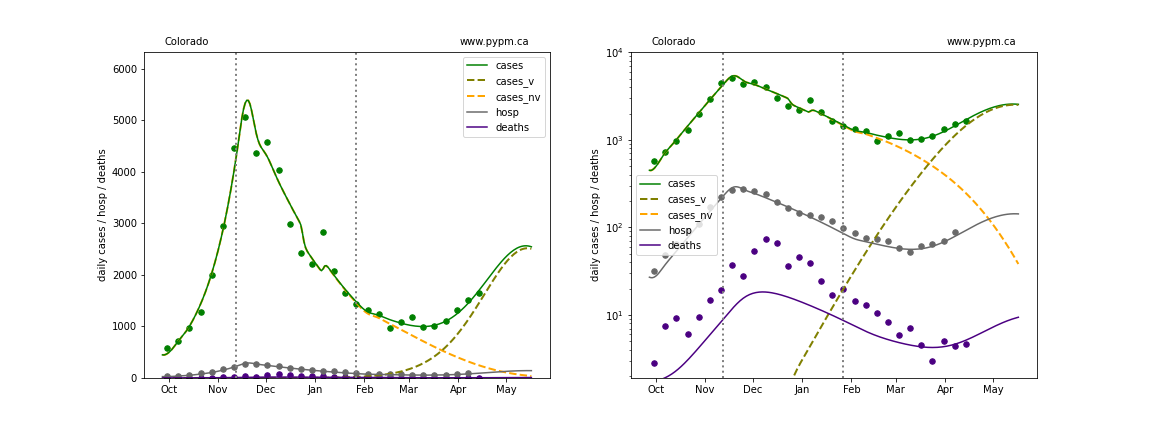
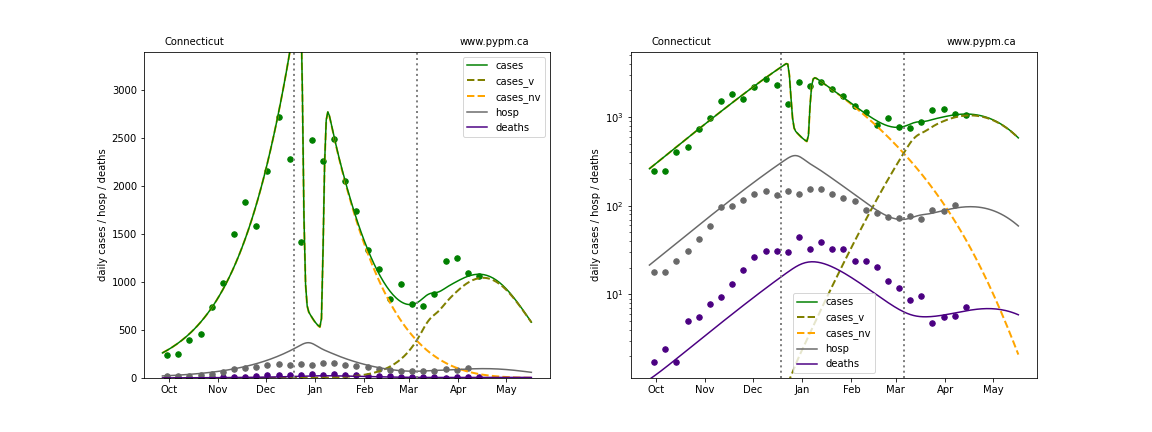
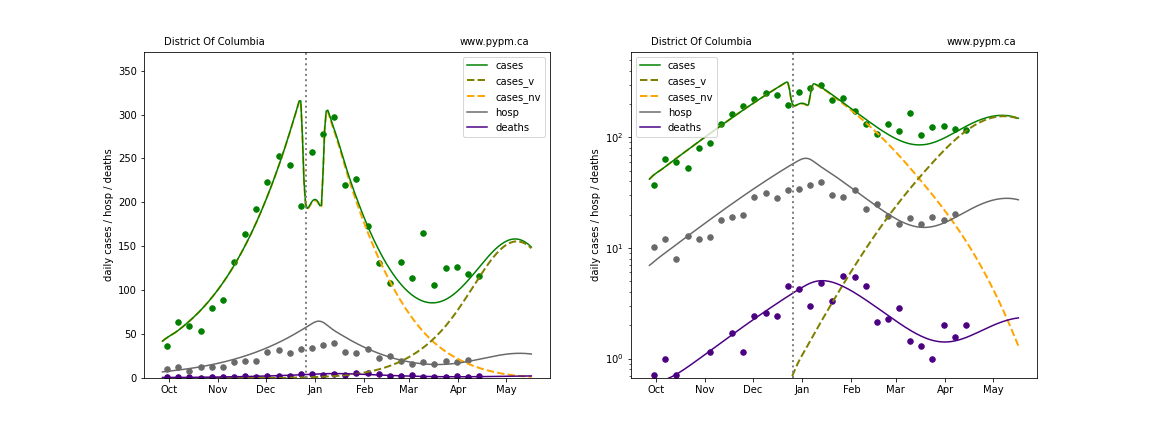
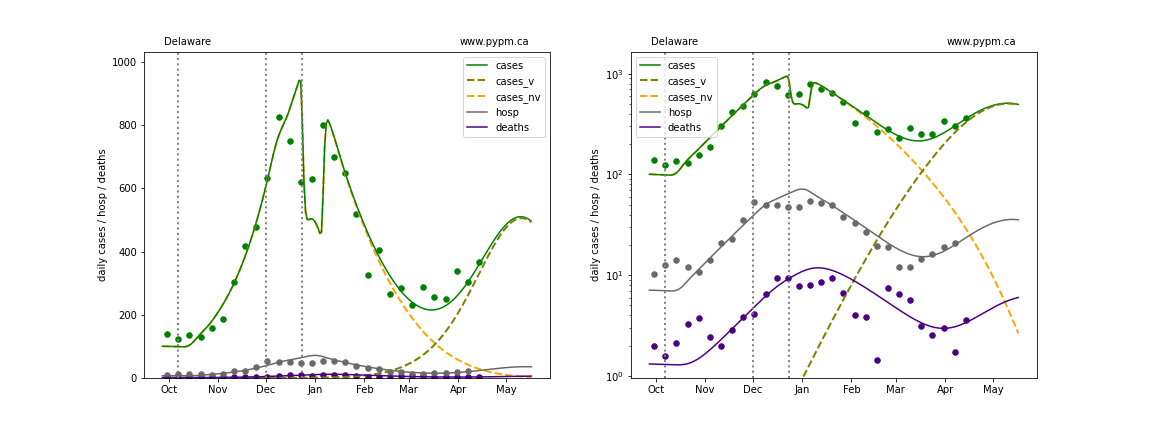
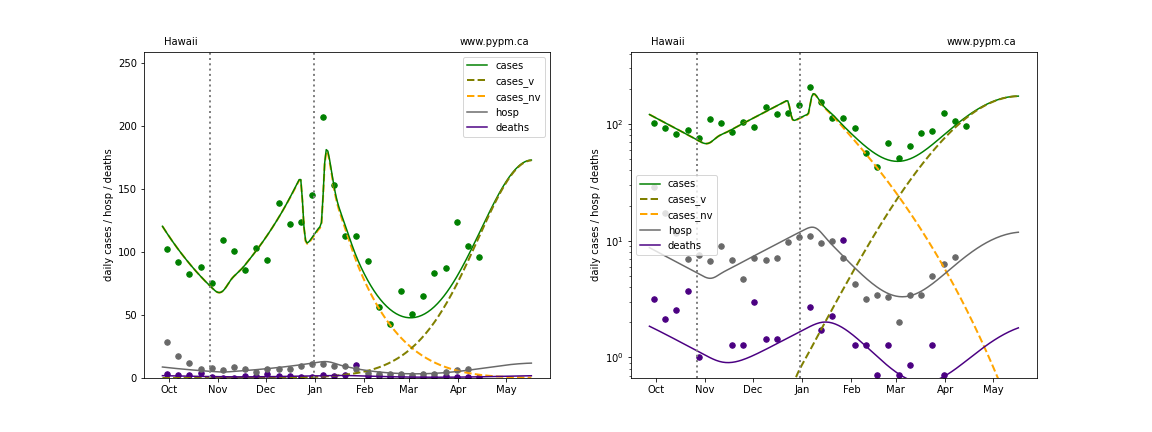
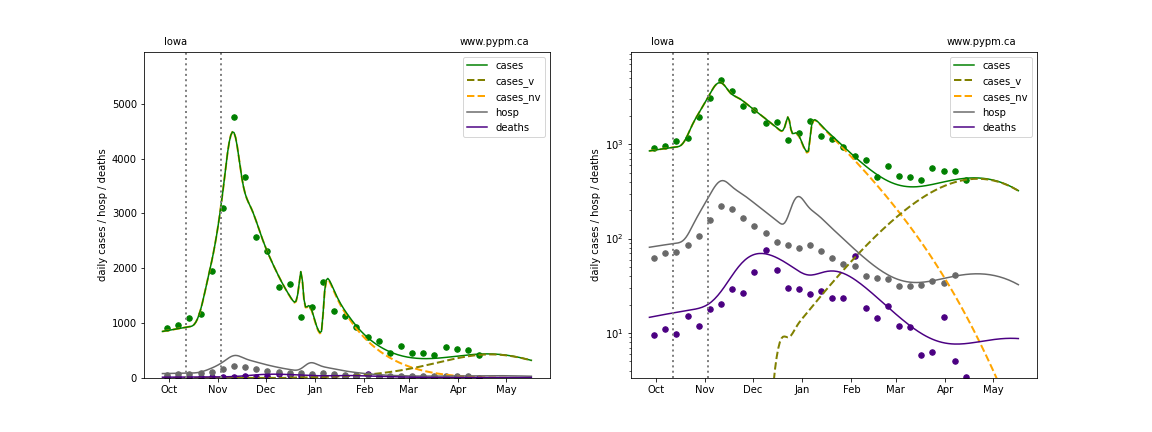
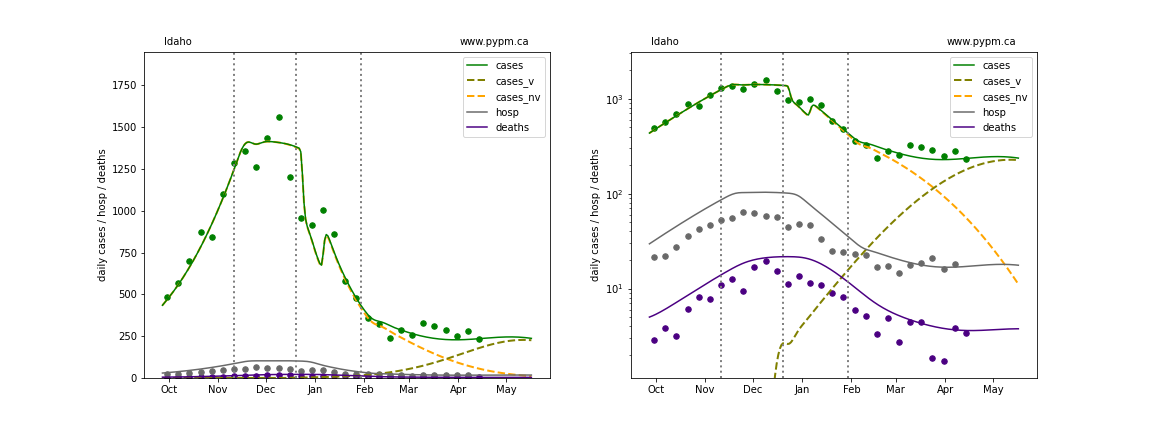
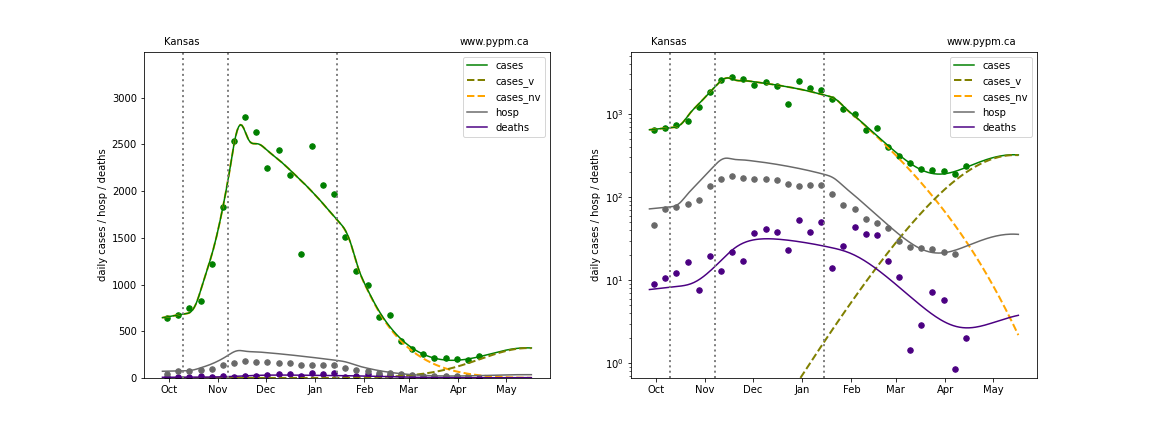
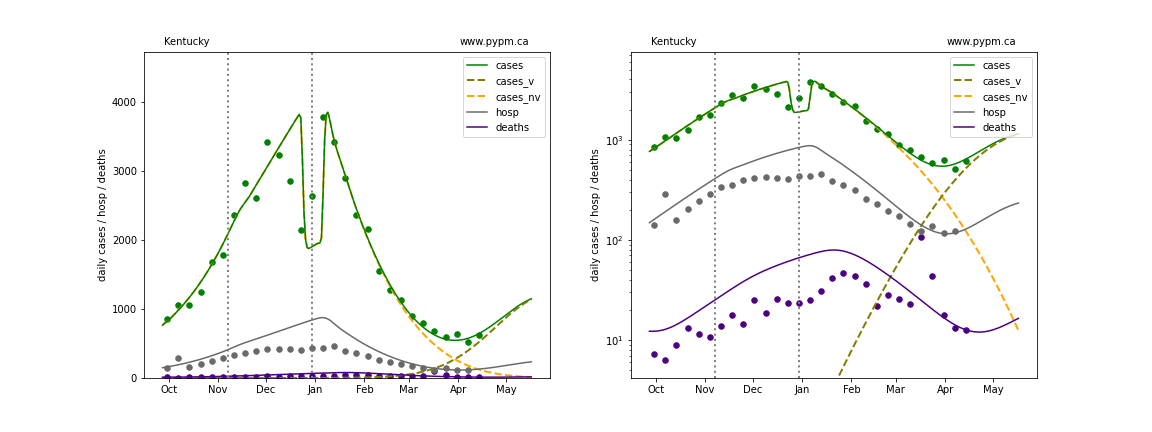
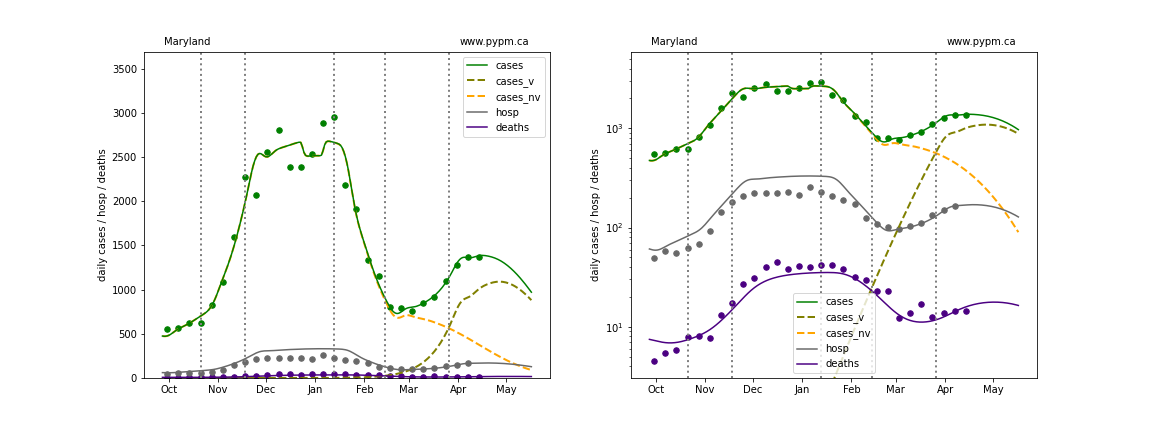
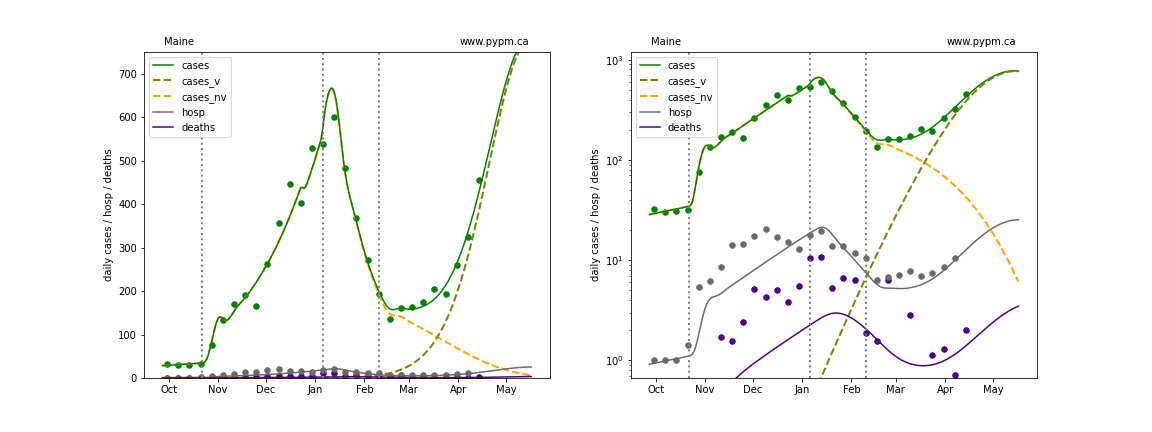
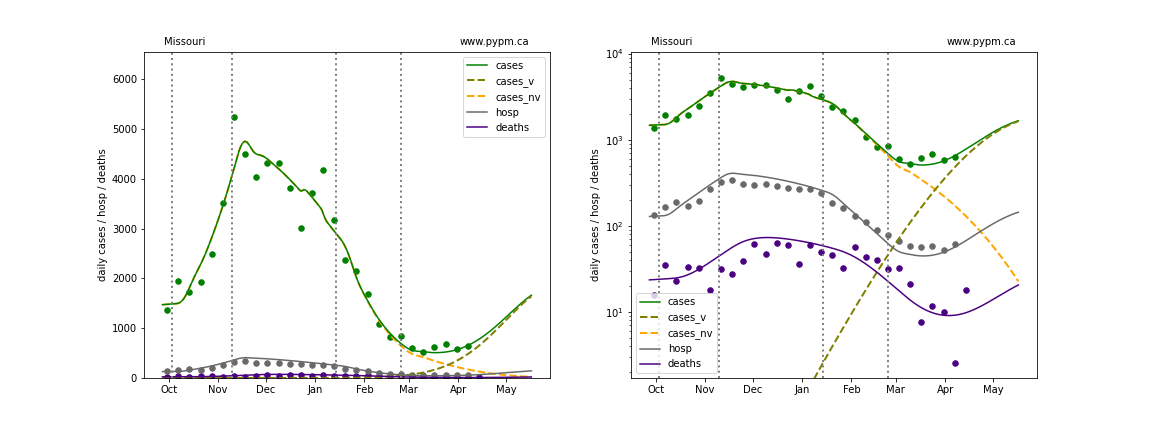
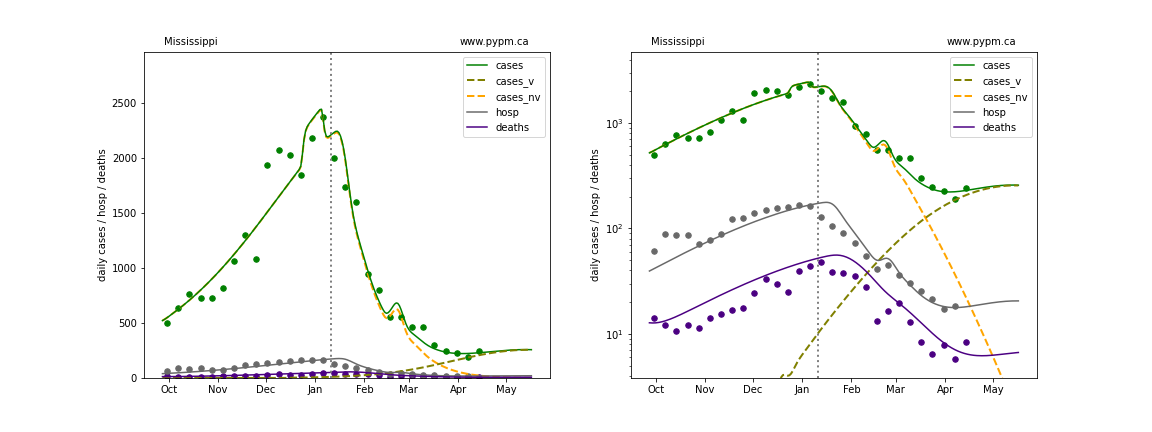
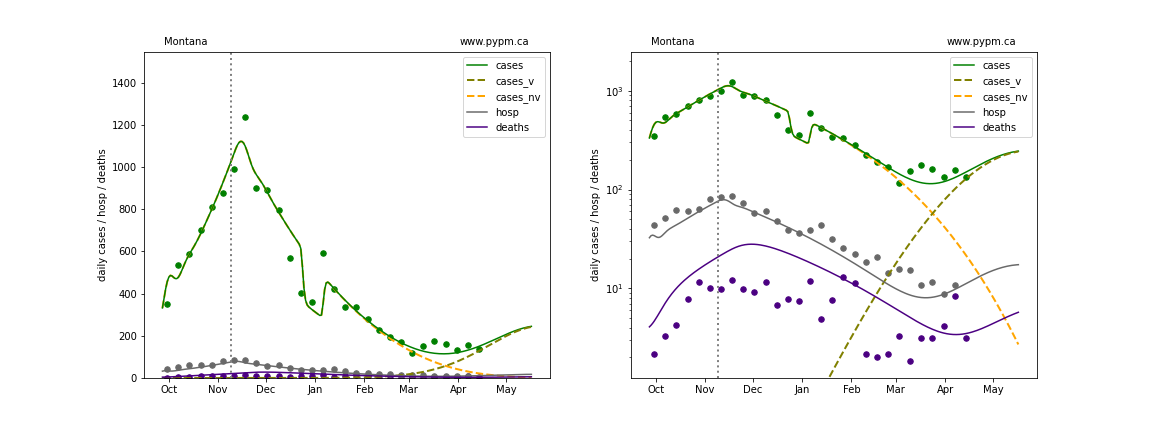
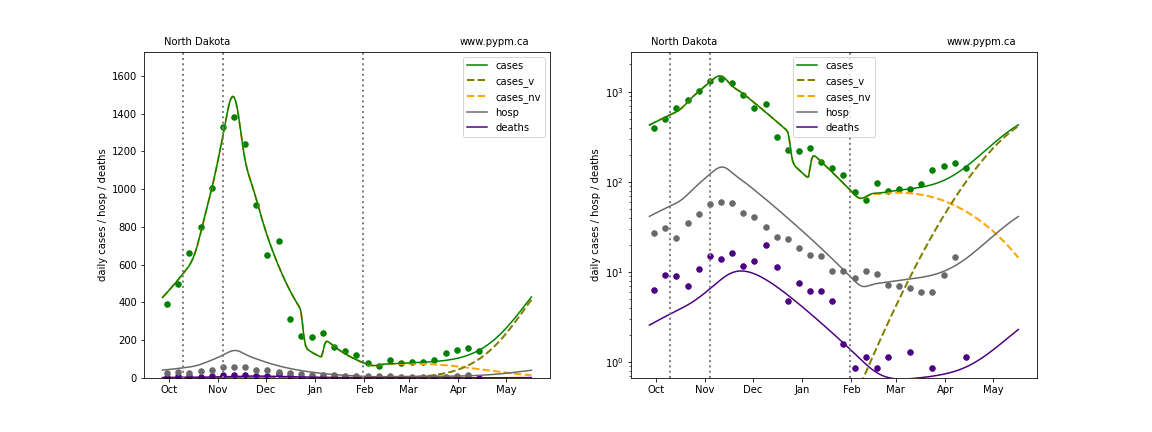
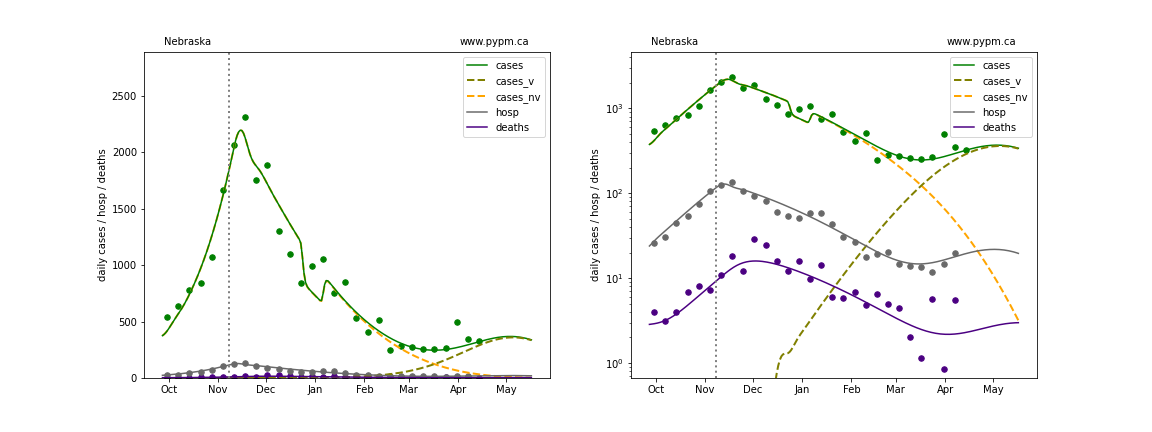
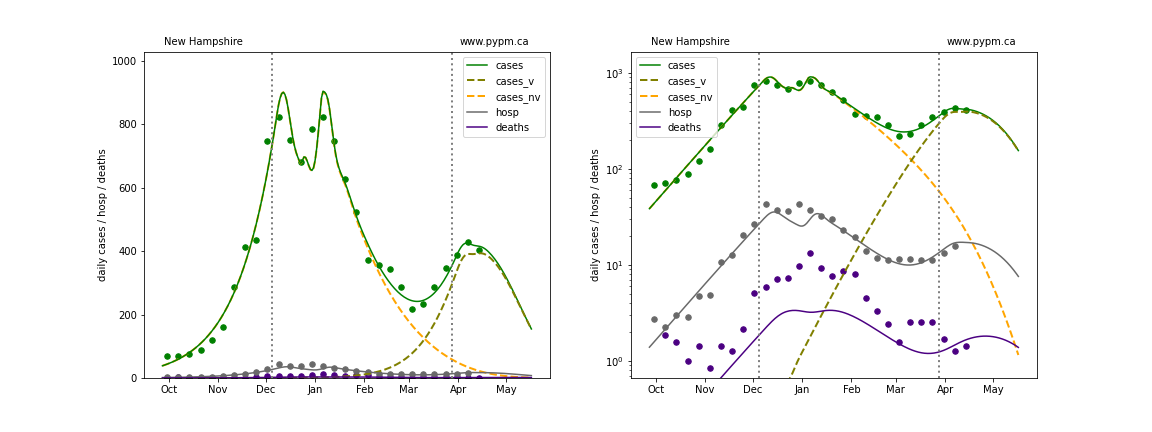
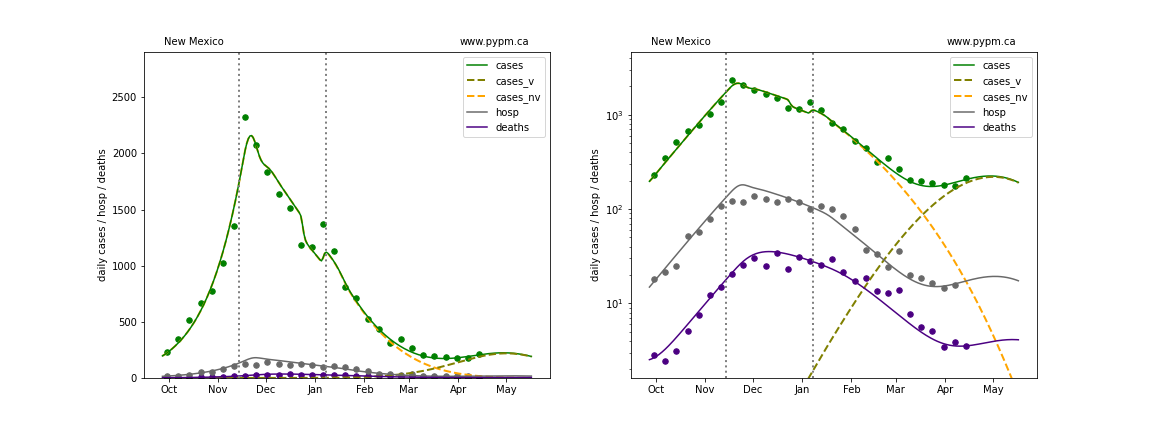
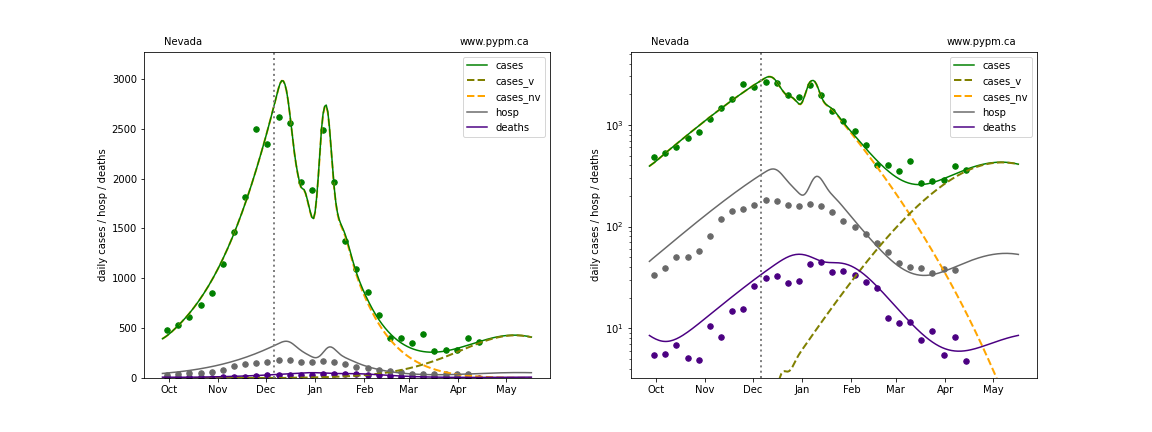
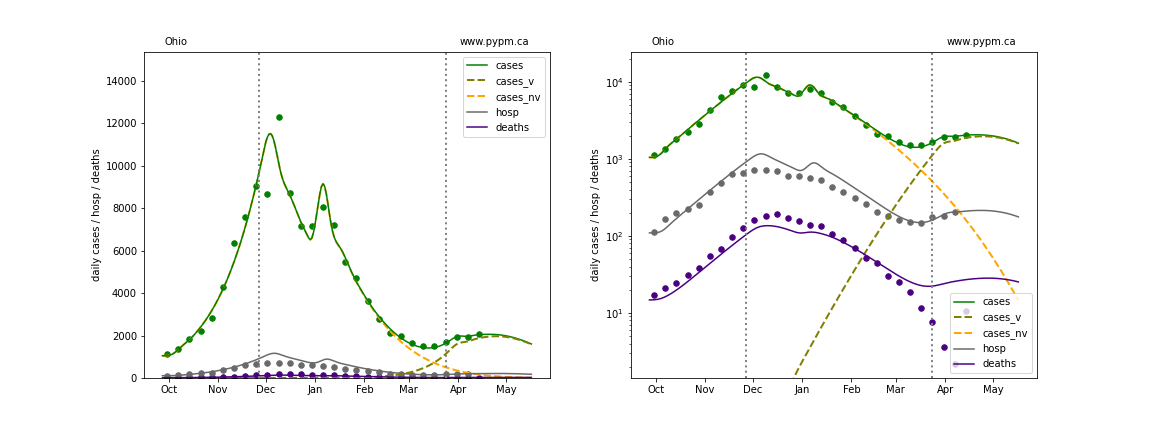
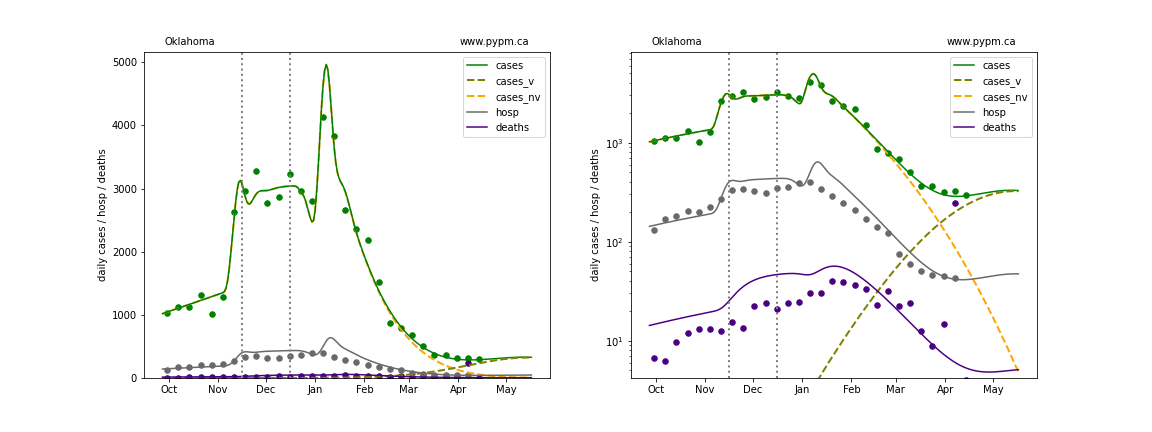
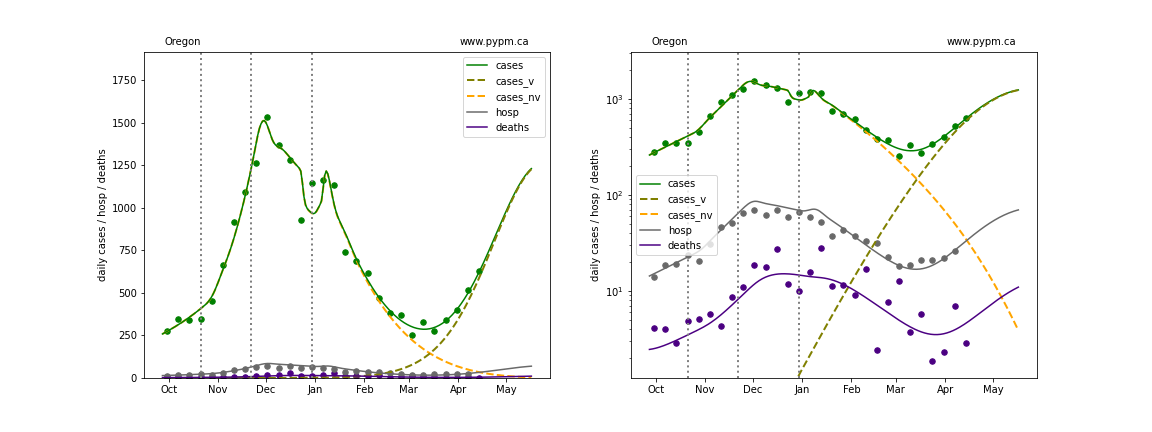
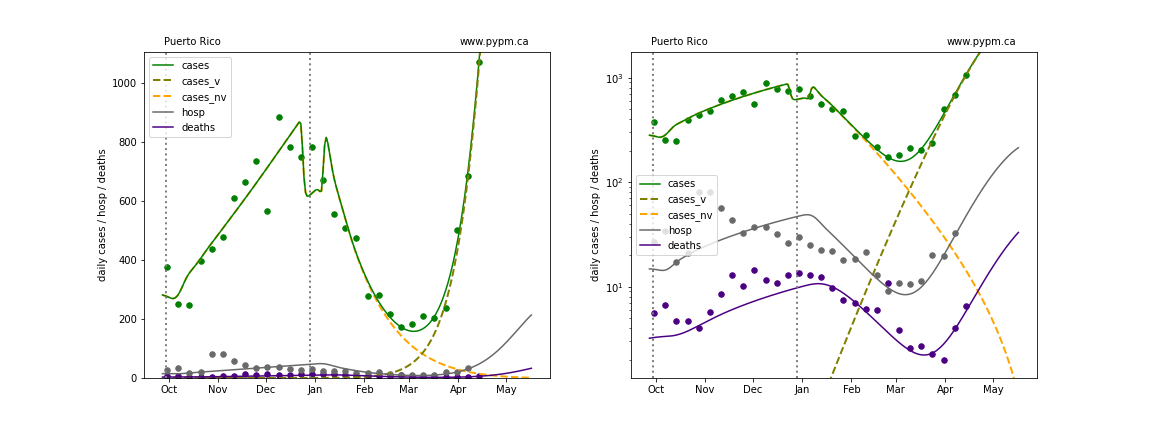
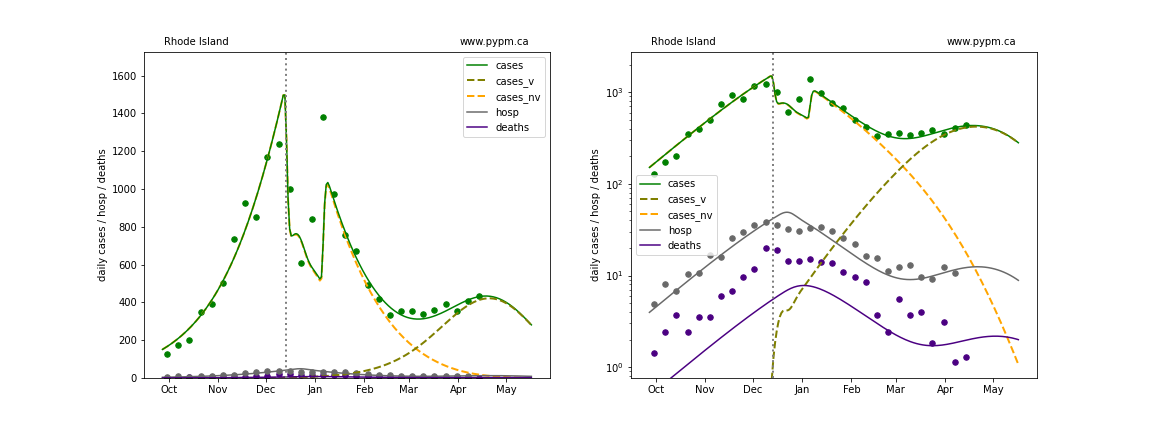
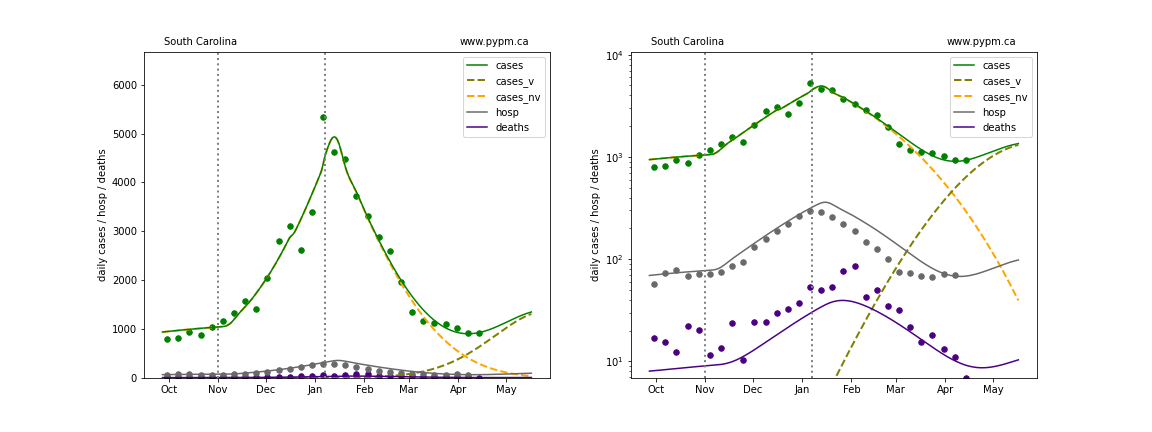
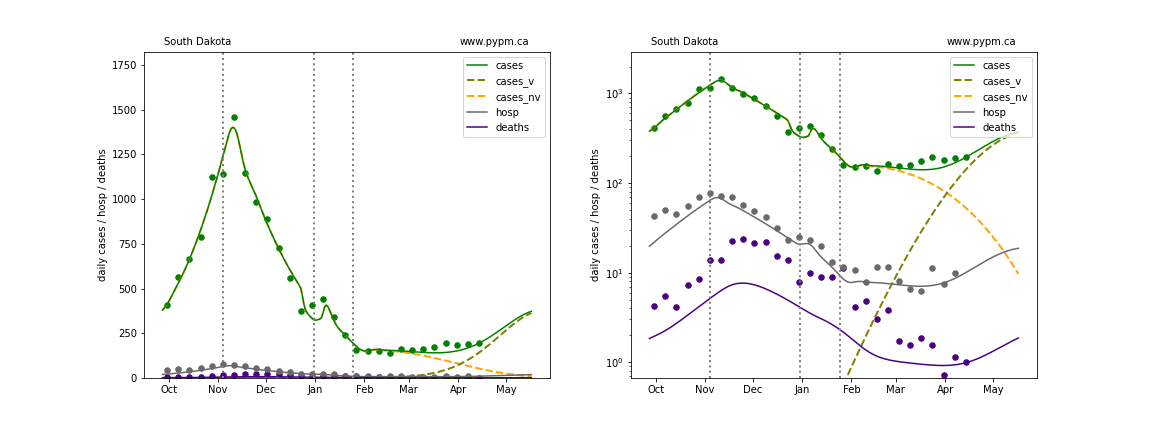
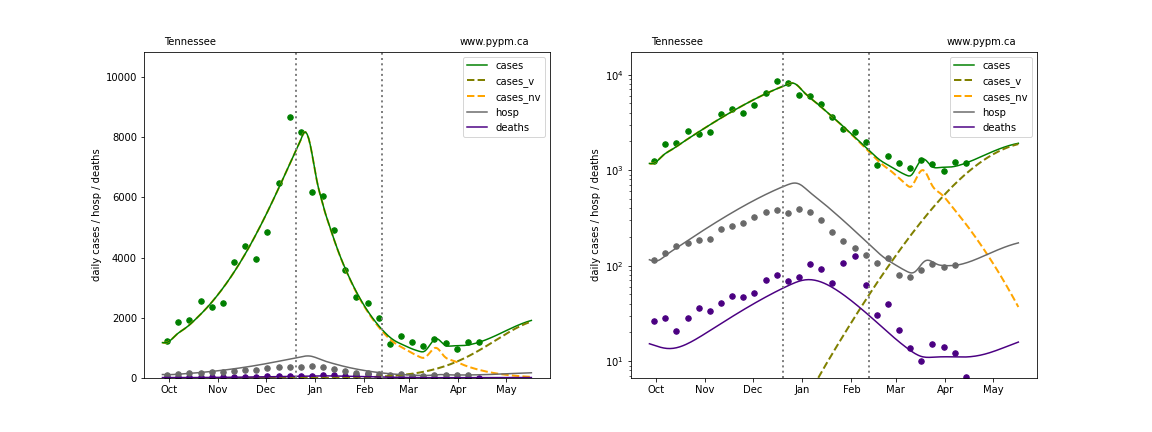
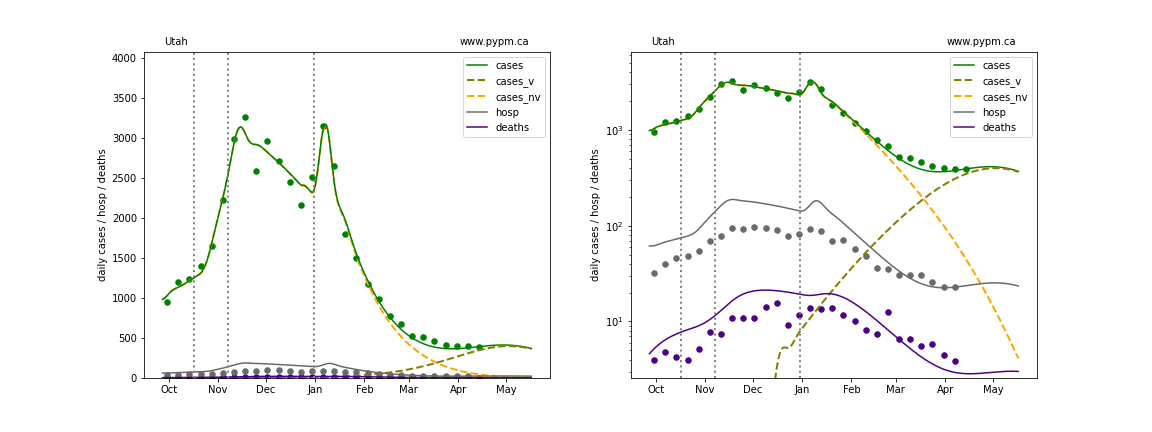
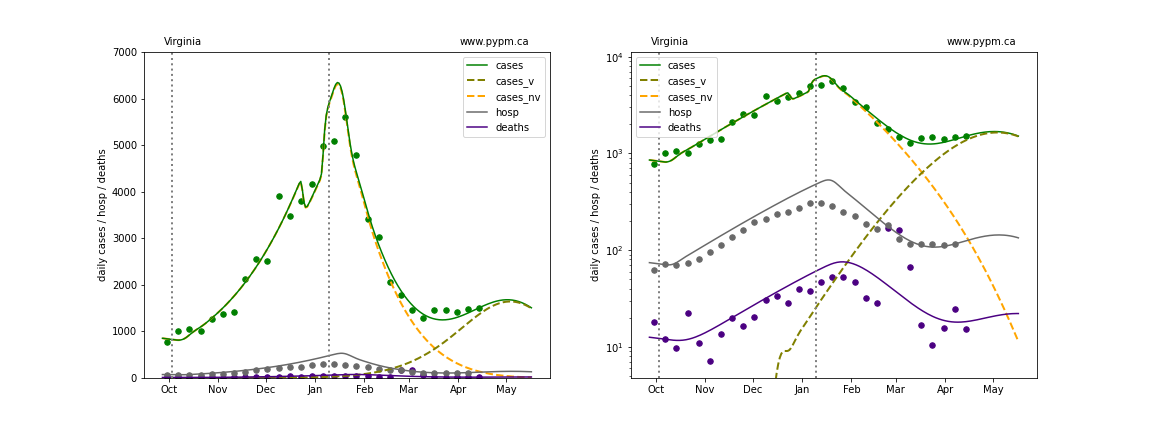
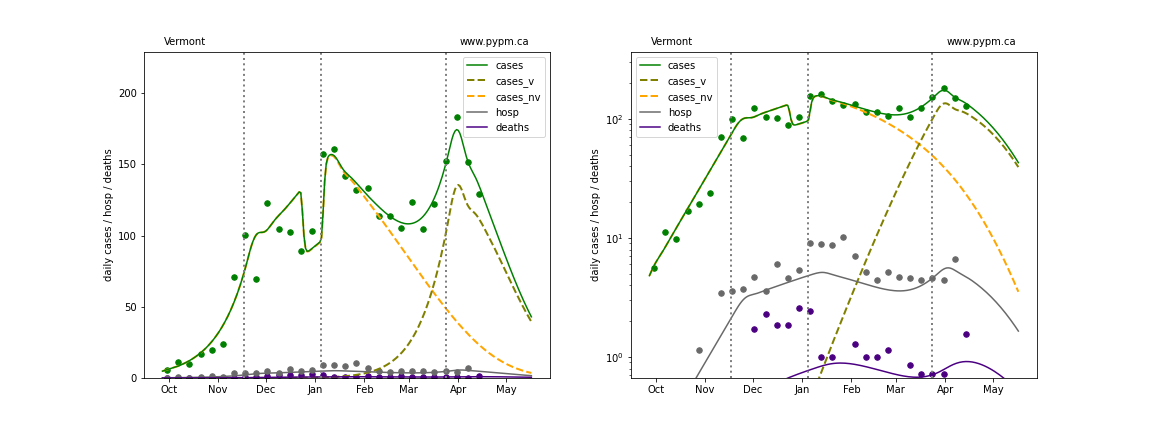
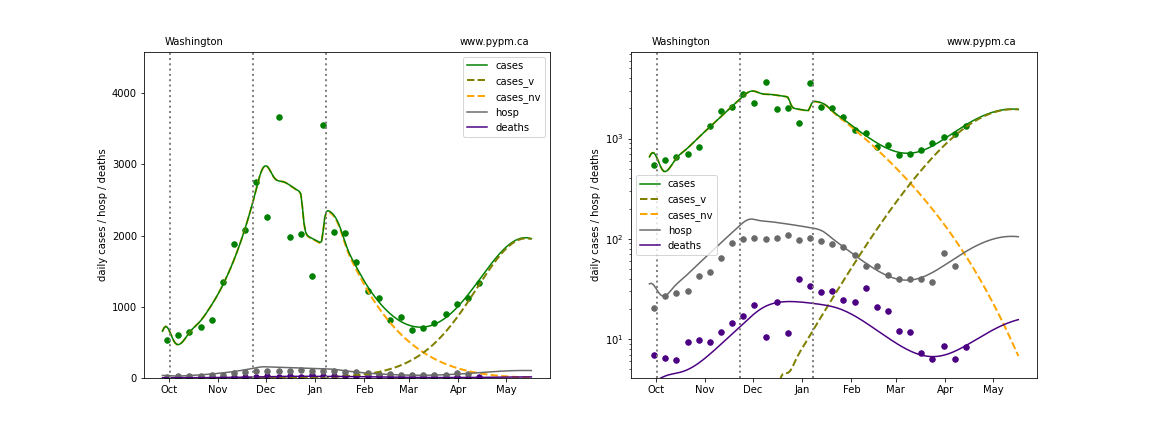
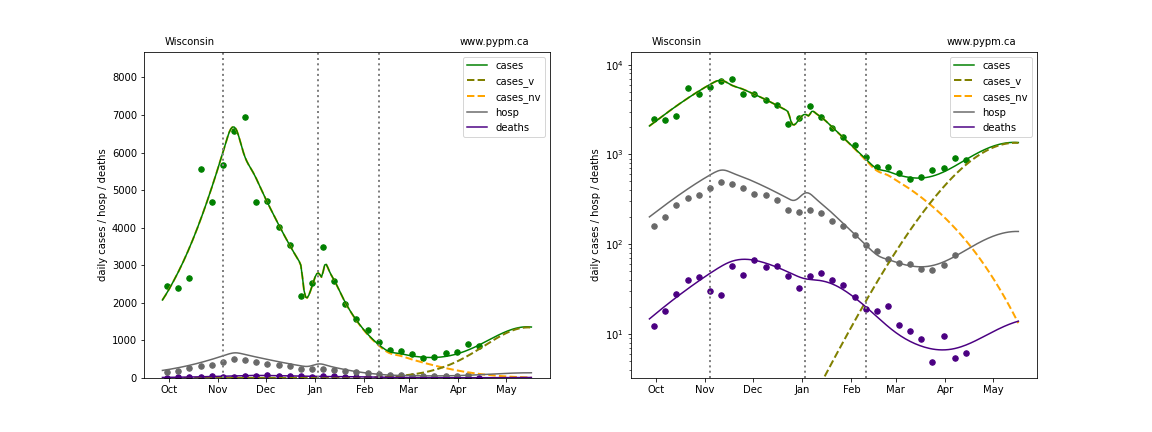
The green points are the daily cases, the grey points the daily hospitalizations, and indigo points are the daily deaths (each averaged over a week). The case data are used to define the periods for which transmission rate appears to be constant. The vertical lines show where the transmission rate is changed. In absence of immunity, constant transmission rates lead to steady exponential growth or decline during, which appear as straight lines on these log-scale plots. With immunity growing, these lines are no longer straight - bending downwards due to the herd effect. The curves are the model expectations for cases, hospitalizations, and deaths, as determined from the case data. The dashed curves separately show the reported cases from the original strain and from variants of concern.
The final set of plots show a comparison of forecasts from 5 weeks ago with the most recent data.
Genomic data
For some staes, genomic screening data using the SGTF protocol, is available to estimate the growth advantage (aka selection coefficient, s) of the B117 variant as well as the current fraction of cases dues to that variant.
Recently in several states, the SGTF/non-SGTF ratio is no longer growing exponentially, which could be due to other variants of concern with a similar growth advantage but which are not tagged by SGTF.
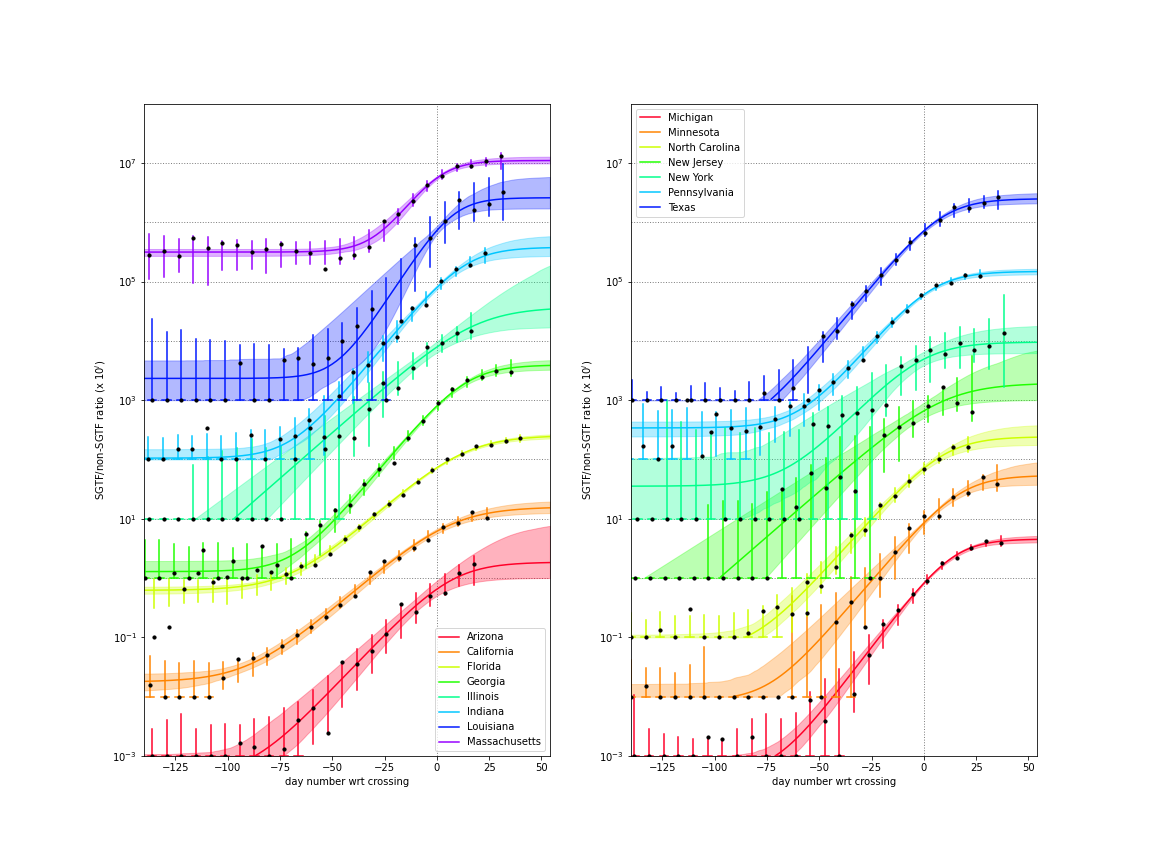
Below is a figure showing fits to the ratio of the SGTF cases to non-SGTF cases which is used used to estimate the selection coefficient (s), the ratio of other VoC to the B.1.1.7 (rpb), and the current fraction of cases due to variants of concern (f_v).
The curves are the best fit, the shaded region indicates the 95% central interval of the ensemble of curves (modifying the parameters according to their covariance) and the vertical bars are the central 95% intervals for each binomial sampling.
| region | s | rpb | w | f_v (Apr 18) |
|---|---|---|---|---|
| Arizona | 0.086 +/- 0.008 | 0.538 +/- 0.241 | 0.000 +/- 0.000 | 0.920 +/- 0.043 |
| California | 0.071 +/- 0.002 | 0.633 +/- 0.076 | 0.002 +/- 0.000 | 0.936 +/- 0.013 |
| Florida | 0.074 +/- 0.002 | 0.396 +/- 0.018 | 0.006 +/- 0.000 | 0.978 +/- 0.003 |
| Georgia | 0.098 +/- 0.003 | 0.255 +/- 0.026 | 0.001 +/- 0.000 | 0.987 +/- 0.003 |
| Illinois | 0.071 +/- 0.007 | 0.270 +/- 0.179 | 0.000 +/- 0.001 | 0.869 +/- 0.051 |
| Indiana | 0.098 +/- 0.005 | 0.264 +/- 0.053 | 0.001 +/- 0.000 | 0.959 +/- 0.011 |
| Louisiana | 0.127 +/- 0.028 | 0.387 +/- 0.118 | 0.002 +/- 0.001 | 0.989 +/- 0.017 |
| Massachusetts | 0.121 +/- 0.010 | 0.964 +/- 0.071 | 0.030 +/- 0.002 | 0.994 +/- 0.003 |
| Michigan | 0.107 +/- 0.005 | 0.220 +/- 0.015 | 0.001 +/- 0.000 | 0.992 +/- 0.002 |
| Minnesota | 0.096 +/- 0.010 | 0.186 +/- 0.043 | 0.001 +/- 0.000 | 0.983 +/- 0.010 |
| North Carolina | 0.091 +/- 0.004 | 0.413 +/- 0.075 | 0.001 +/- 0.000 | 0.945 +/- 0.015 |
| New Jersey | 0.071 +/- 0.010 | 0.515 +/- 0.254 | 0.000 +/- 0.001 | 0.914 +/- 0.054 |
| New York | 0.085 +/- 0.018 | 1.054 +/- 0.286 | 0.004 +/- 0.004 | 0.983 +/- 0.023 |
| Pennsylvania | 0.095 +/- 0.004 | 0.677 +/- 0.040 | 0.003 +/- 0.001 | 0.976 +/- 0.005 |
| Texas | 0.099 +/- 0.004 | 0.400 +/- 0.041 | 0.000 +/- 0.000 | 0.989 +/- 0.003 |
- s: selection coefficient
- rpb: ratio of other VoC to B.1.1.7
- w: SGTF false identification of VoC per sample
- f_v: fraction of cases due to variants of concern on April 18, 2021
States with genomic data
The states with independent genomic data allow for better constraint on the growth advantage and current case fraction. With the variant potentially causing growth in the weeks to come, predictions for these states are much better established.
Arizona
California
Florida
Georgia
Illinois
Indiana
Louisiana
Massachusetts
Michigan
Minnesota
North Carolina
New Jersey
New York
Pennsylvania
Texas
States without genomic data
In absence of genomic data, the growth advantage s = 0.08 is assumed. The current strength of the B117 is estimated from the fit to case data. Essentially this is derived by how fare the case data deviate from the expected trajectory for the original strain model (orange dashed curve). For states where the deviation is just beginning, there will be significant uncertainty on the timing of the next peak.
These model fits assume that there is no change to NPI (non-pharmiceutical intervention) between the vertical dotted lines. Such NPI changes can lead to large changes in the projections for the future growth of the variant.
Alaska
Alabama
Arkansas
Colorado
Connecticut
District Of Columbia
Delaware
Hawaii
Iowa
Idaho
Kansas
Kentucky
Maryland
Maine
Missouri
Mississippi
Montana
North Dakota
Nebraska
New Hampshire
New Mexico
Nevada
Ohio
Oklahoma
Oregon
Puerto Rico
Rhode Island
South Carolina
South Dakota
Tennessee
Utah
Virginia
Vermont
Washington
Wisconsin
West Virginia
Wyoming
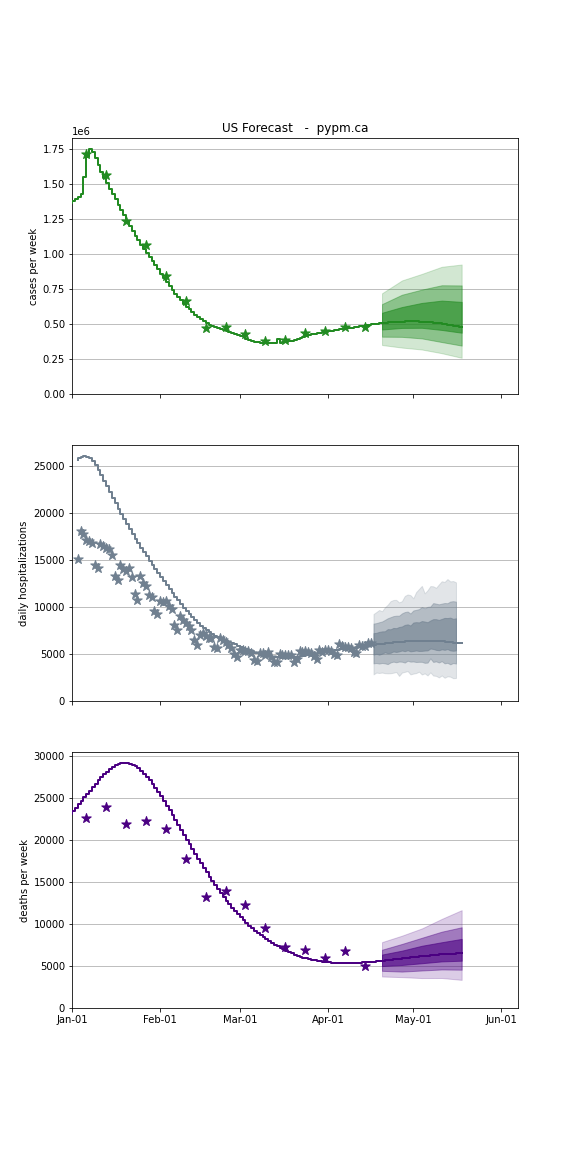
Forecasts
The following plots show the combined US 4 week forecast. The shaded areas are 50%, 80%, and 95% intervals.
USA
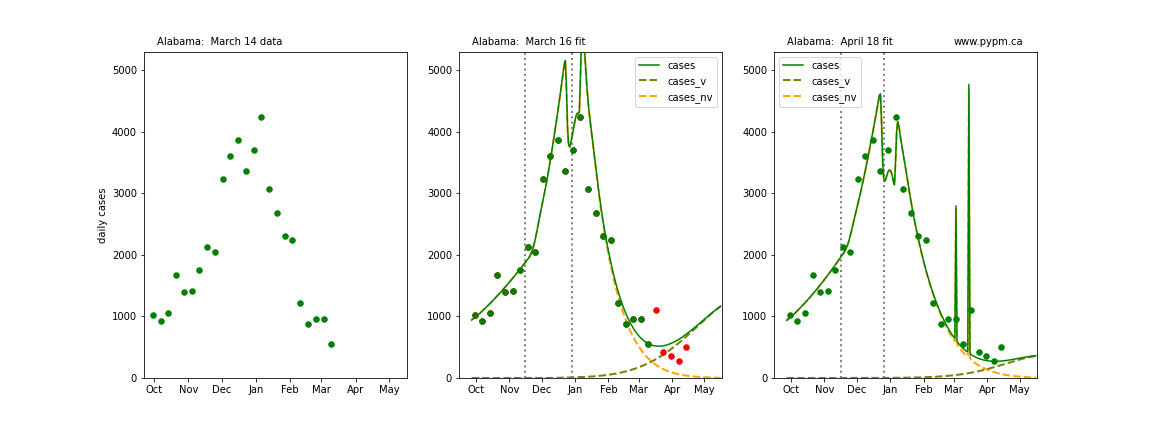
Comparison with model fit to case data from 5 weeks ago
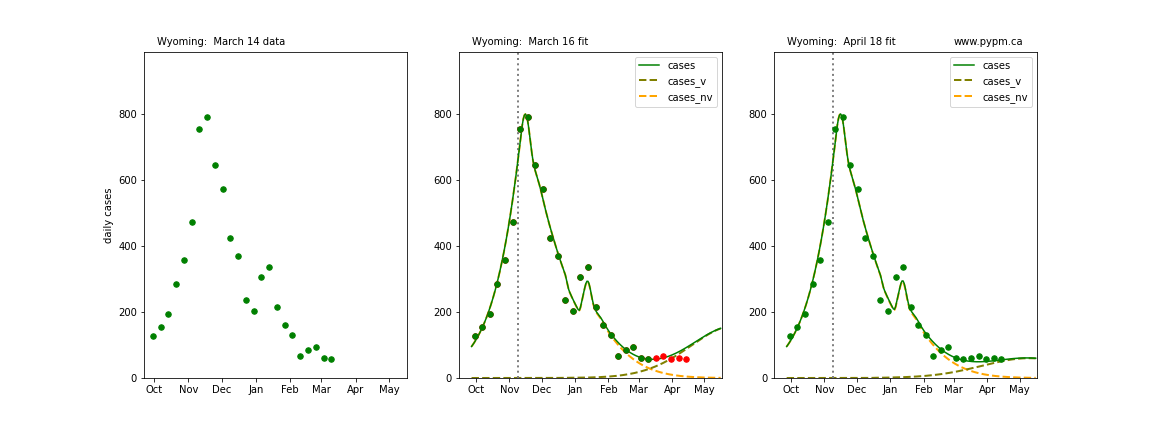
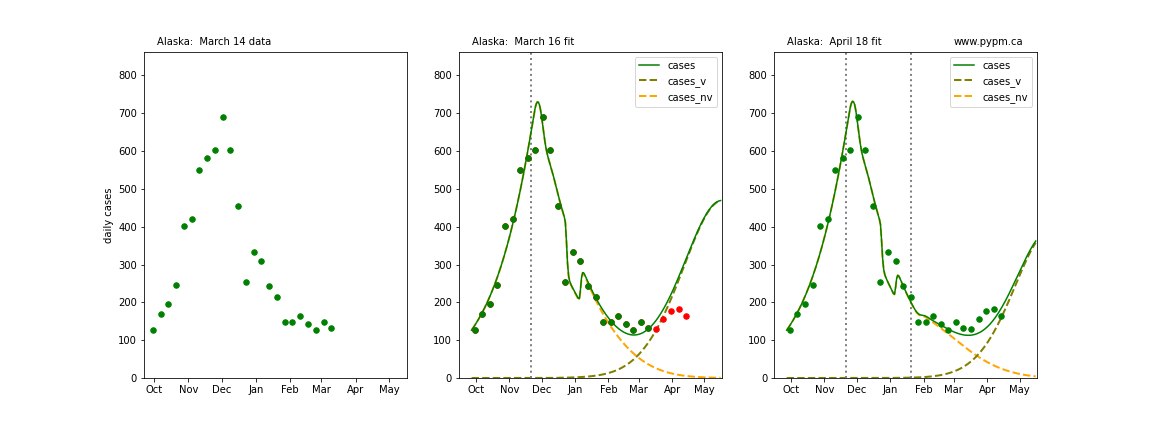
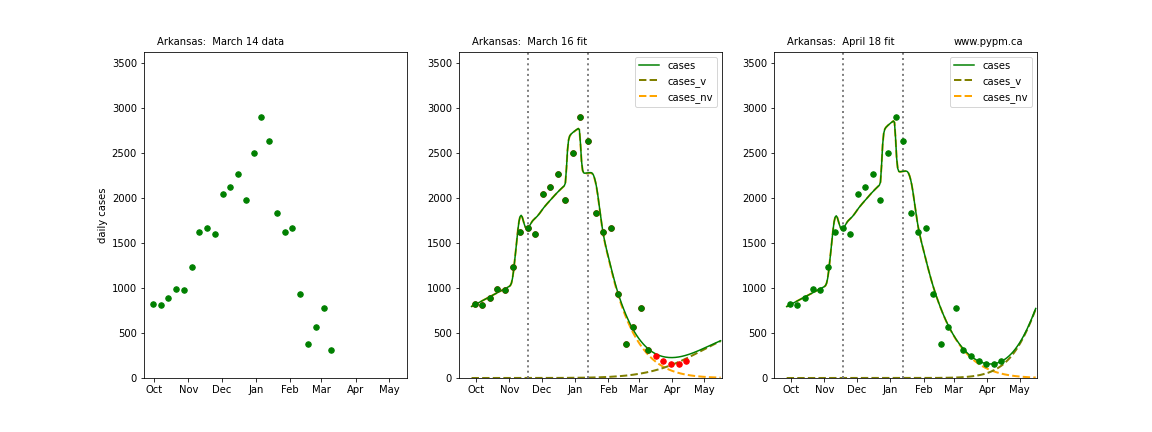
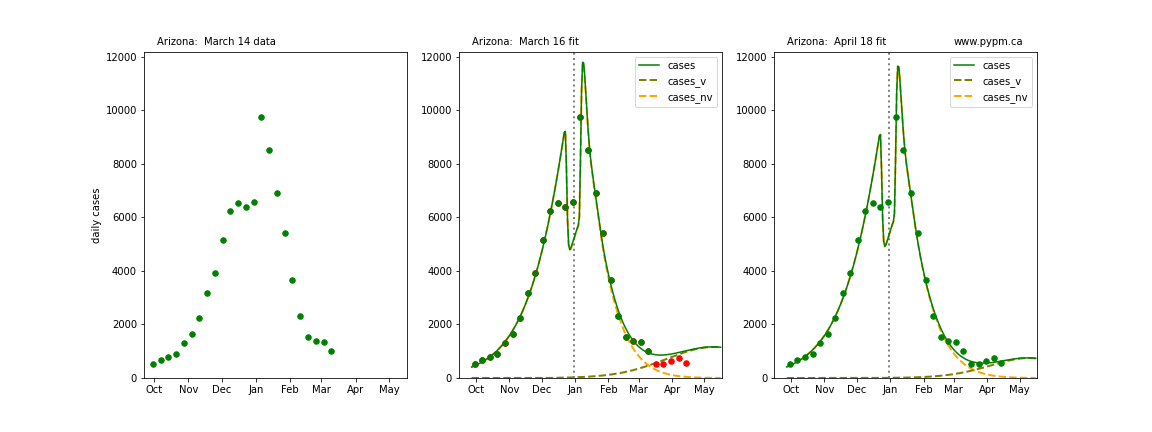
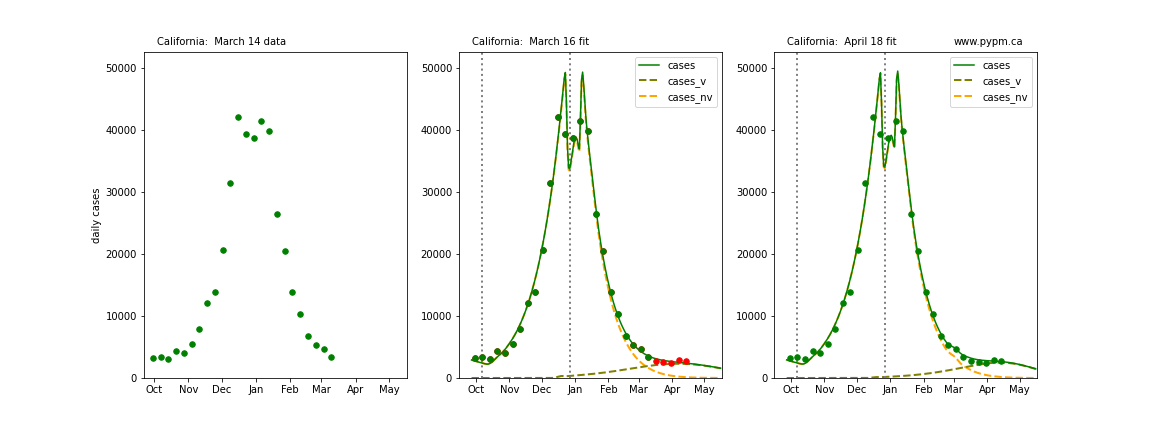
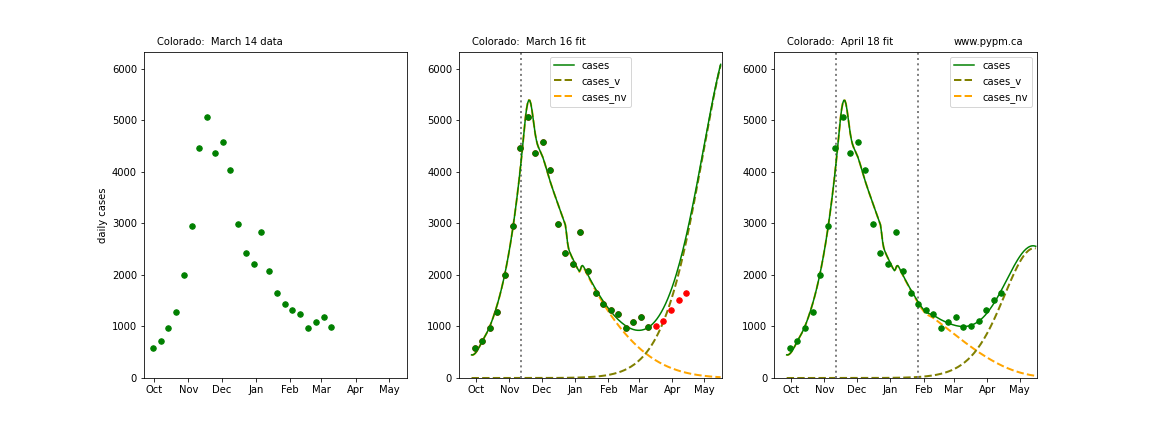
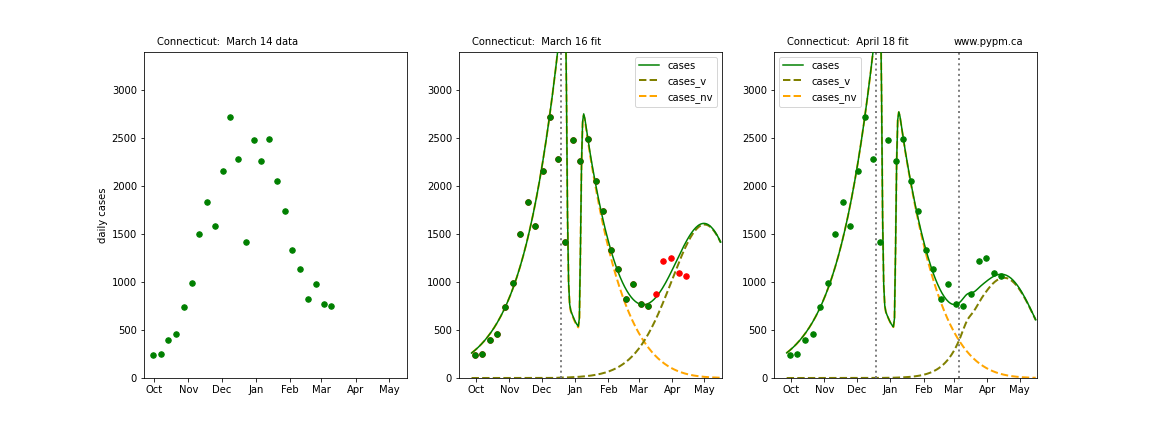
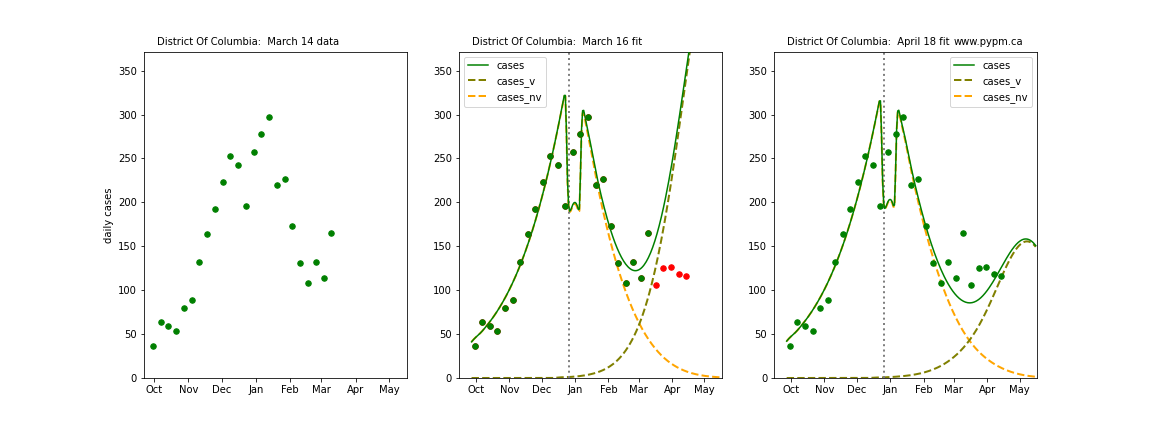
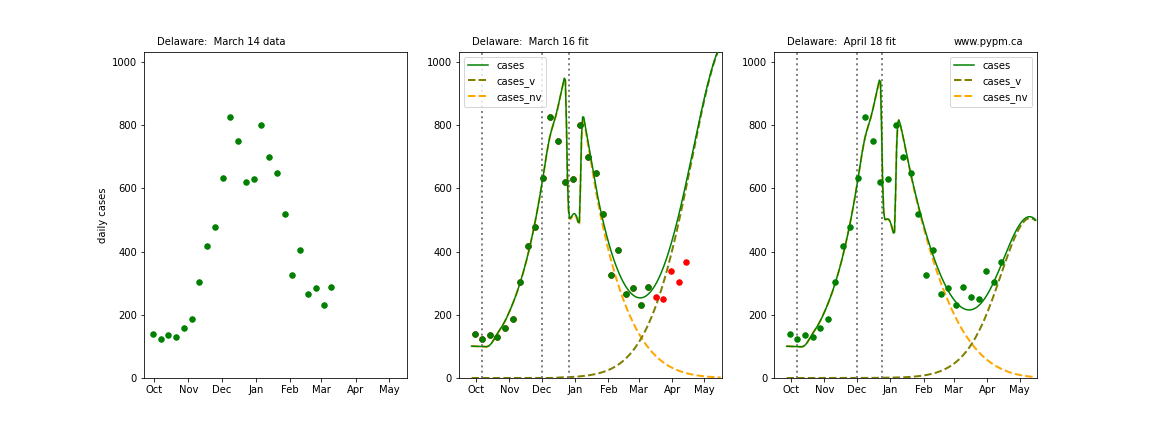
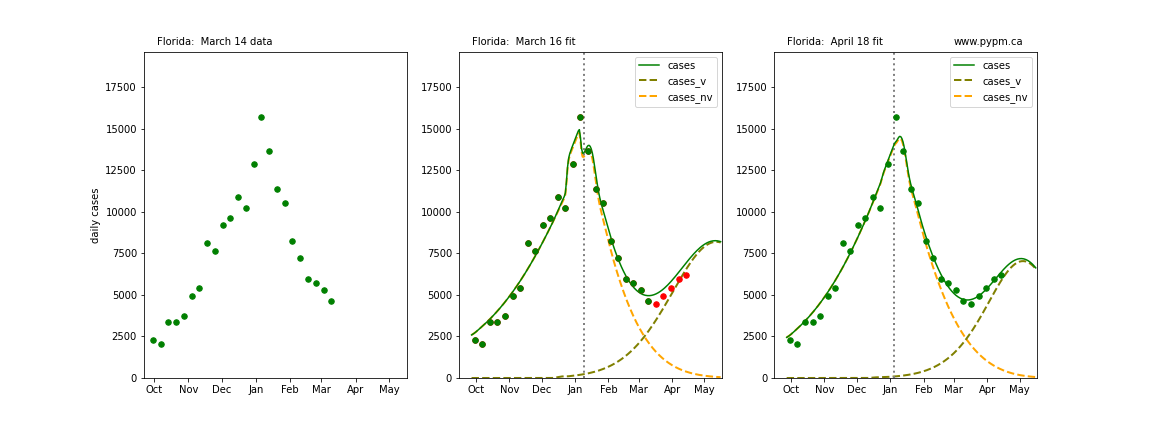
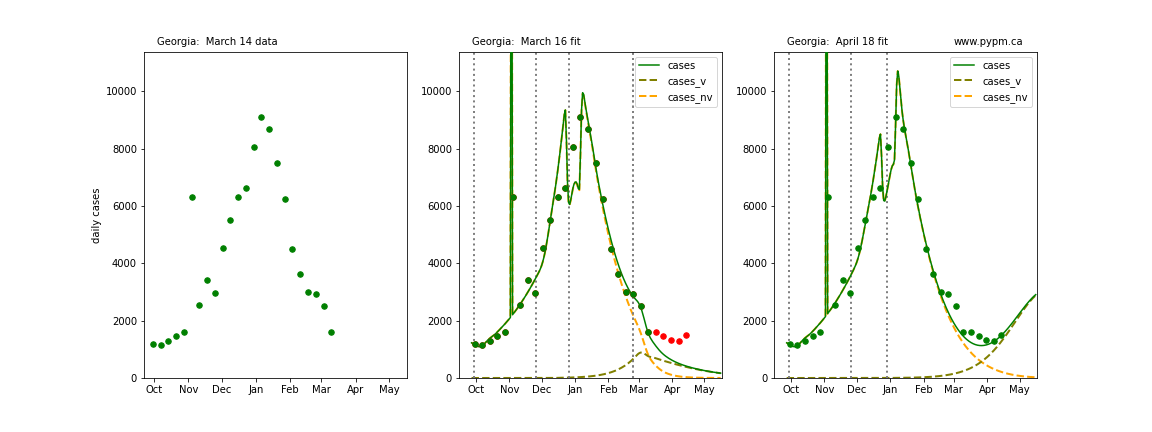
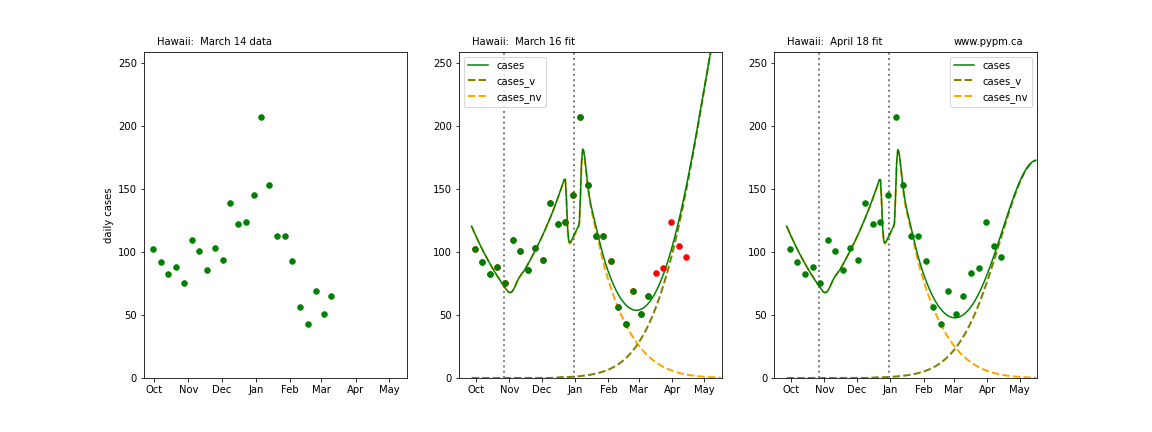
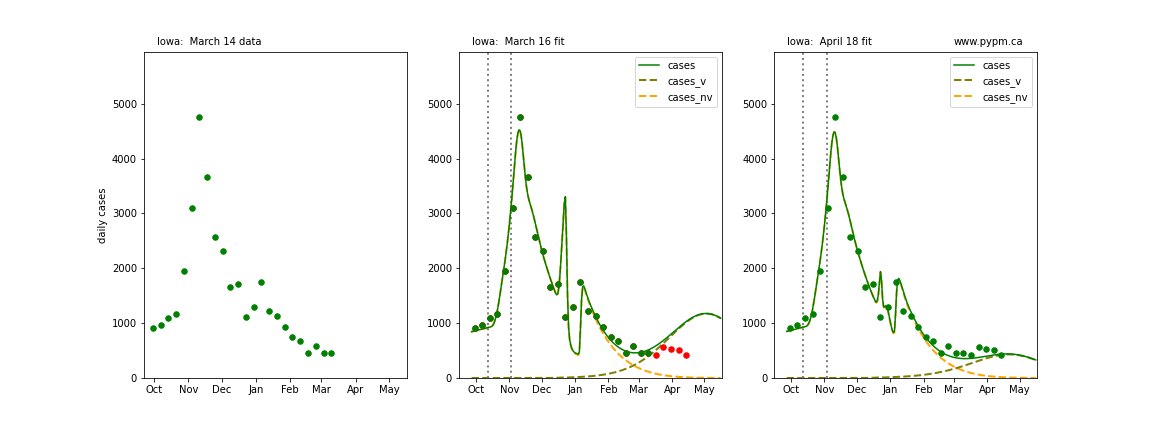
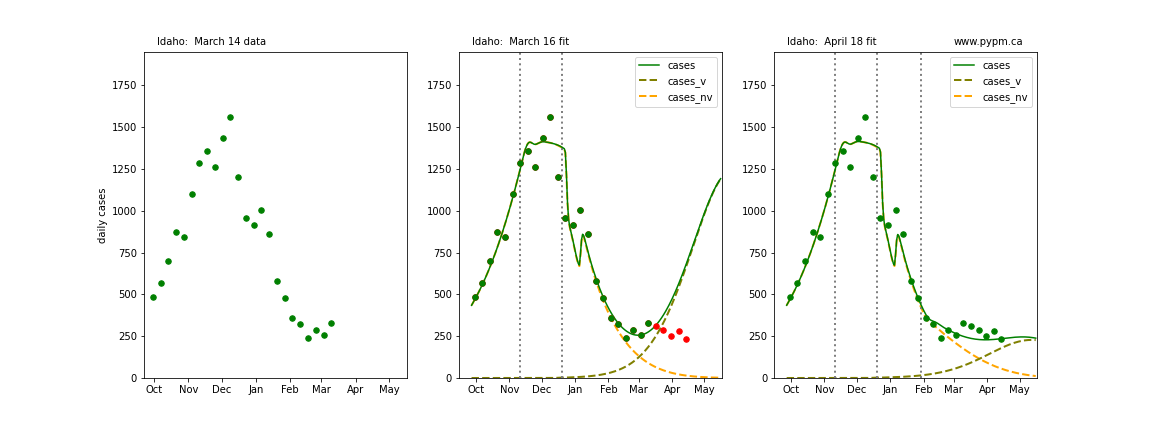
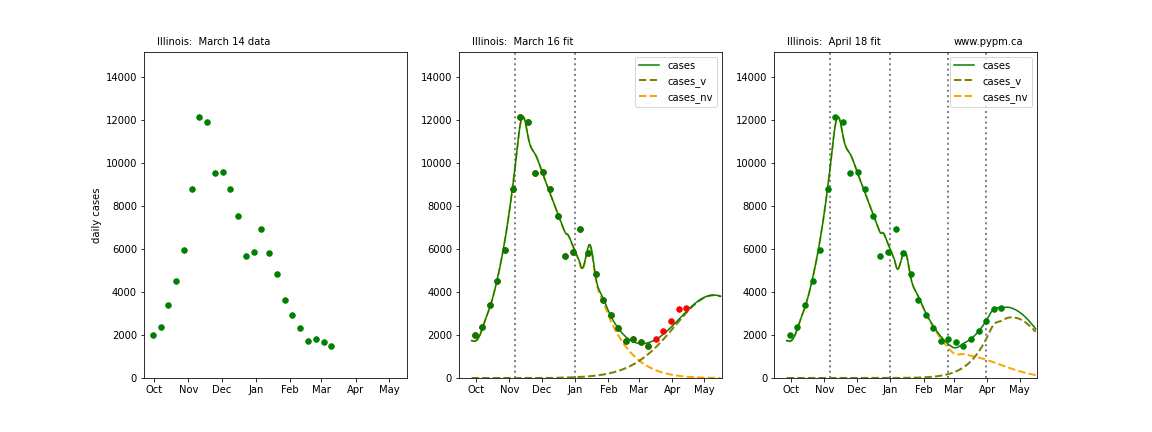
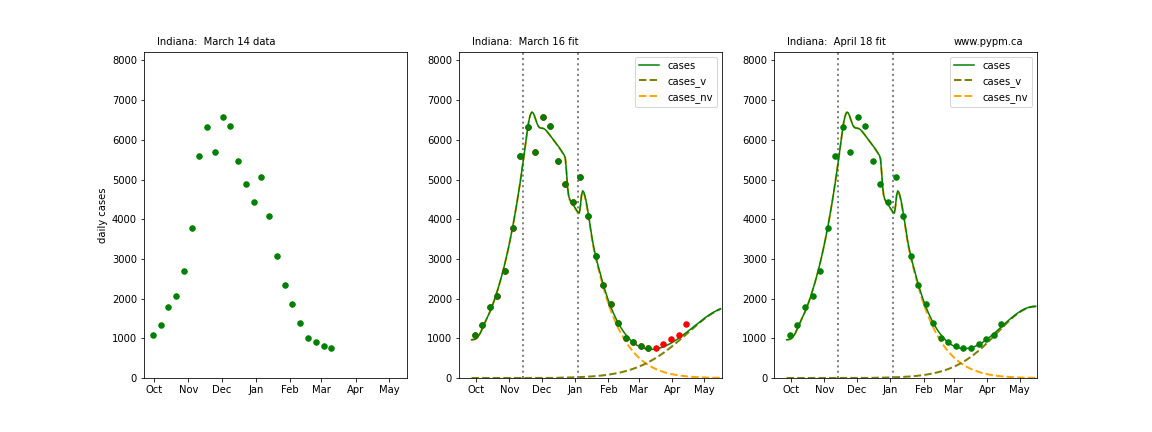
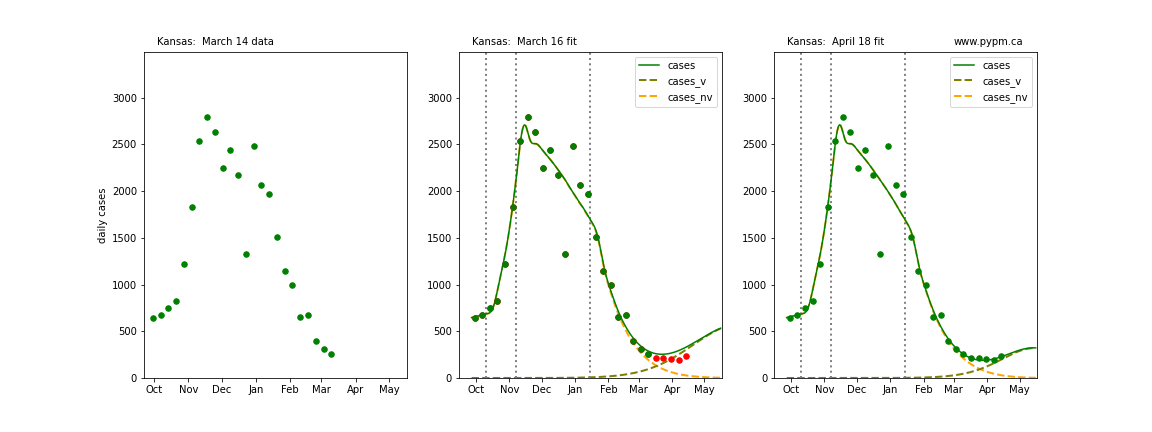
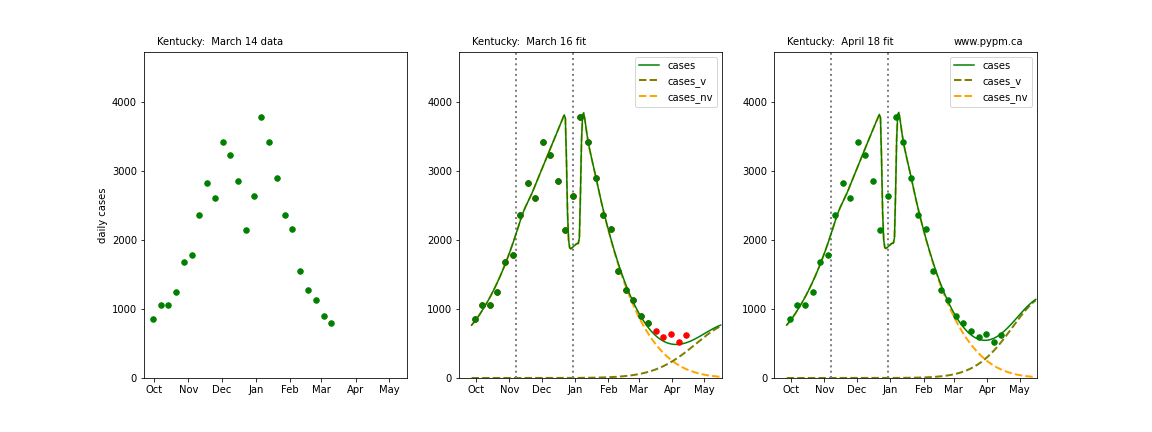
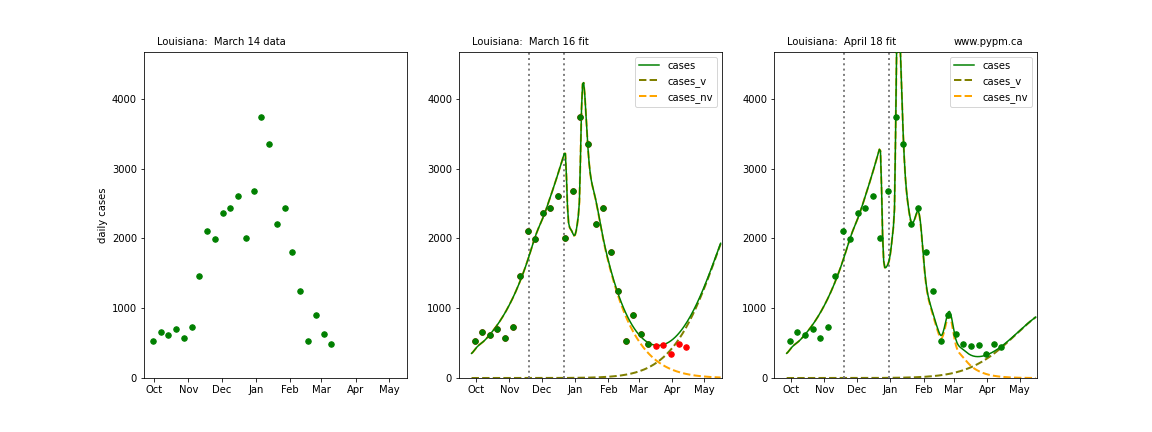
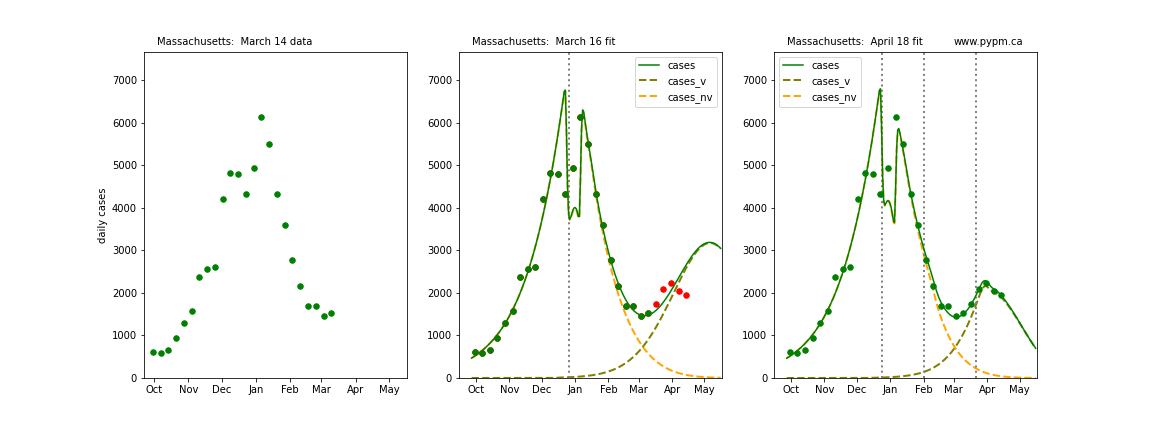
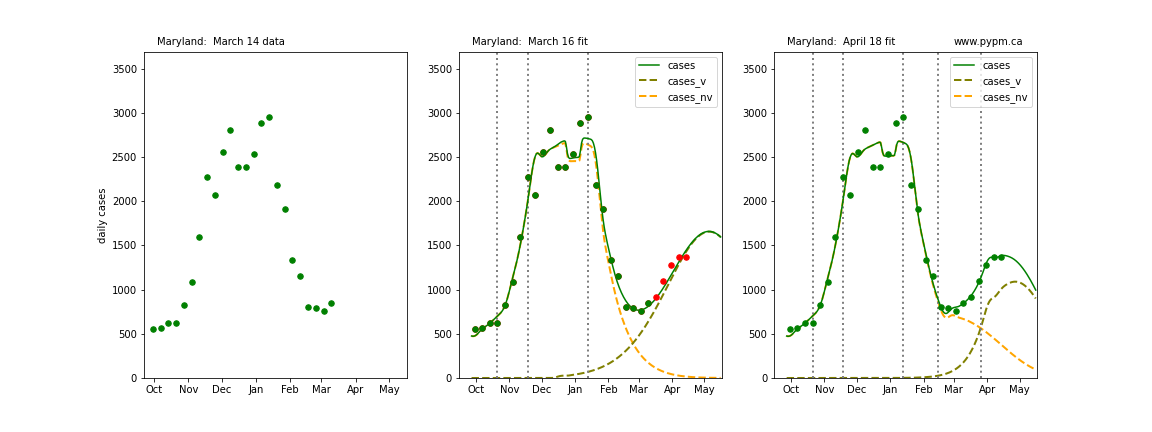
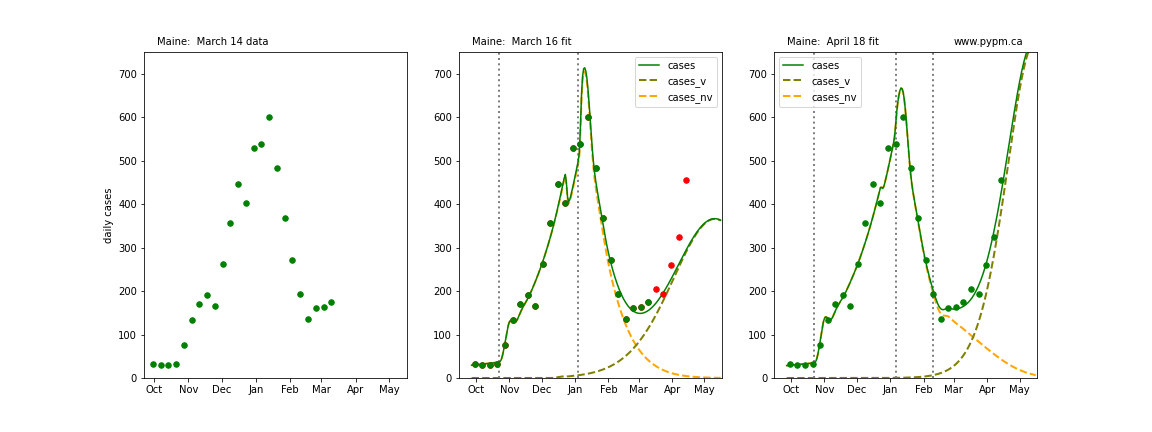
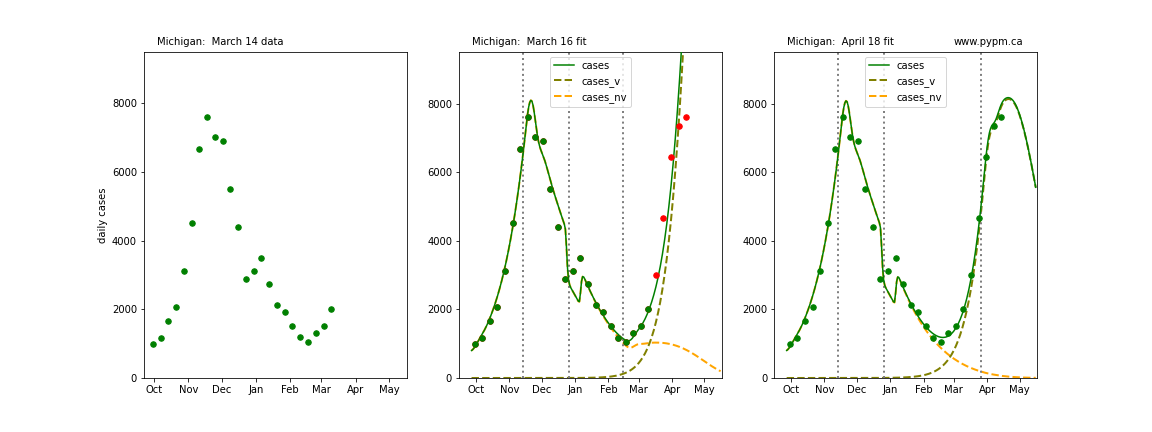
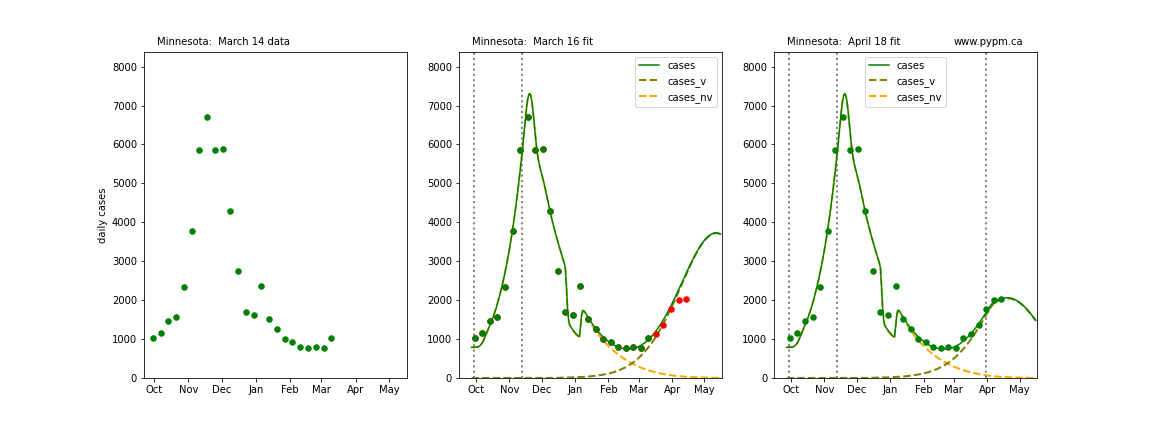
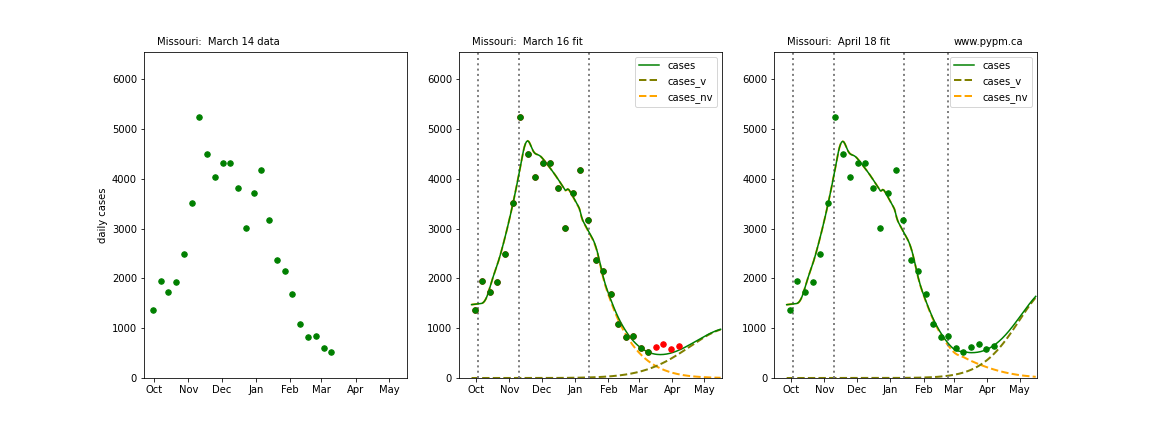
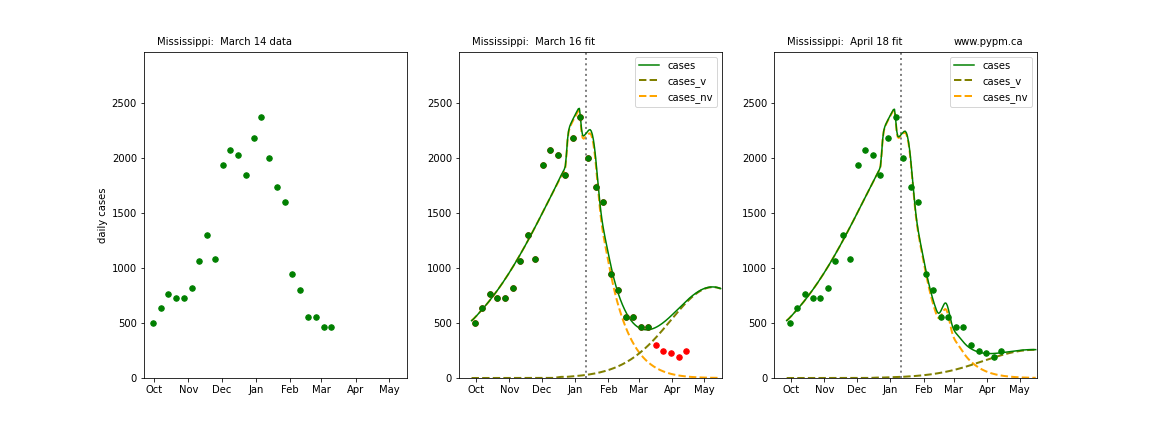
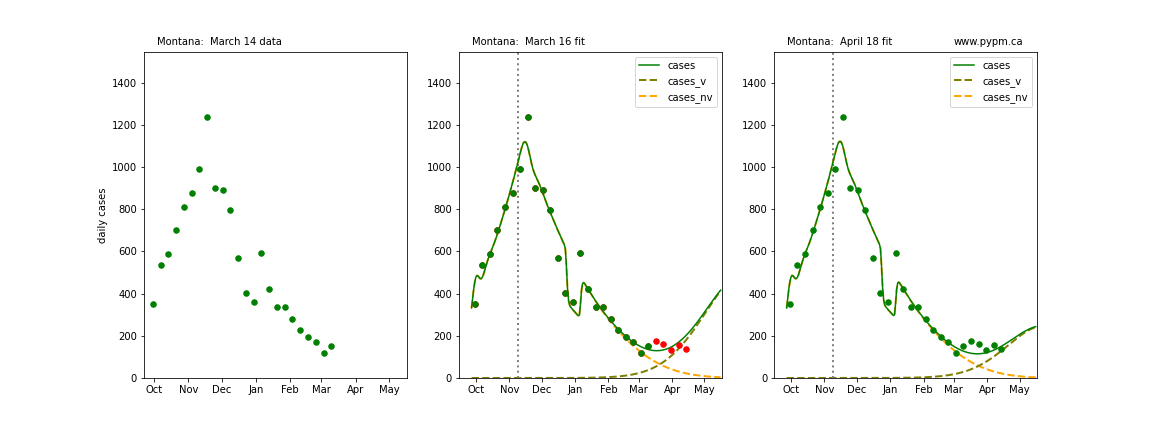
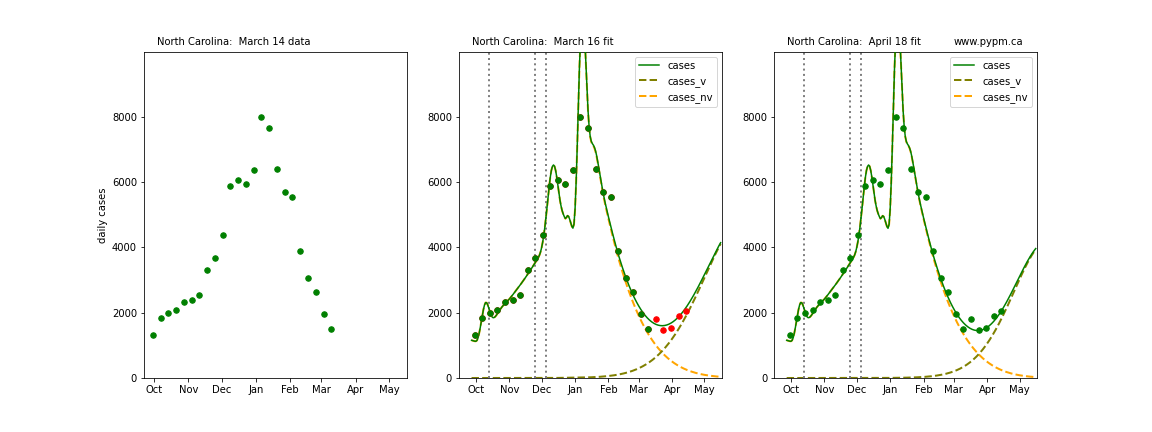
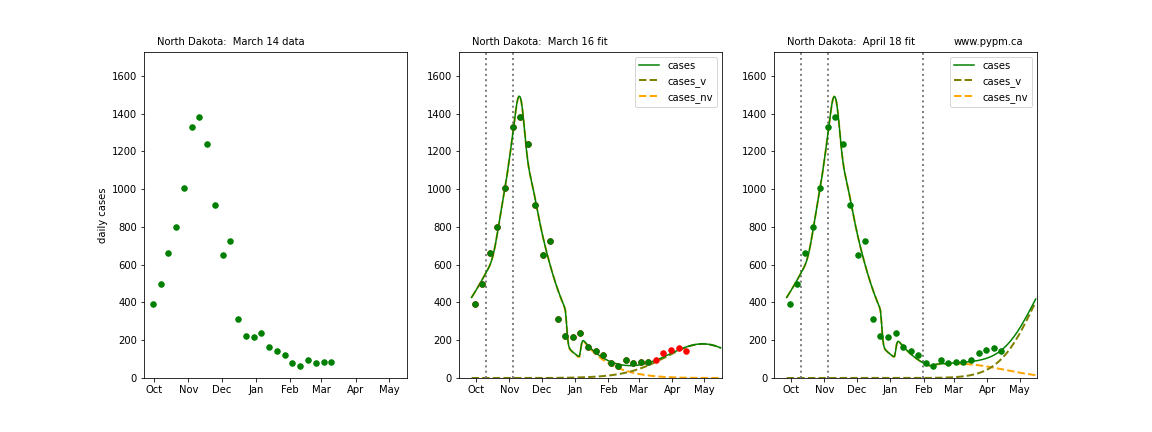
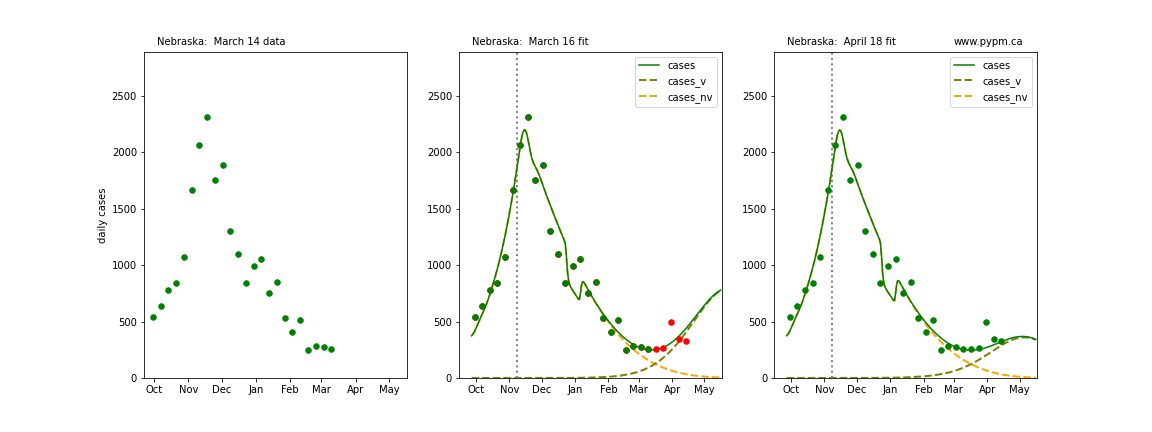
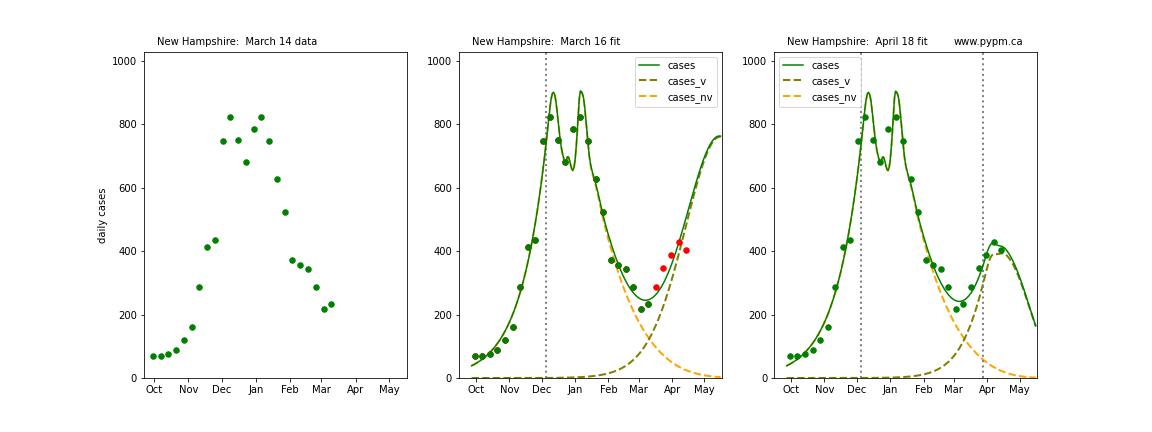
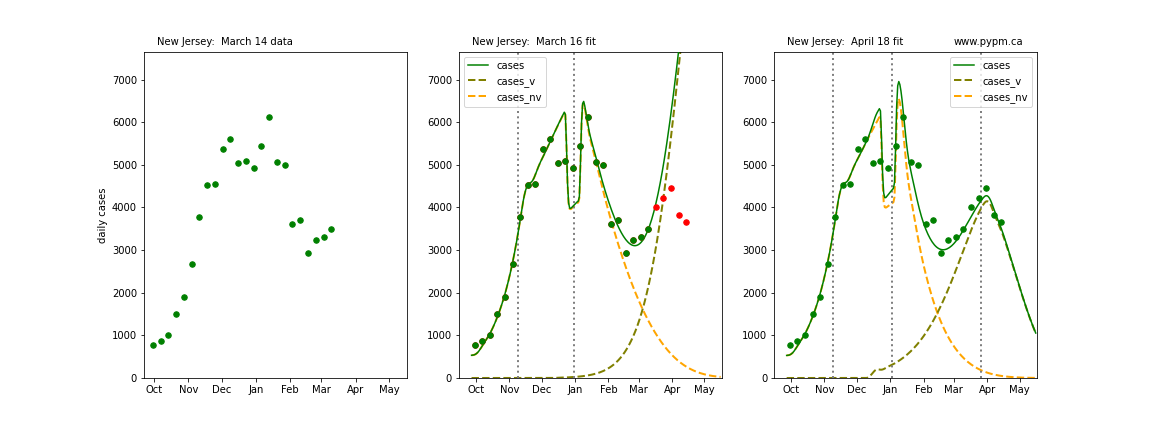
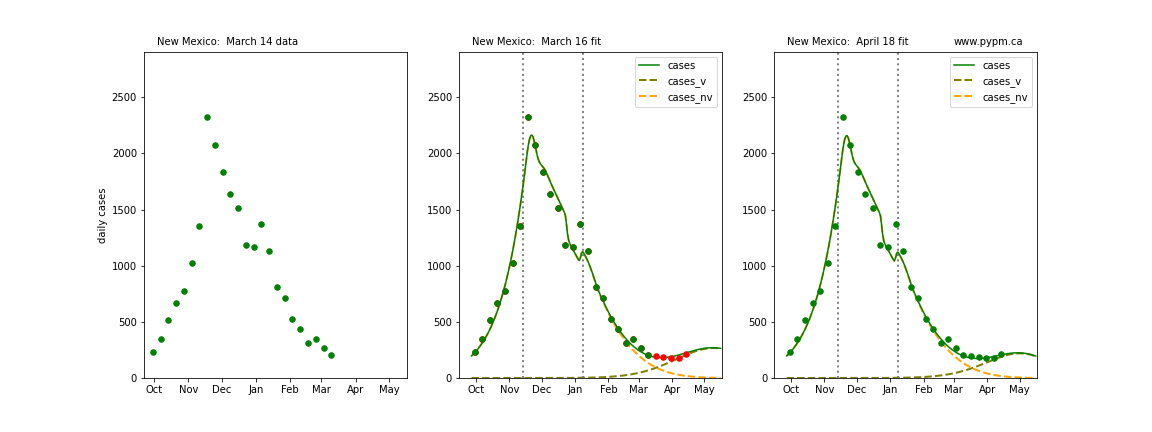
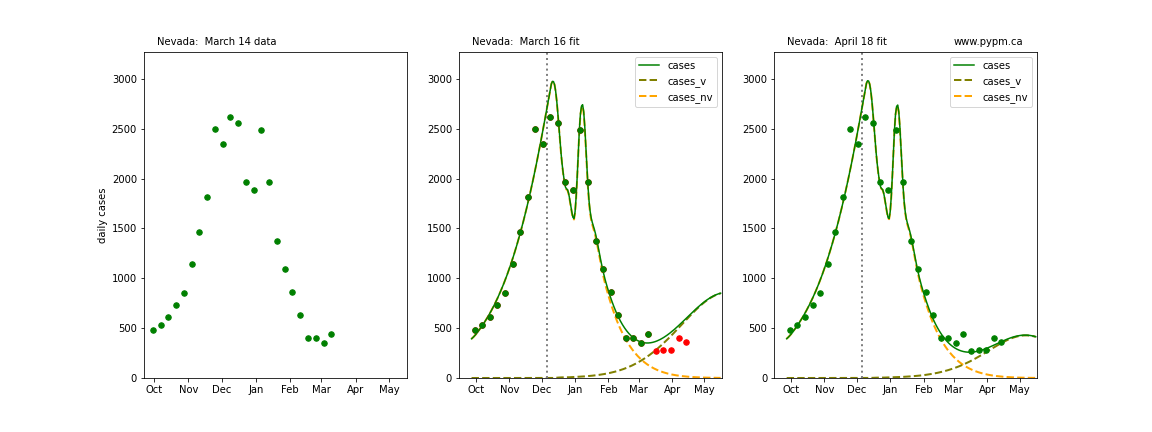
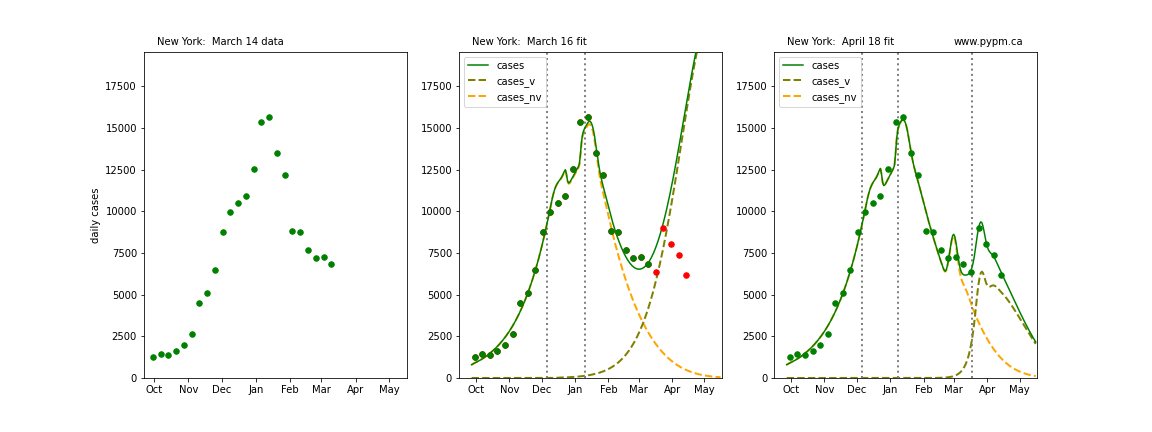
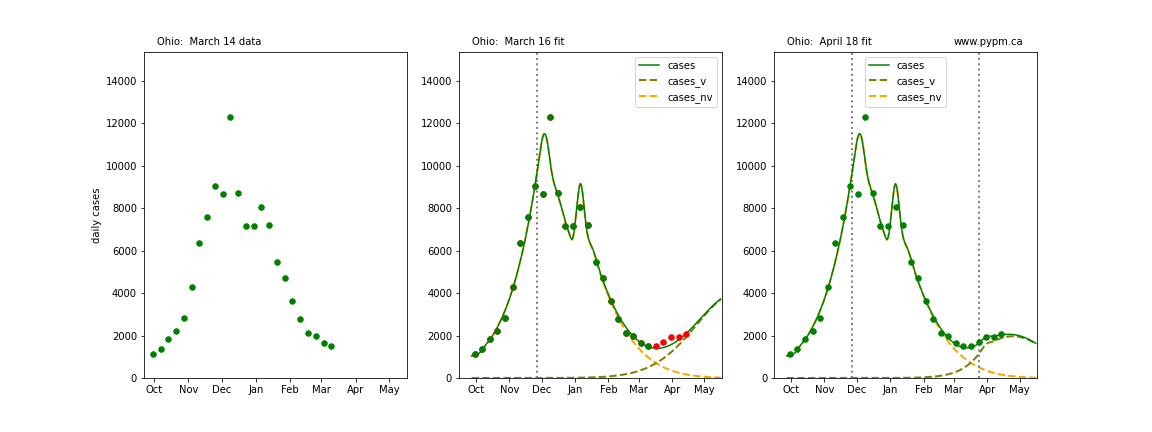
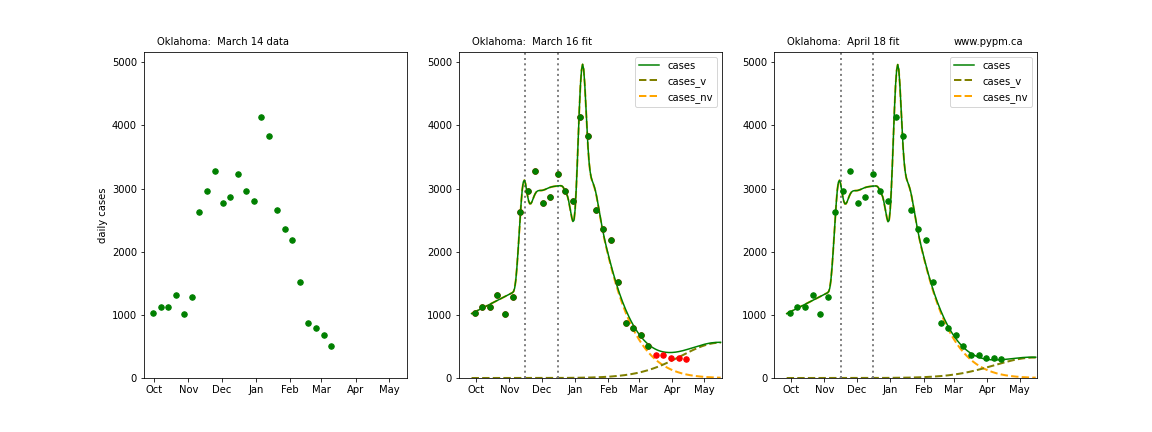
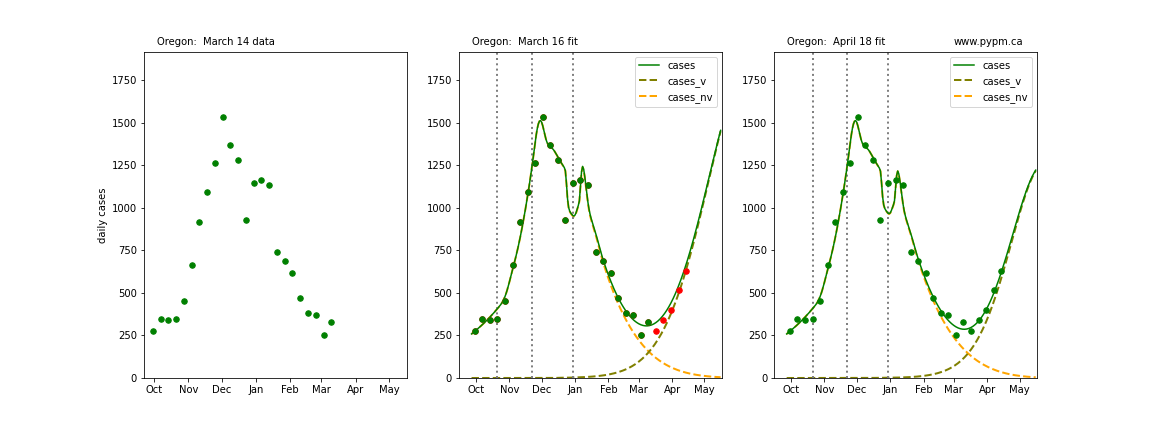
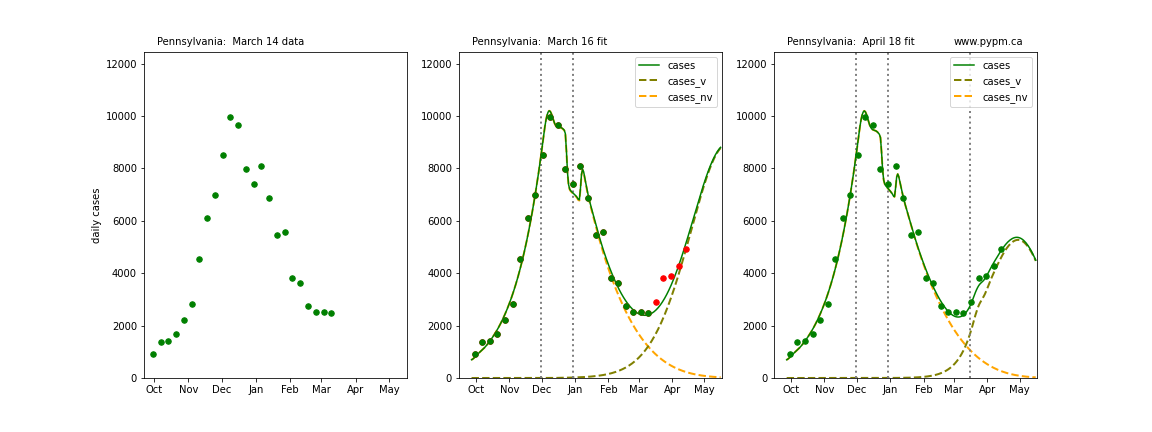
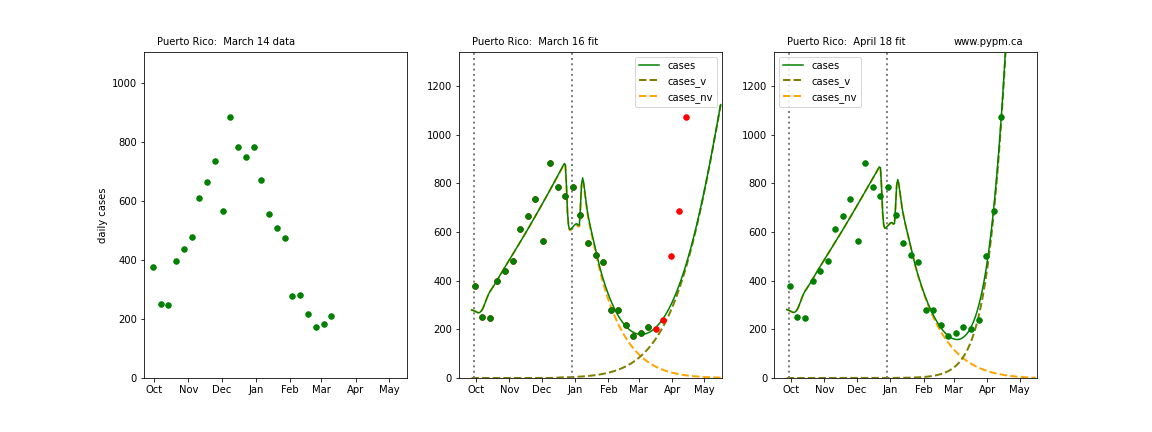
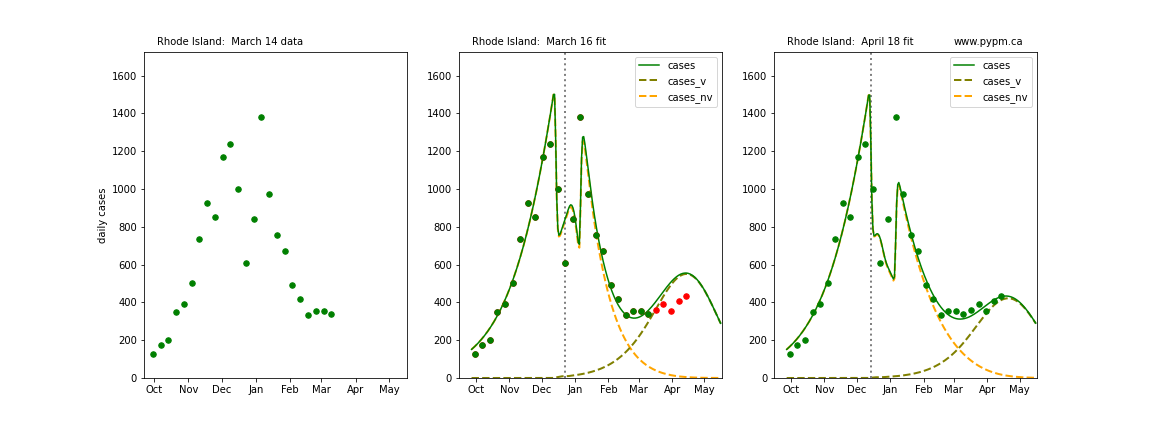
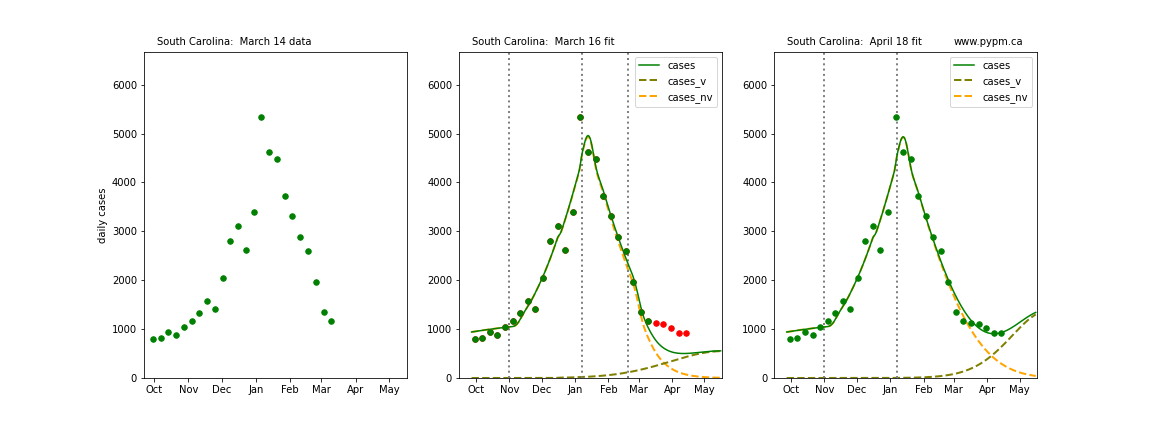
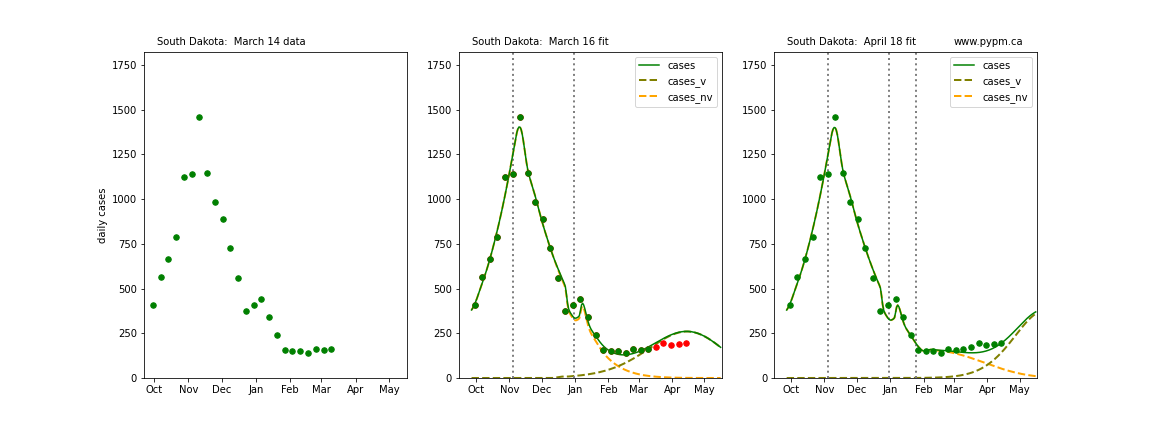
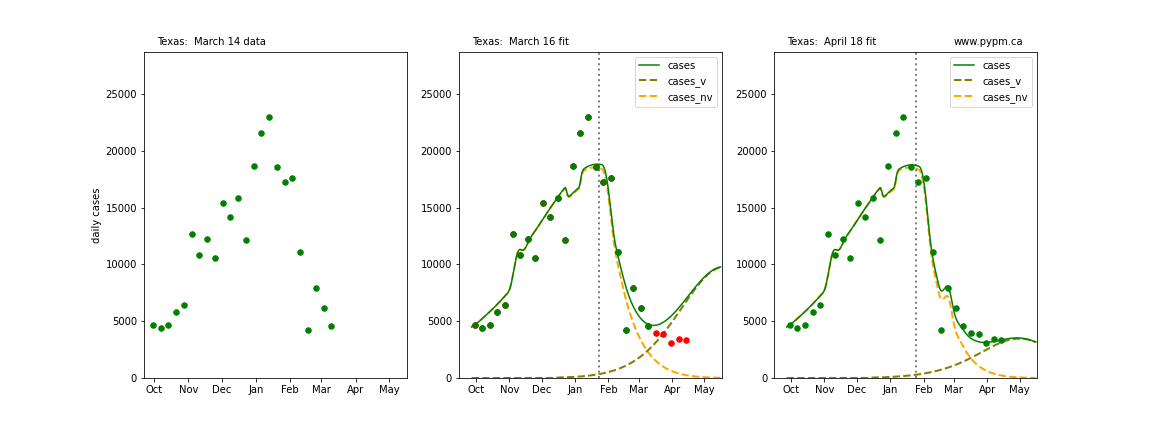
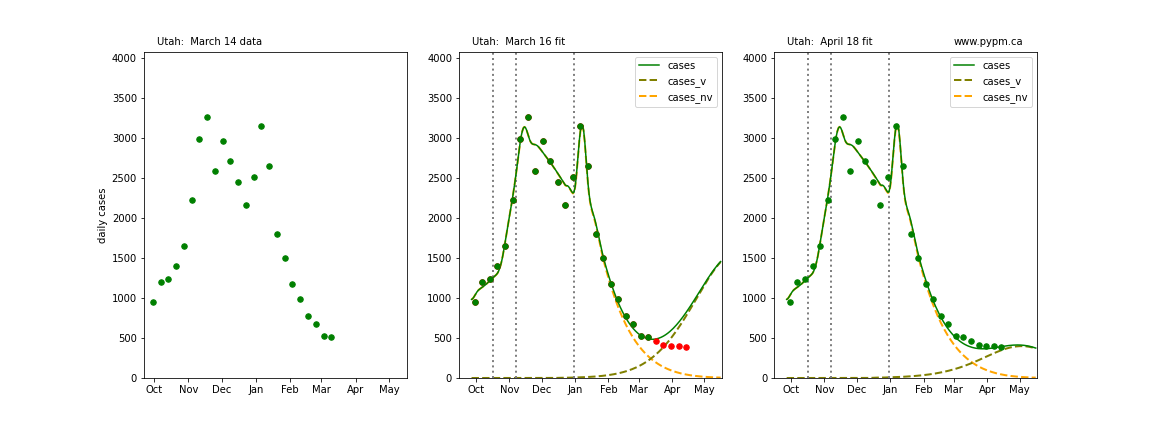
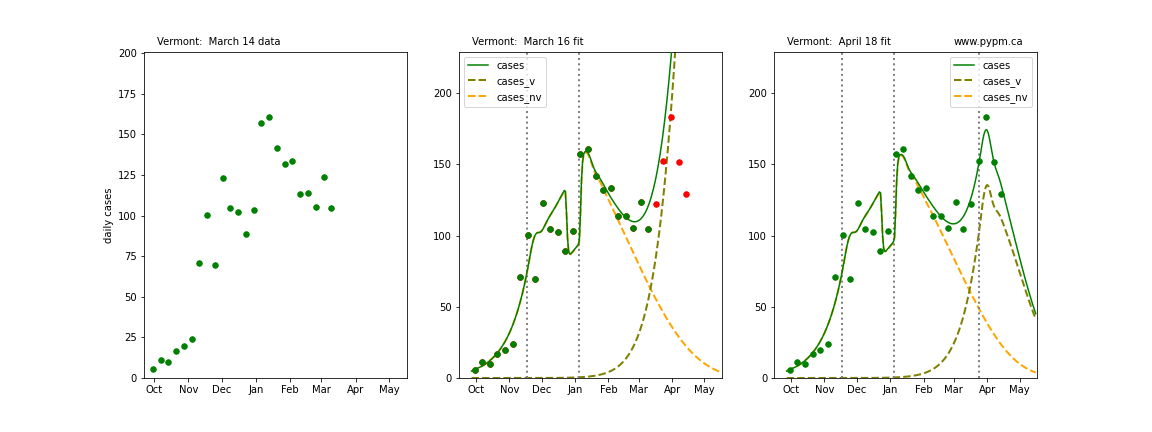
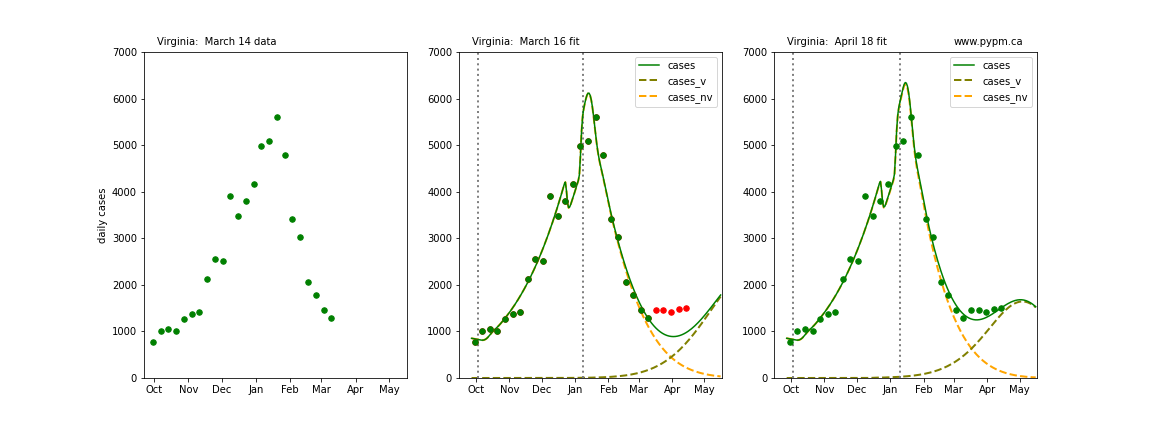
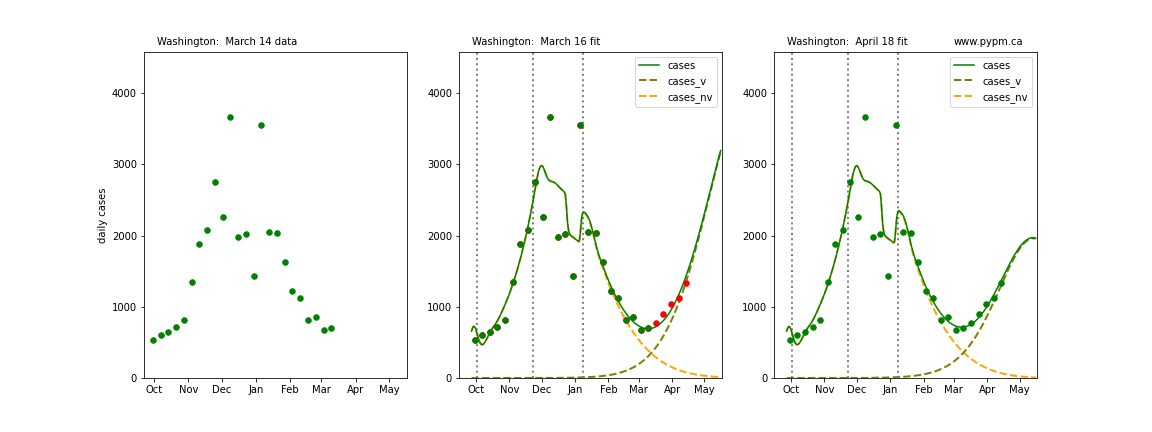
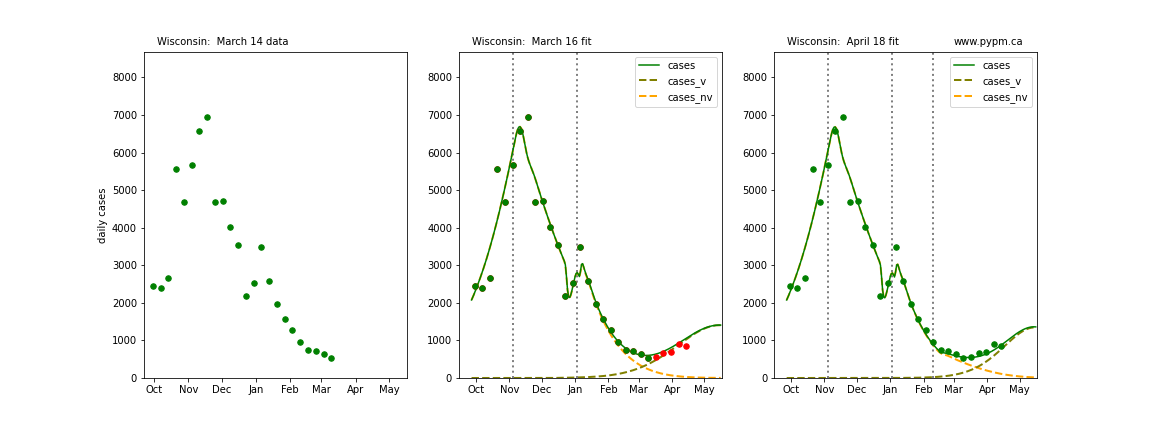
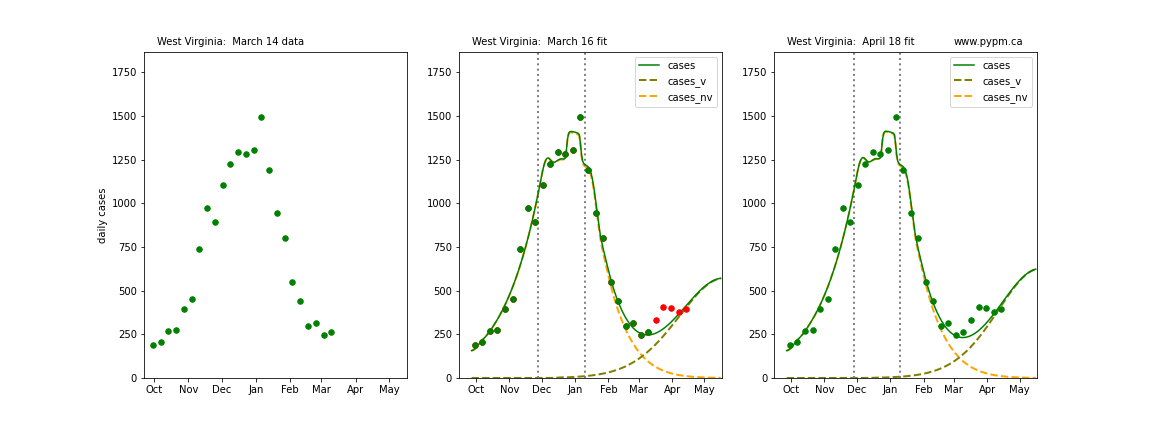
The following plots show 3 figures for each state
- Left: case data available until March 14
- Middle: case data fit on March 16. Red points show data collected after model fit
- Right: case data fit on April 18.
For many states, the 2 strain model correctly predicted the rise following the plateau. In several cases, the rise was predicted to come earlier than obsevered. Without genomic data, the fraction of cases arising from variants of concern is unknown before observing the rise in cases.
Alabama
Alaska
Arkansas
Arizona
California
Colorado
Connecticut
District Of Columbia
Delaware
Florida
Georgia
Hawaii
Iowa
Idaho
Illinois
Indiana
Kansas
Kentucky
Louisiana
Massachusetts
Maryland
Maine
Michigan
Minnesota
Missouri
Mississippi
Montana
North Carolina
North Dakota
Nebraska
New Hampshire
New Jersey
New Mexico
Nevada
New York
Ohio
Oklahoma
Oregon
Pennsylvania
Puerto Rico
Rhode Island
South Carolina
South Dakota
Tennessee

Texas
Utah
Vermont
Virginia
Washington
Wisconsin
West Virginia
Wyoming