January 22, 2023
This report shows the result of analyses that use hospital admission data to estimate the transmission rates in the past few months to characterize the recent Omicron waves. Hospital admission data are used, to avoid testing capacity issues and to better predict future hospital admission rates.
The modelling approach for US states has now changed to follow the approach first applied in July for European nations. See this link for more information.
In the figures below, the small dots show daily values, and the larger circles are weekly averages to help guide the eye. There are no changes to transmission rates (normally shown by dashed vertical lines) within the time periods shown below. Each strain has just 2 parameters (transmission rate and timing). The complex dynamics arise from the changing immunity of the population.
Individual state hospitalization analyses
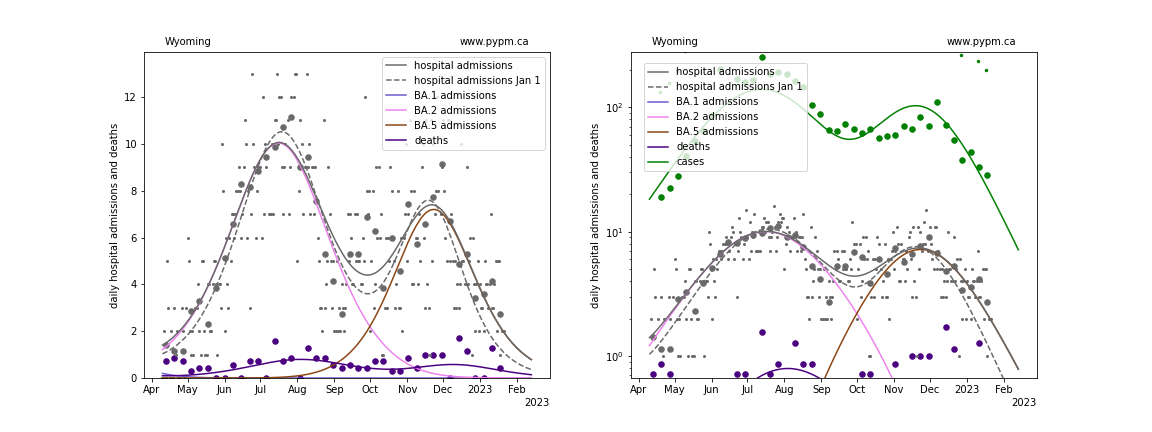
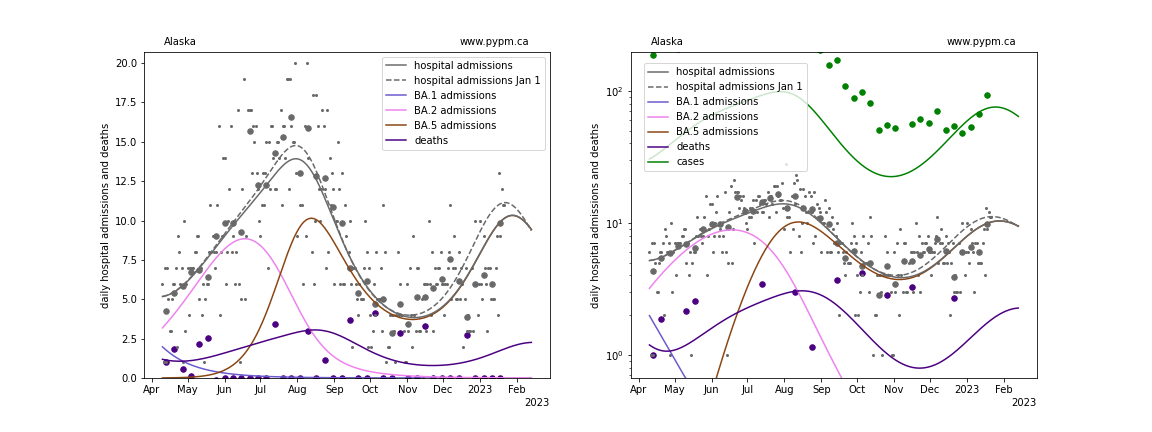
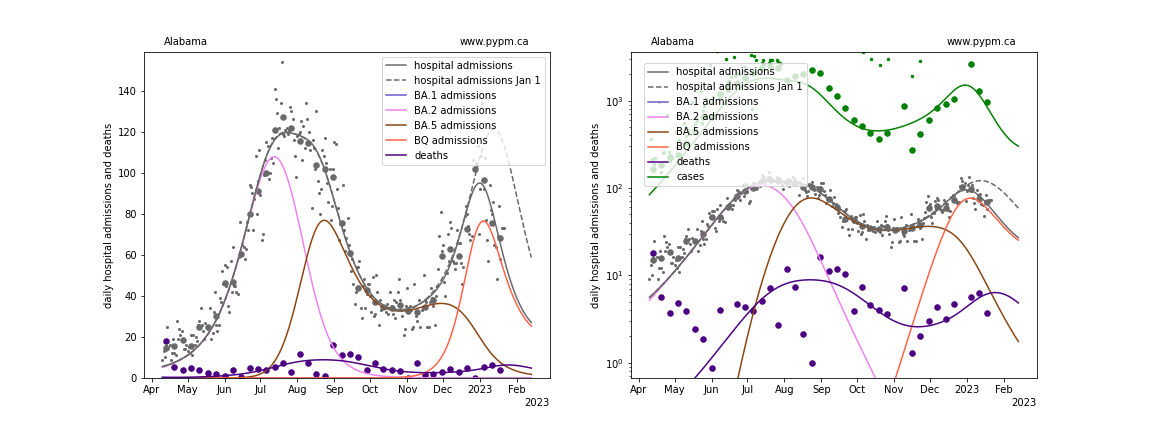
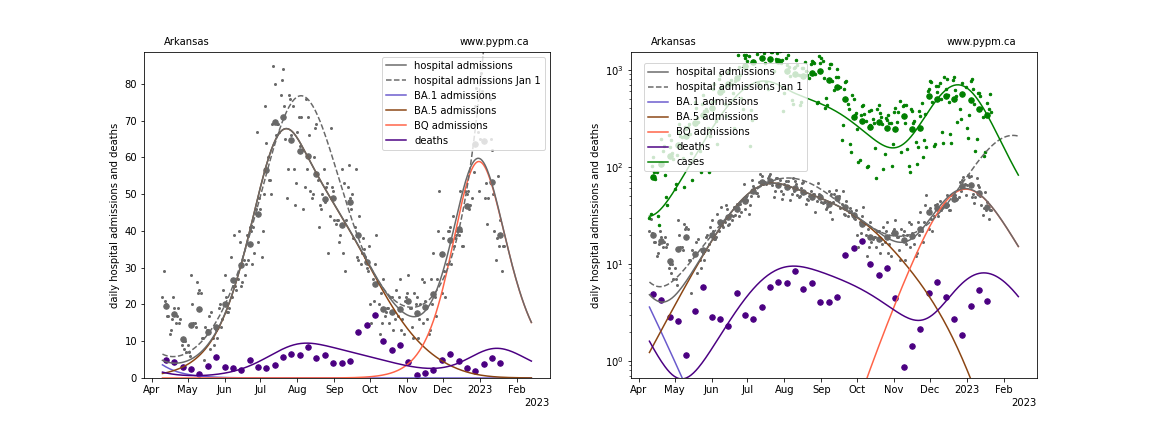
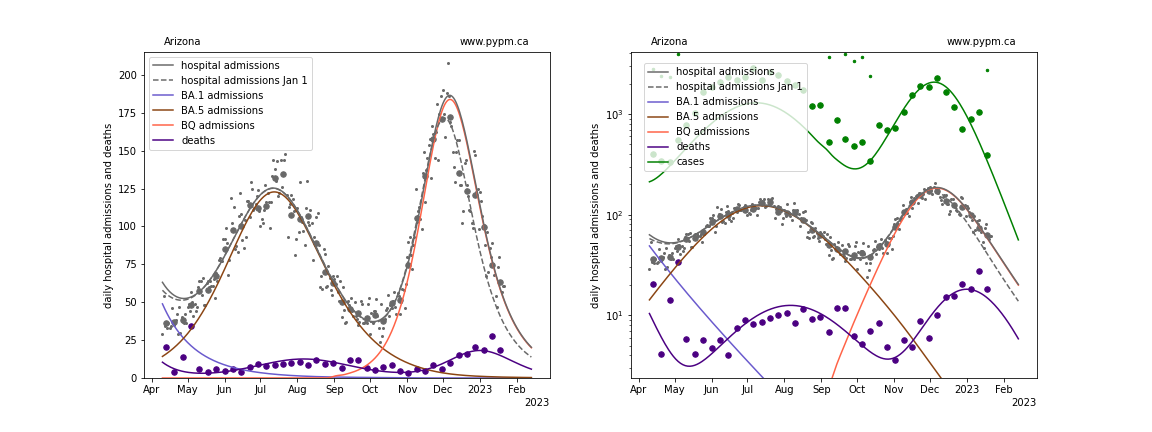
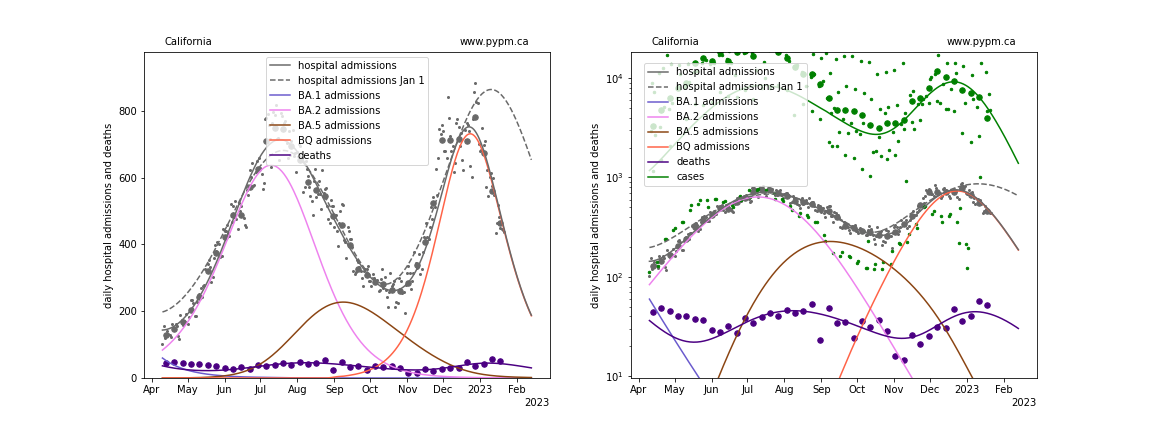
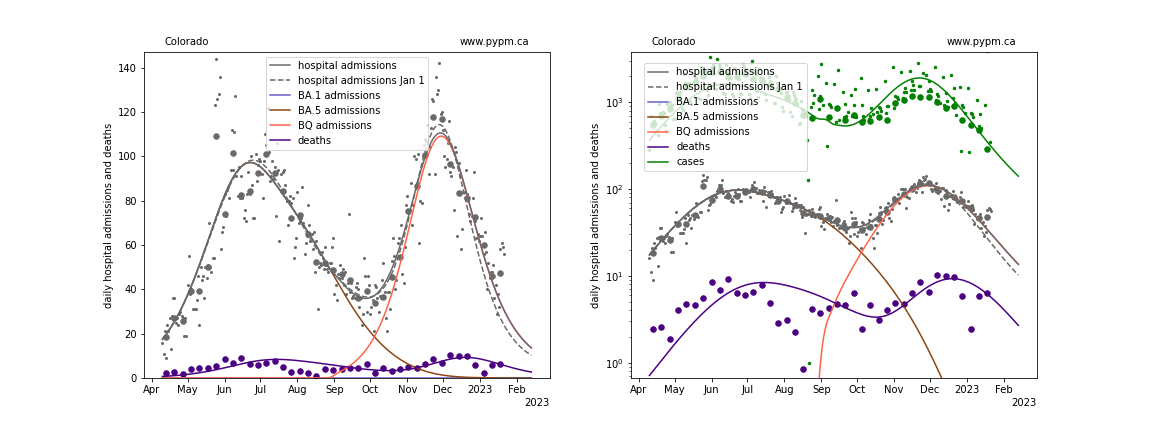
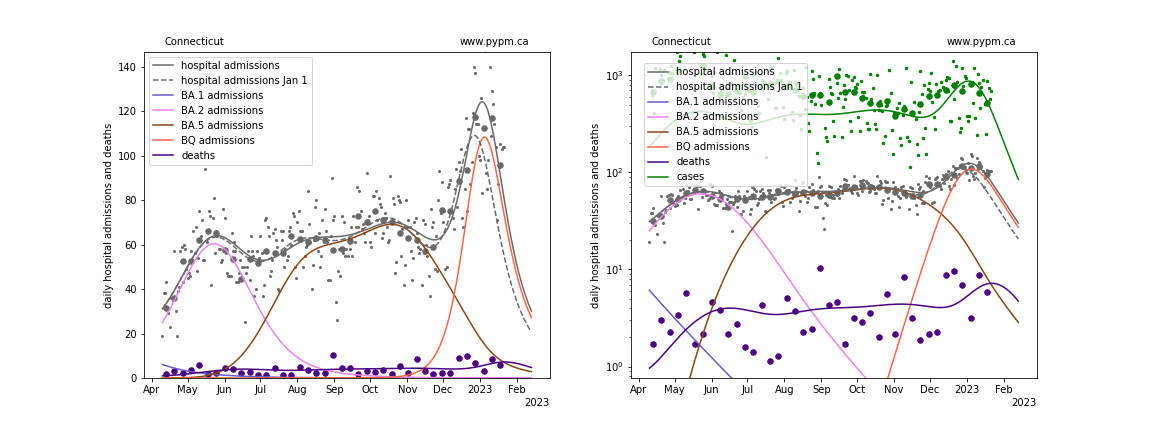
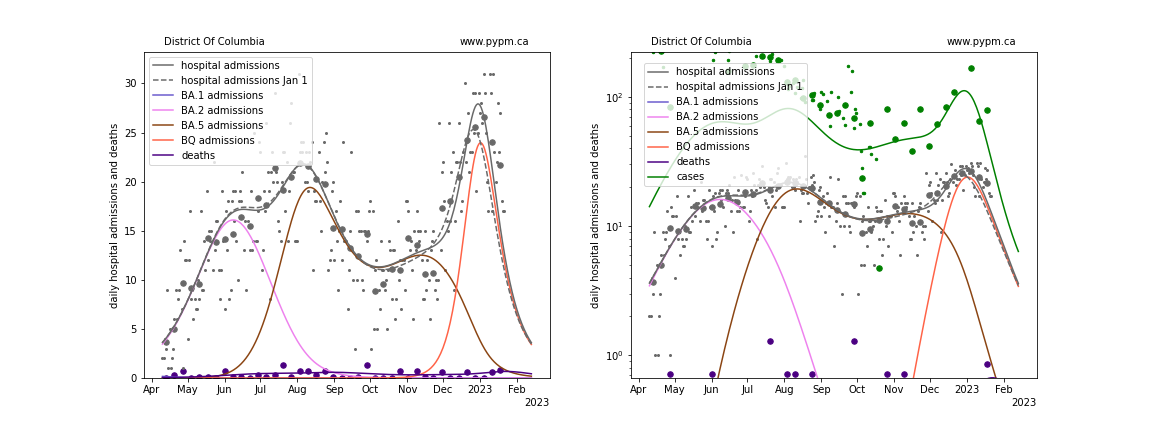
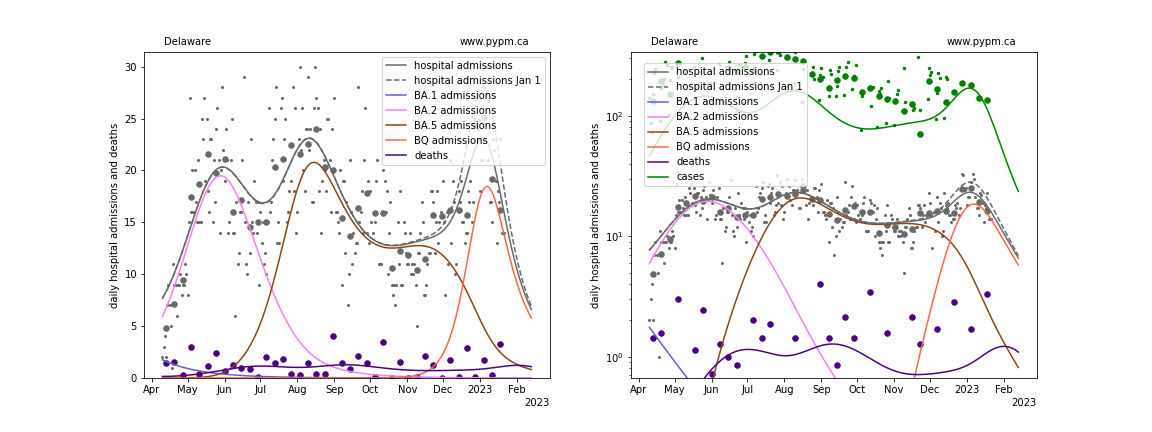
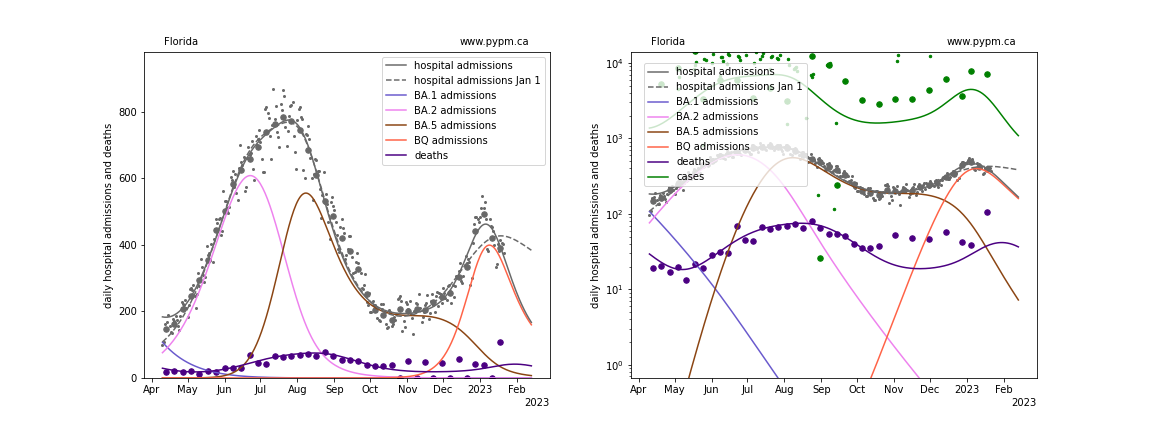
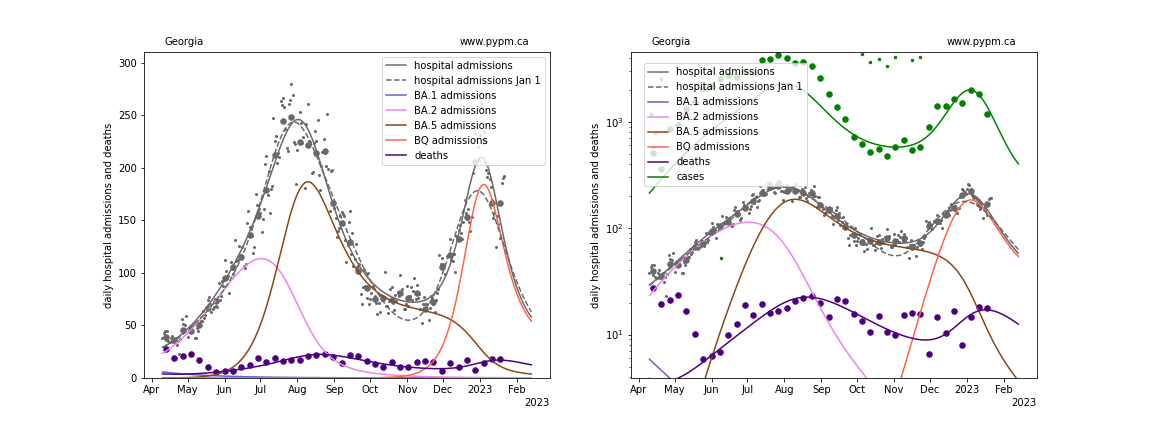
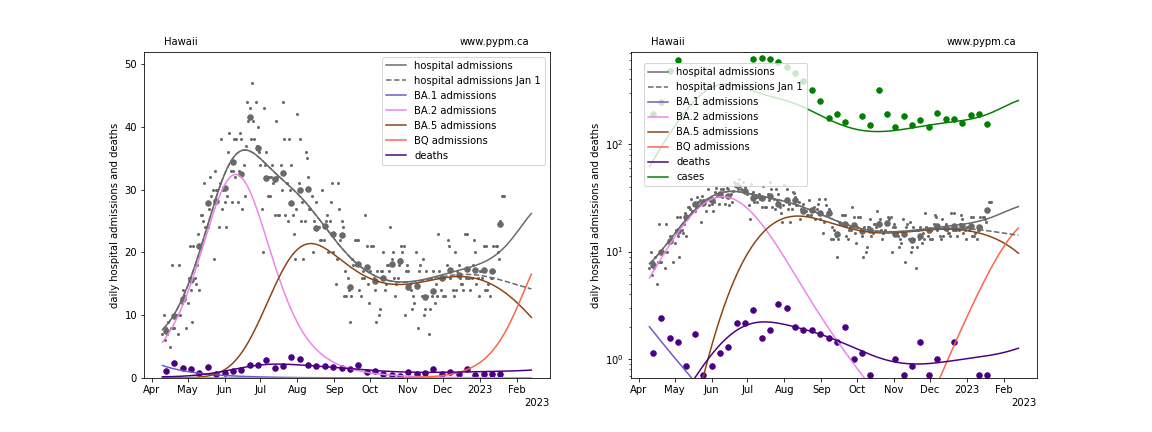
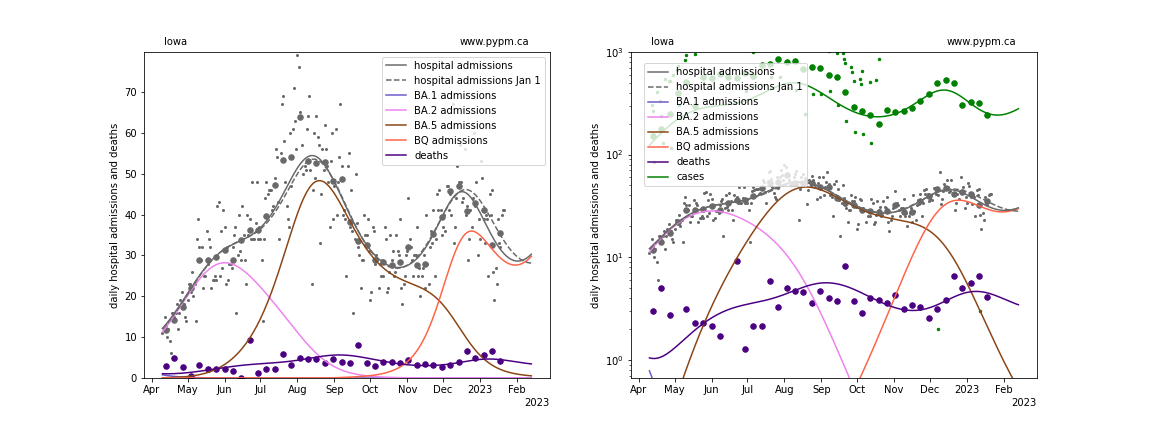
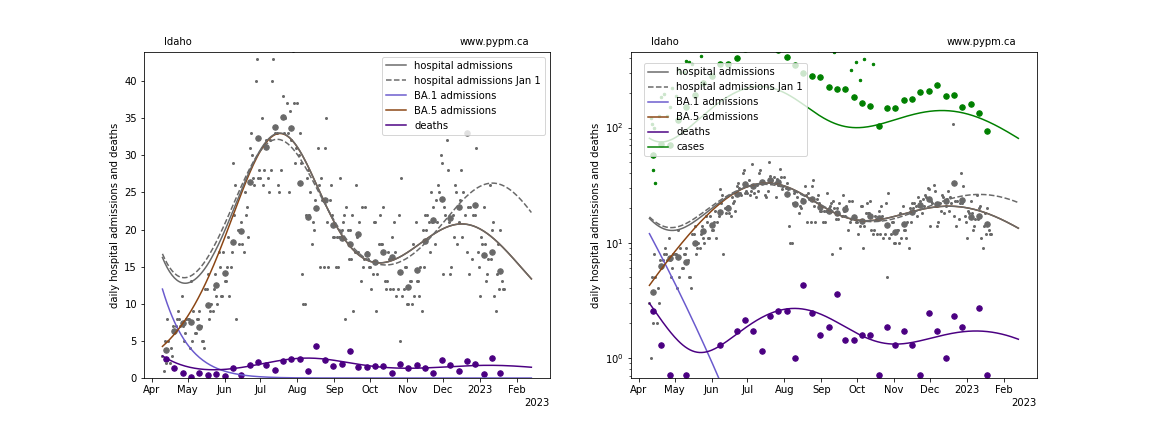
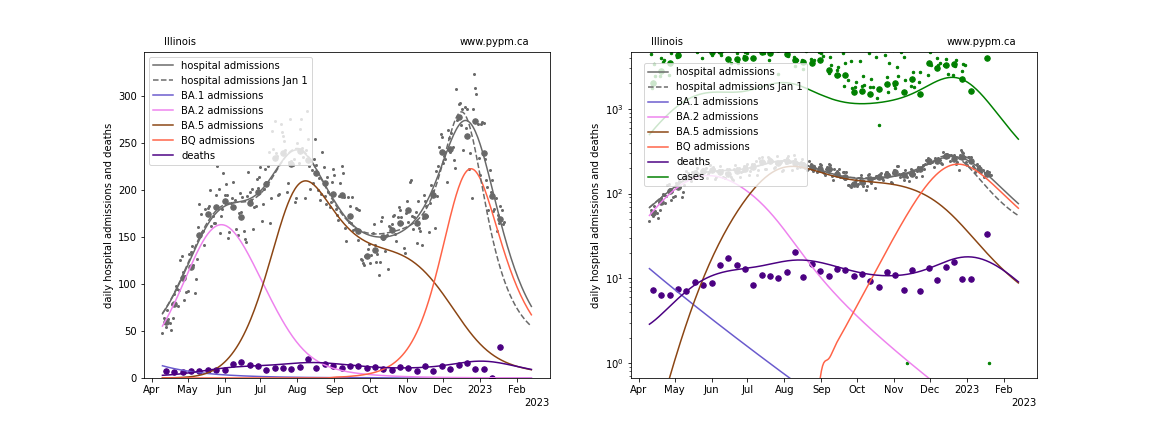
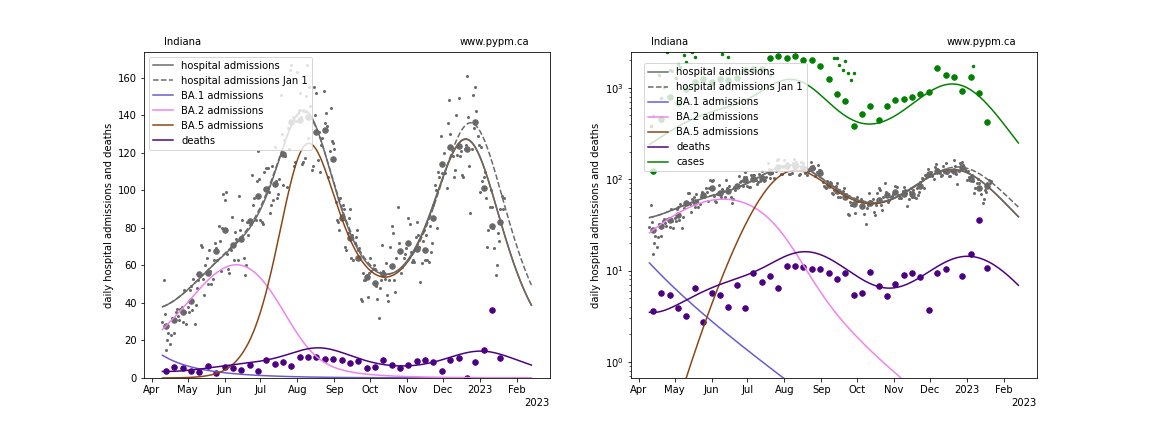
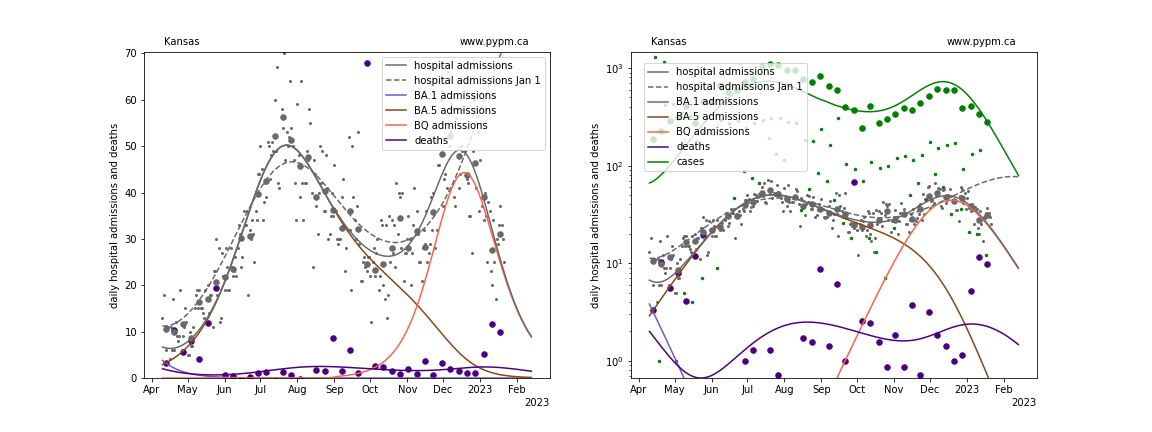
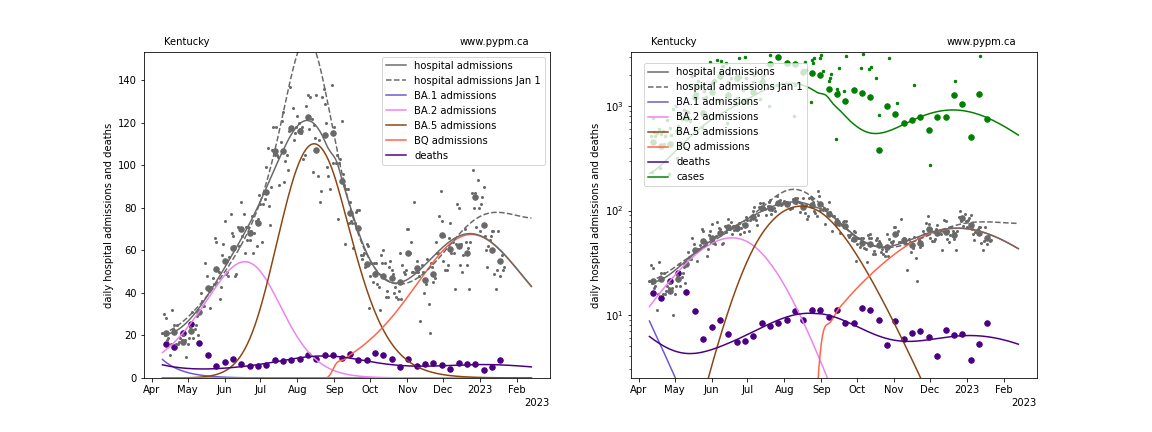
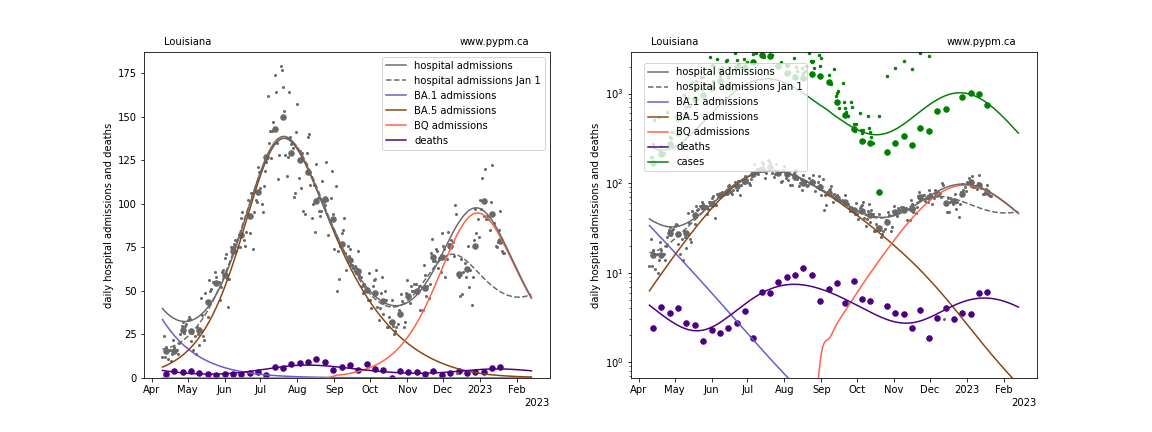
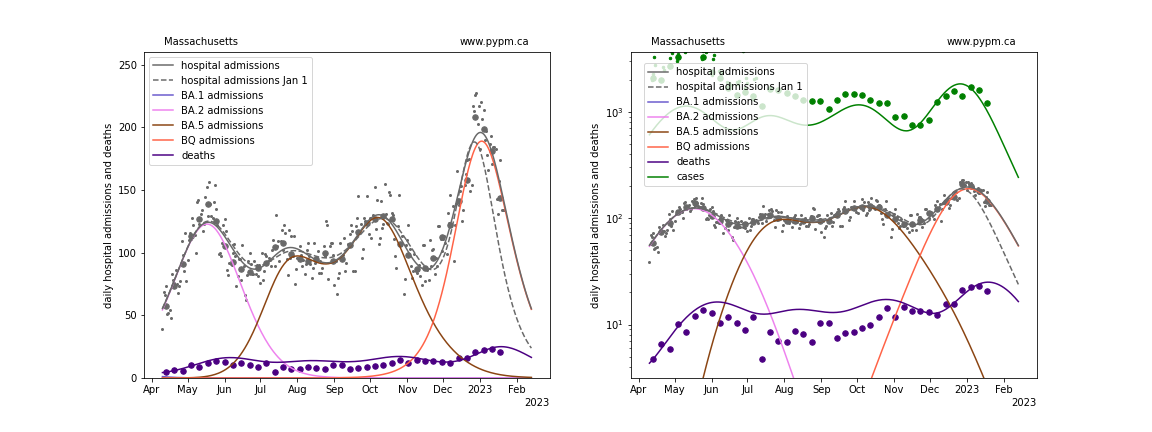
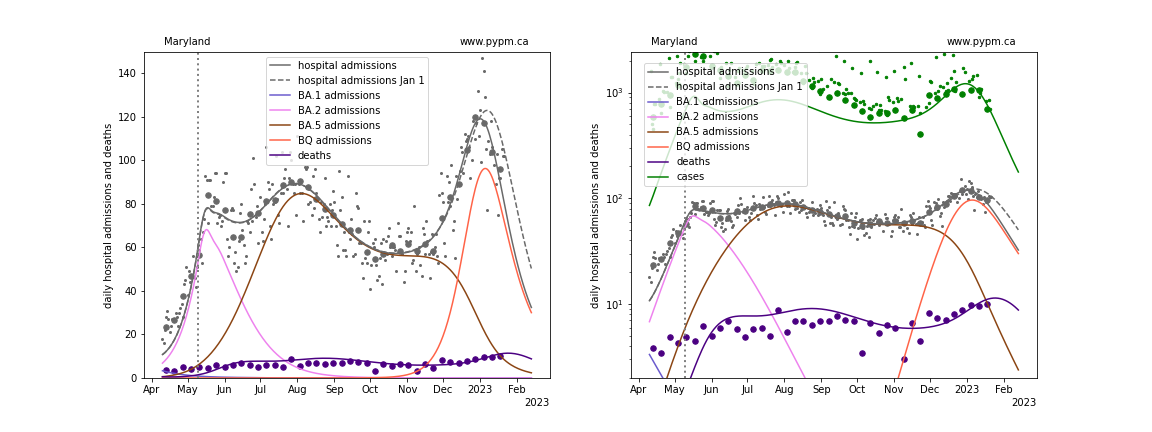
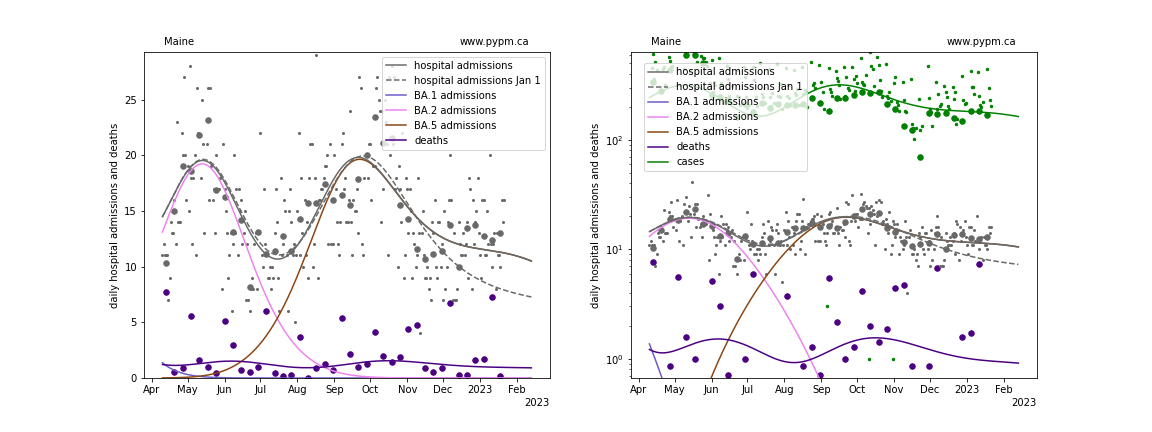
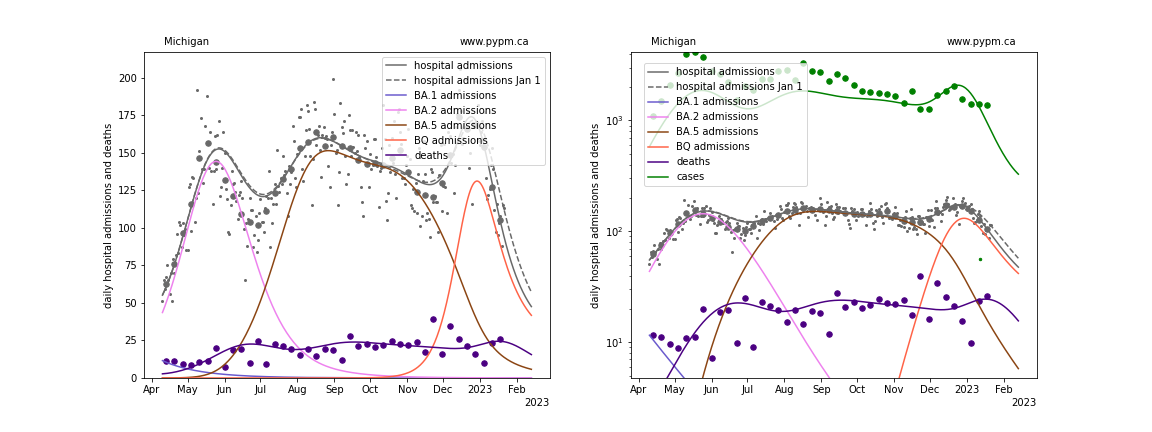
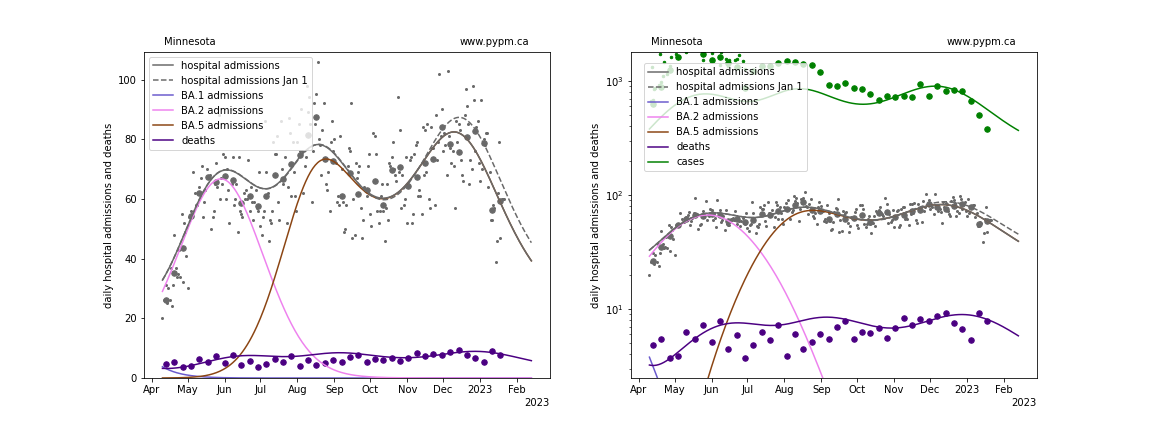
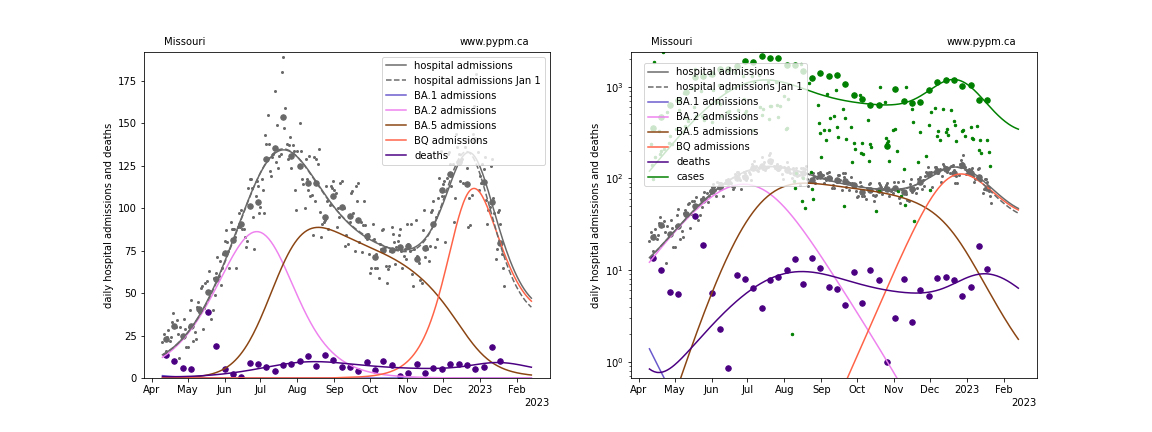
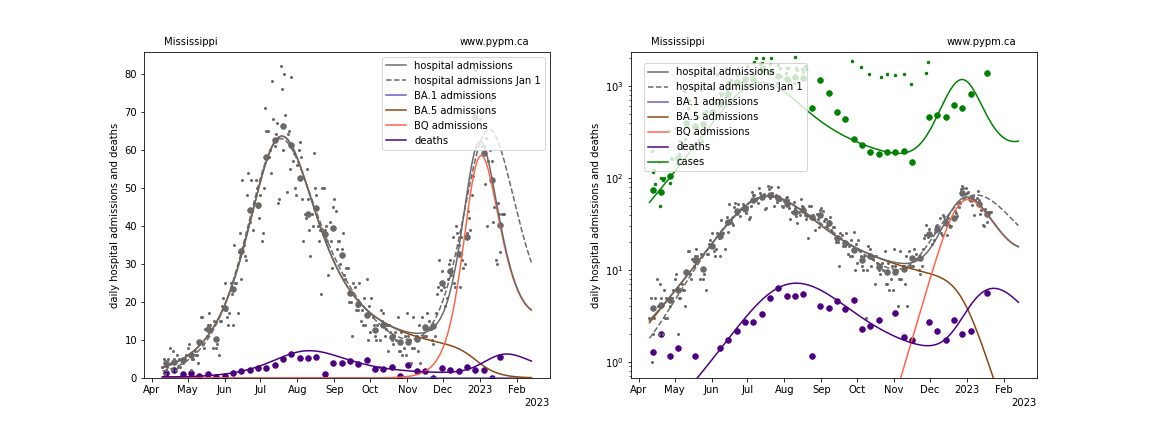
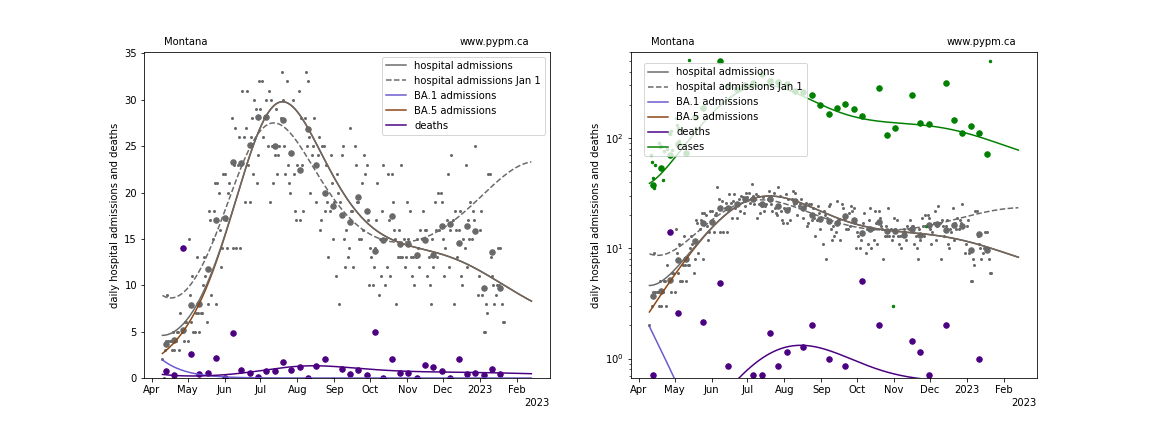
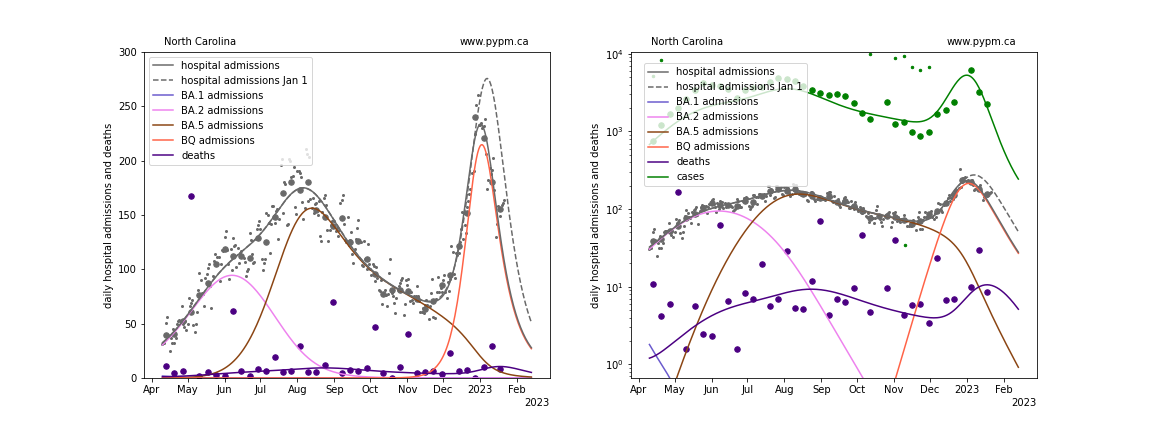
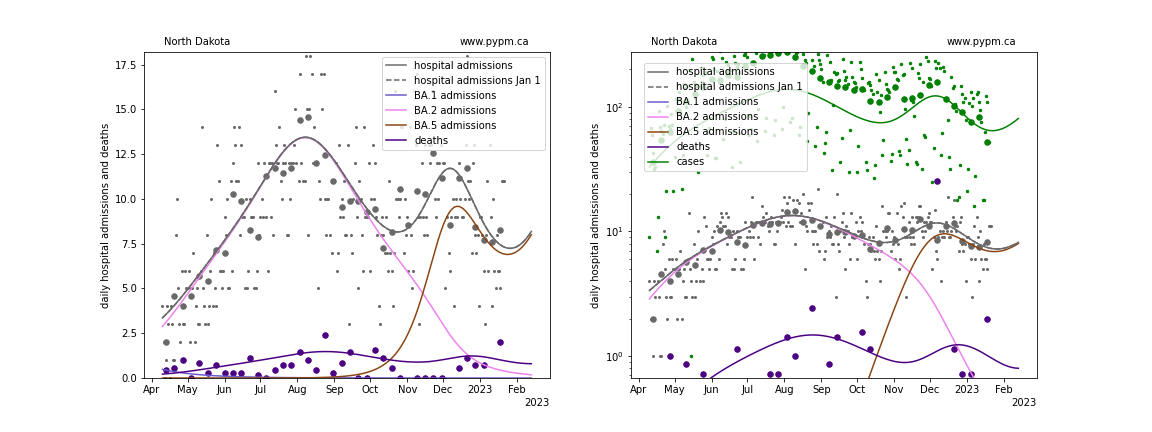
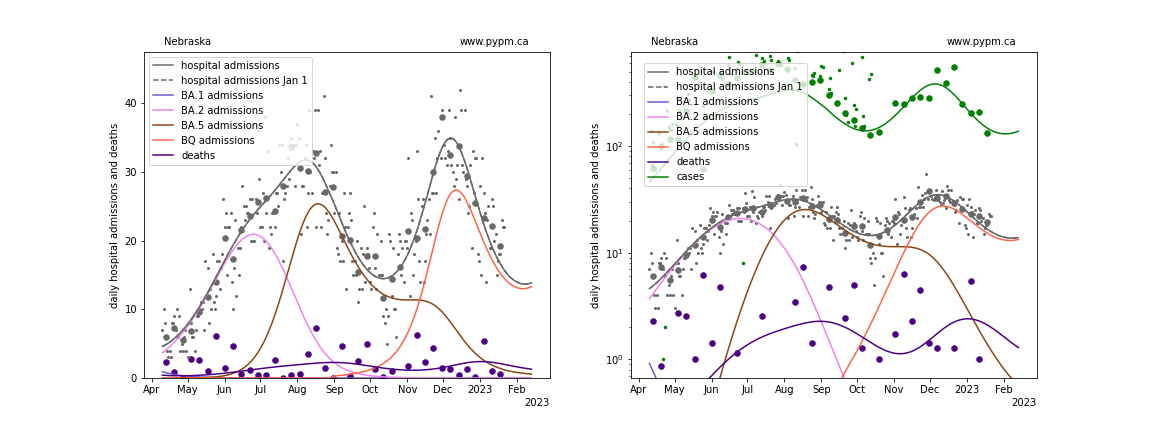
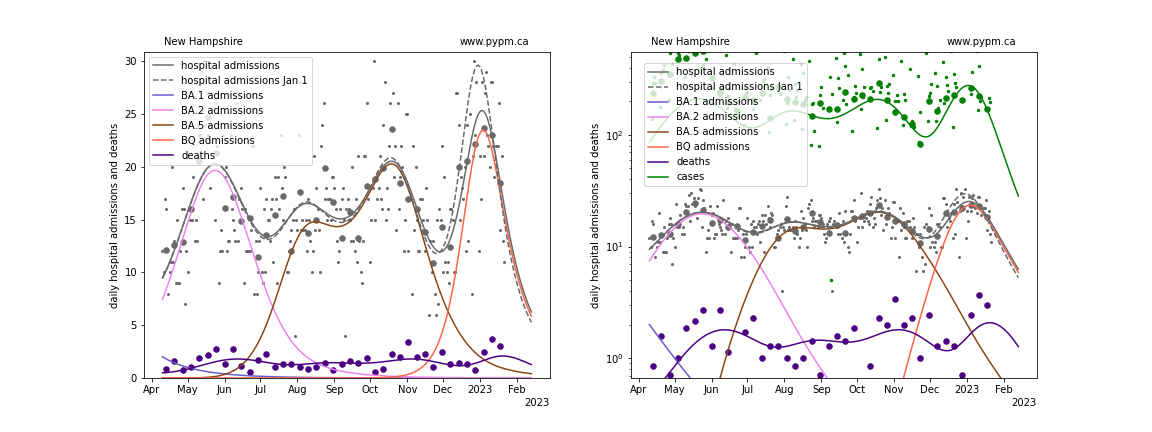
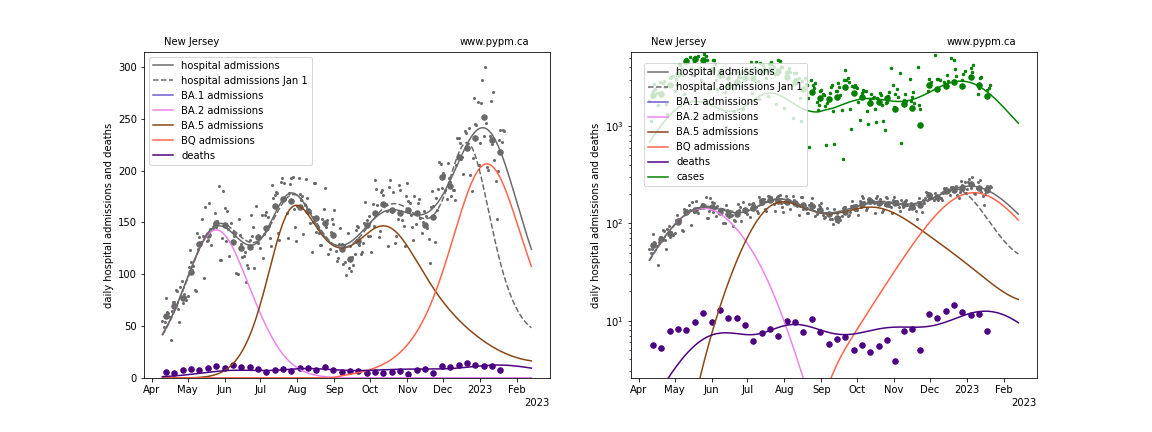
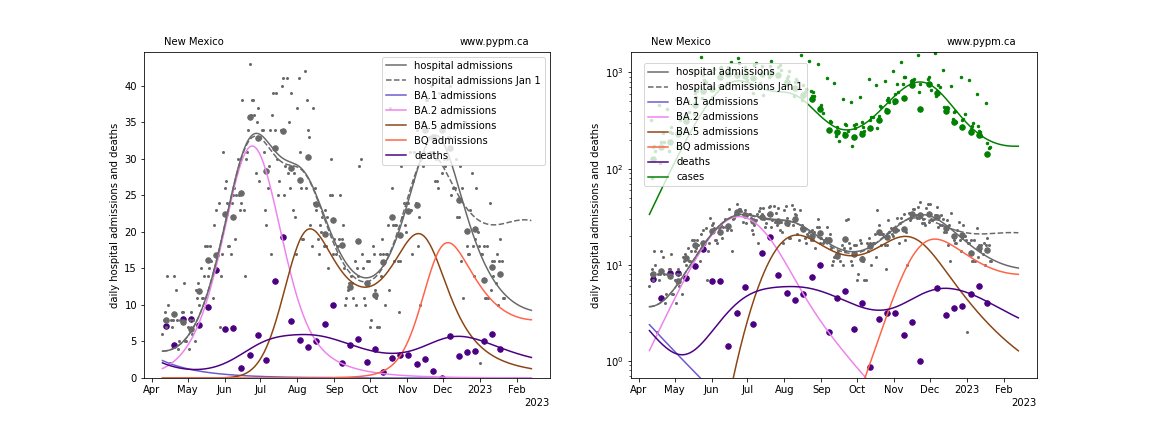
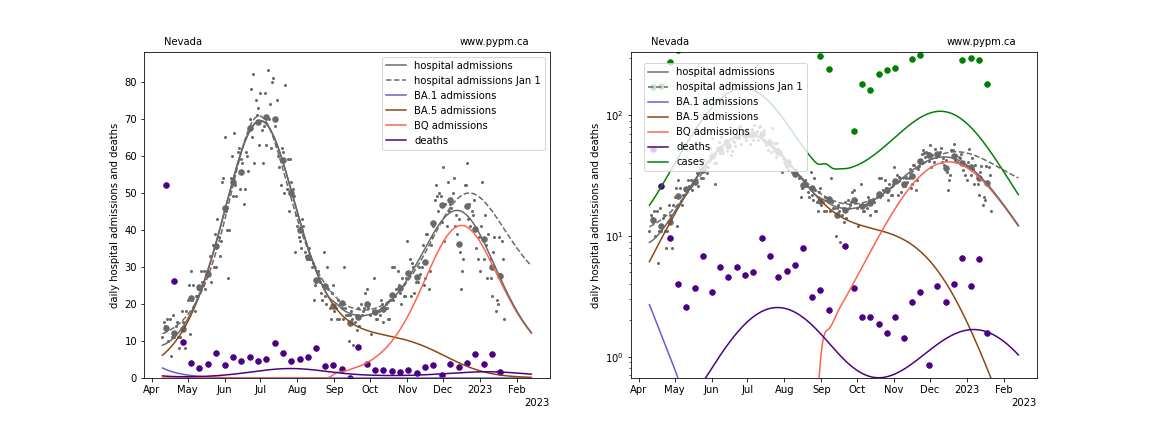
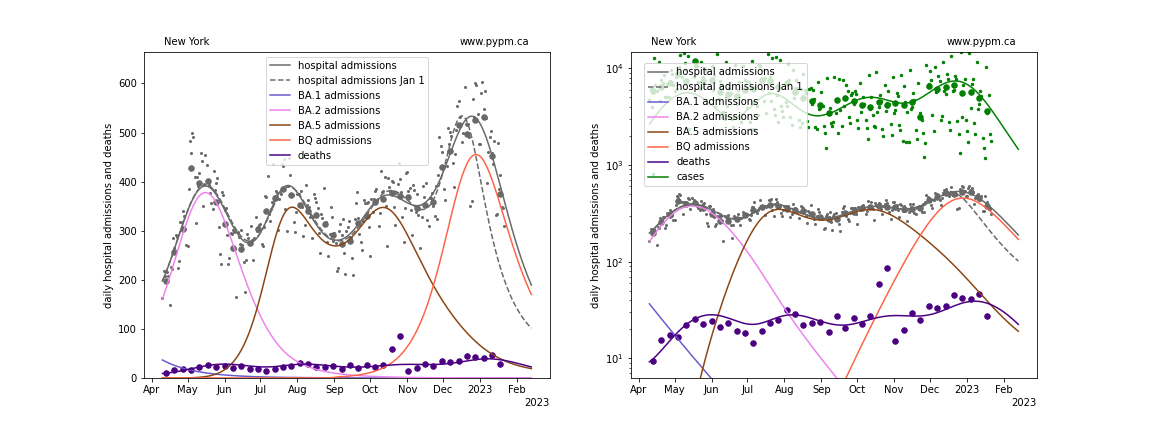
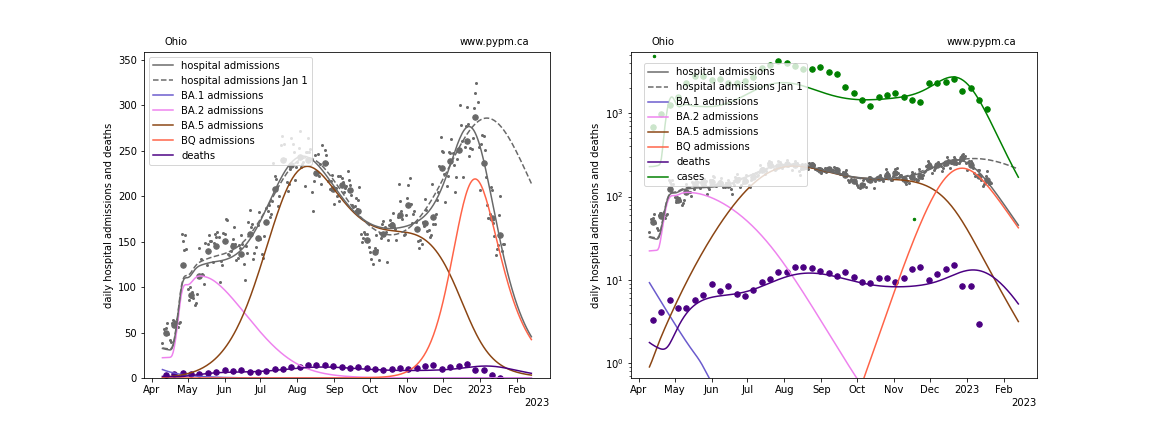
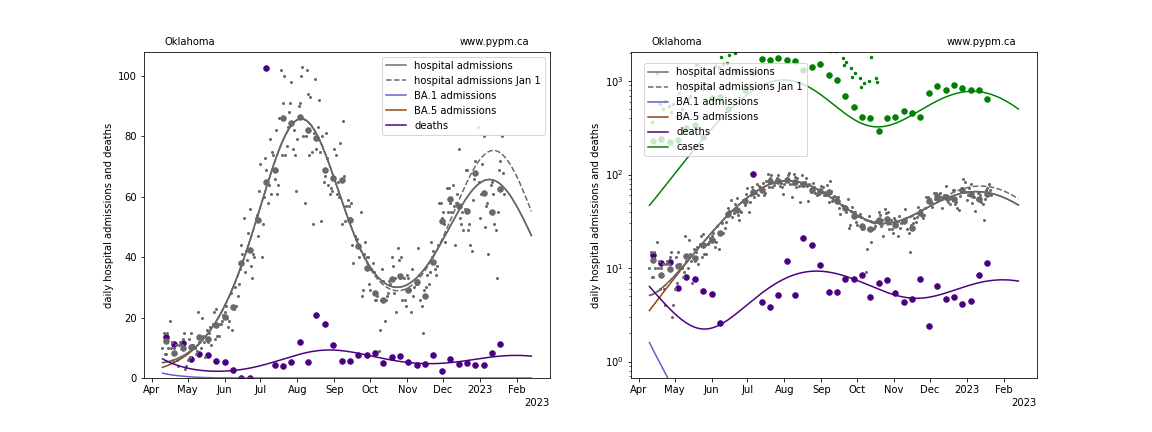
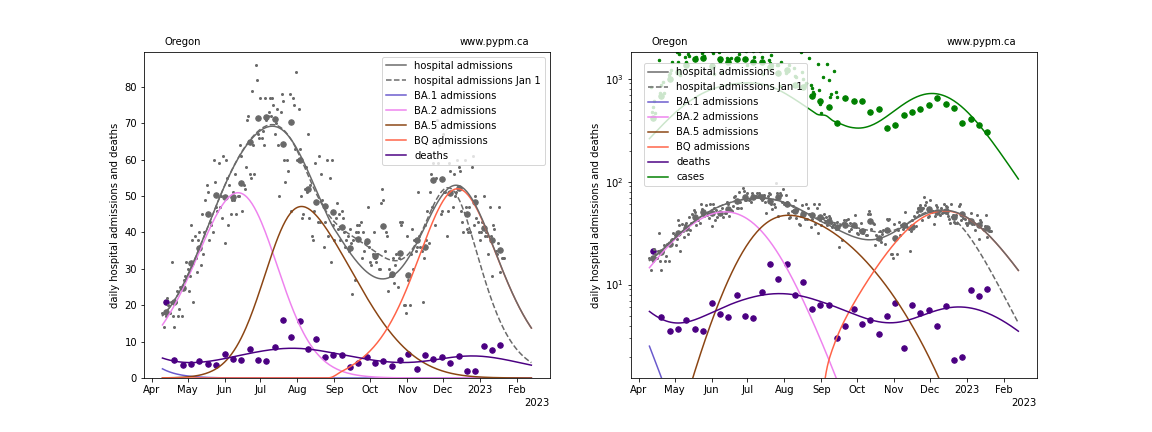
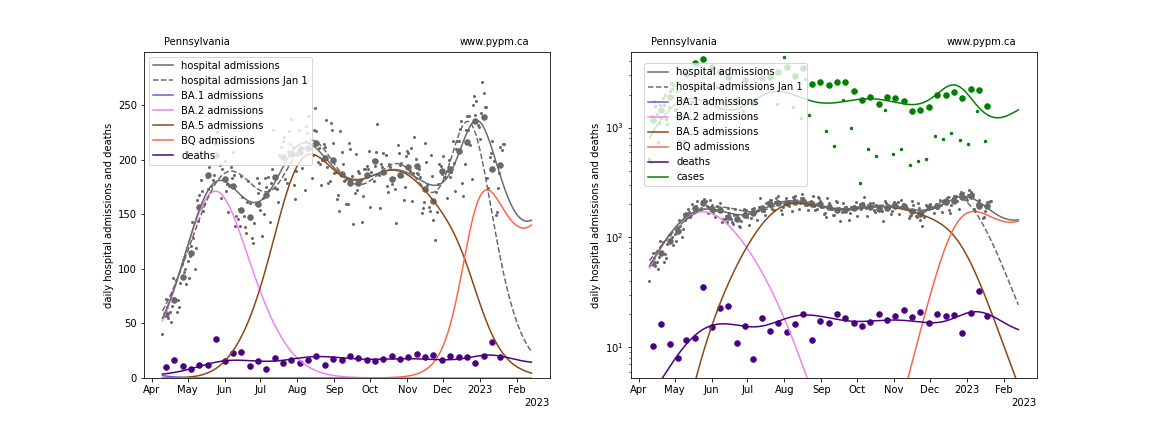
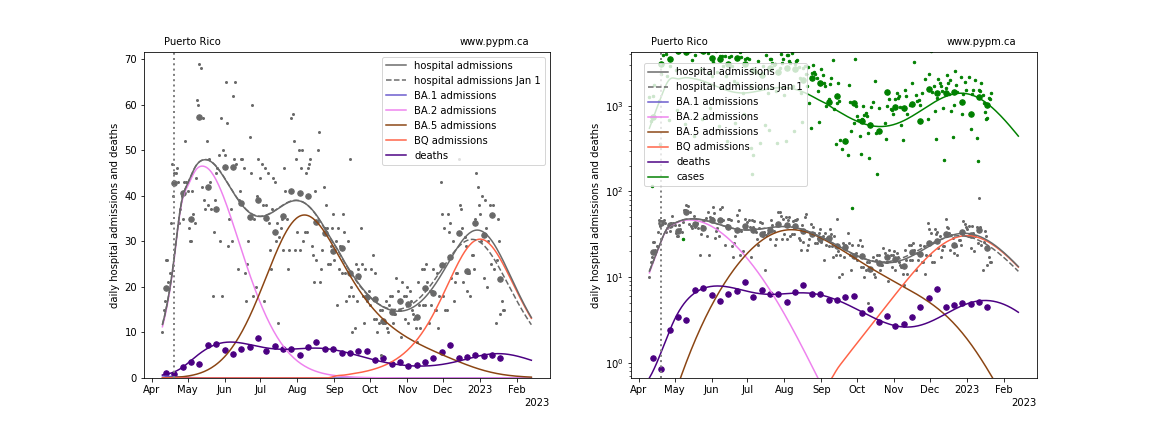
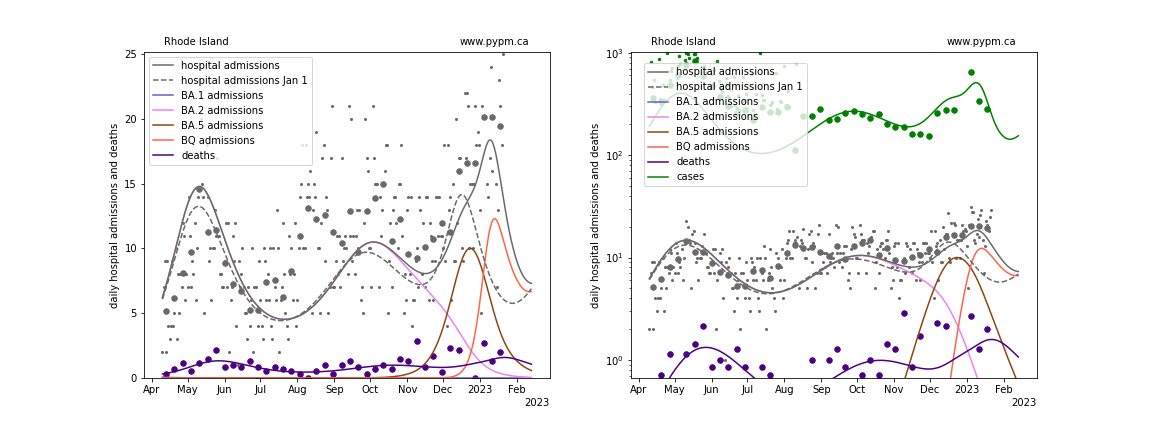
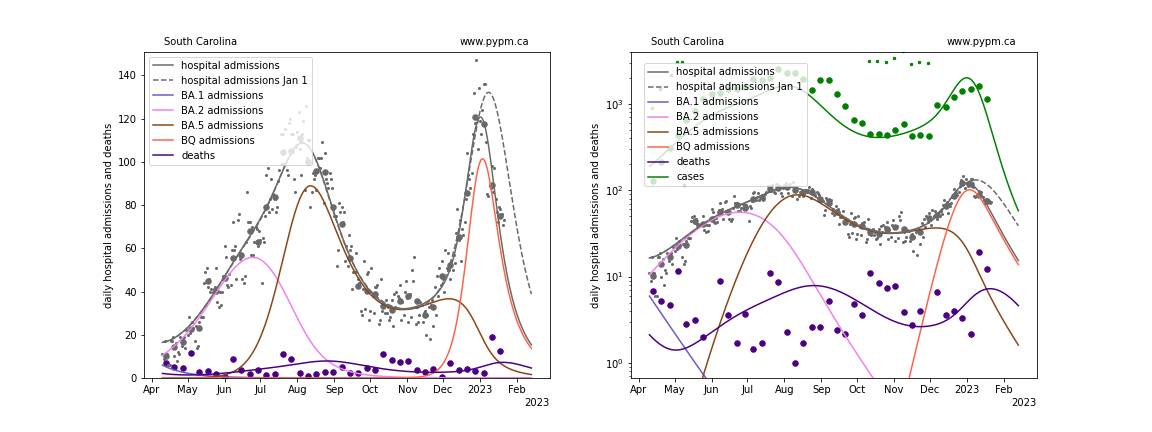
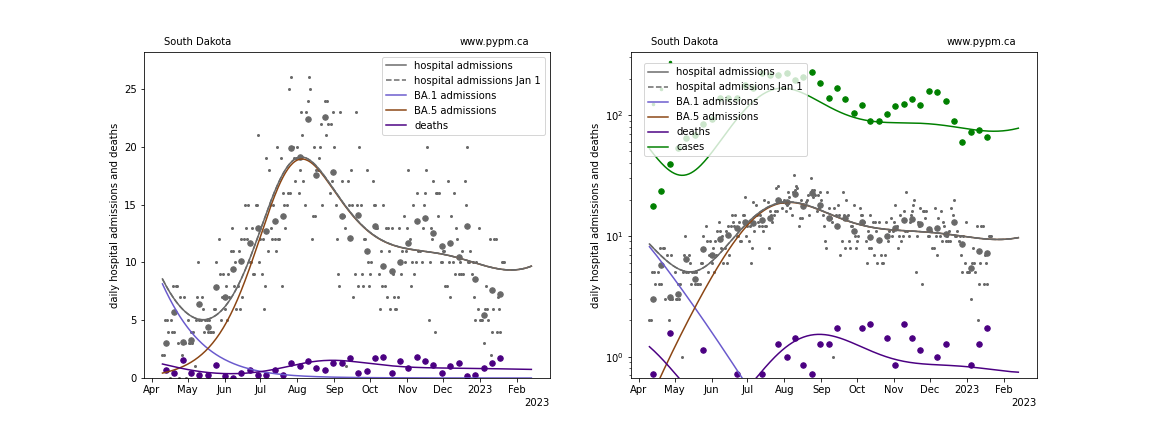
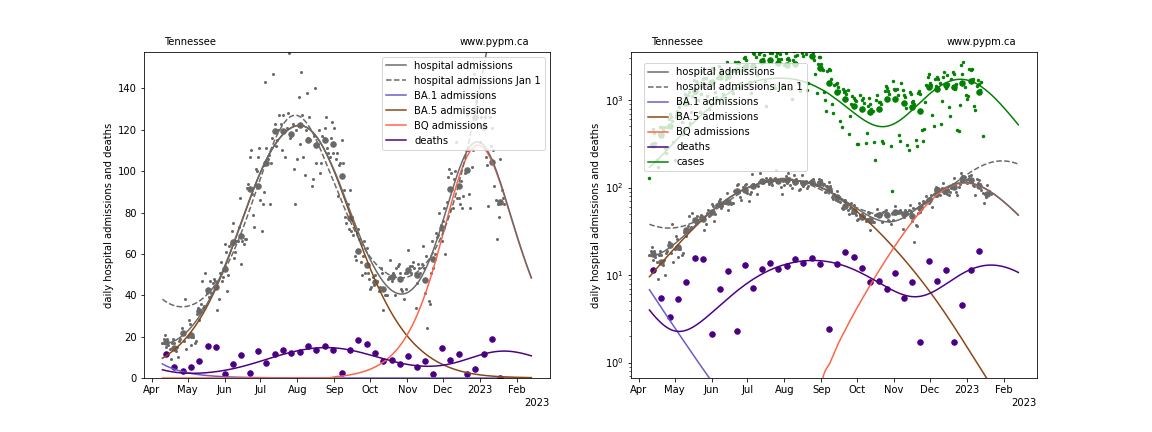
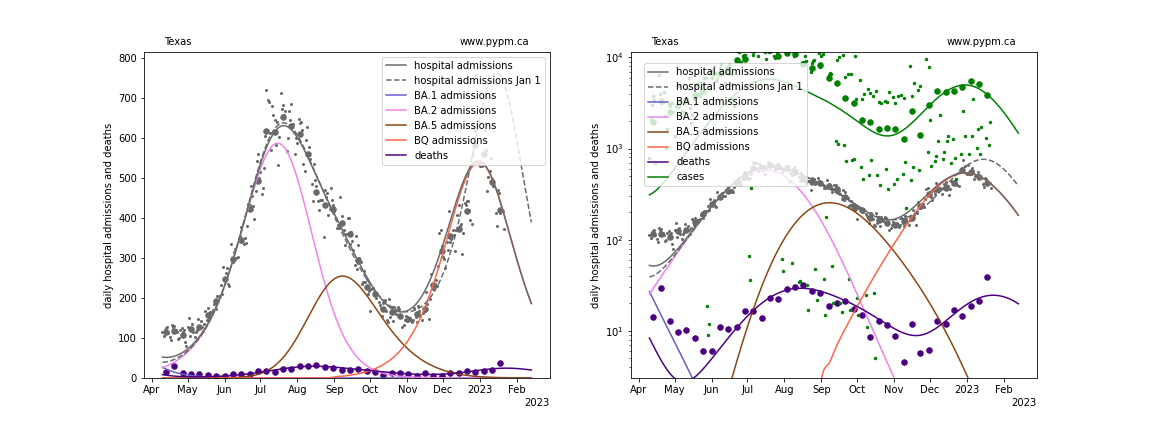
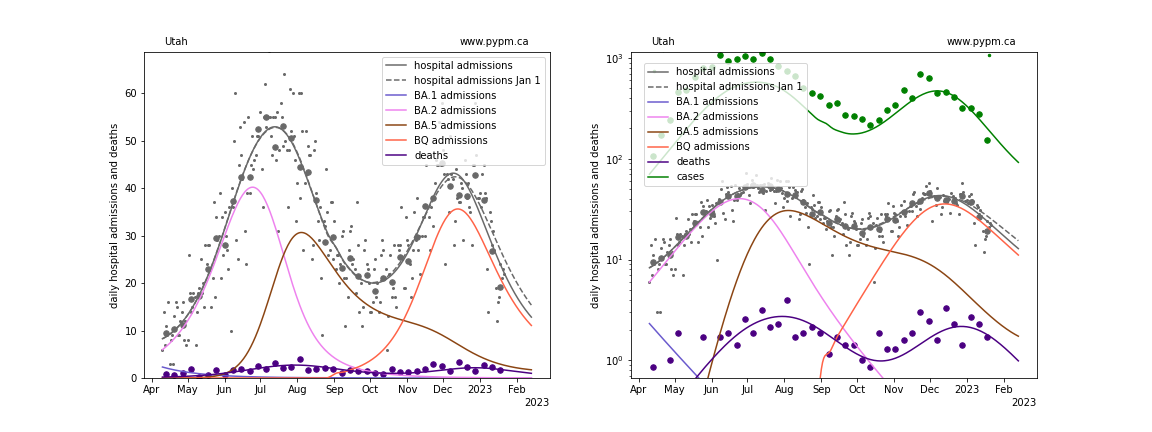
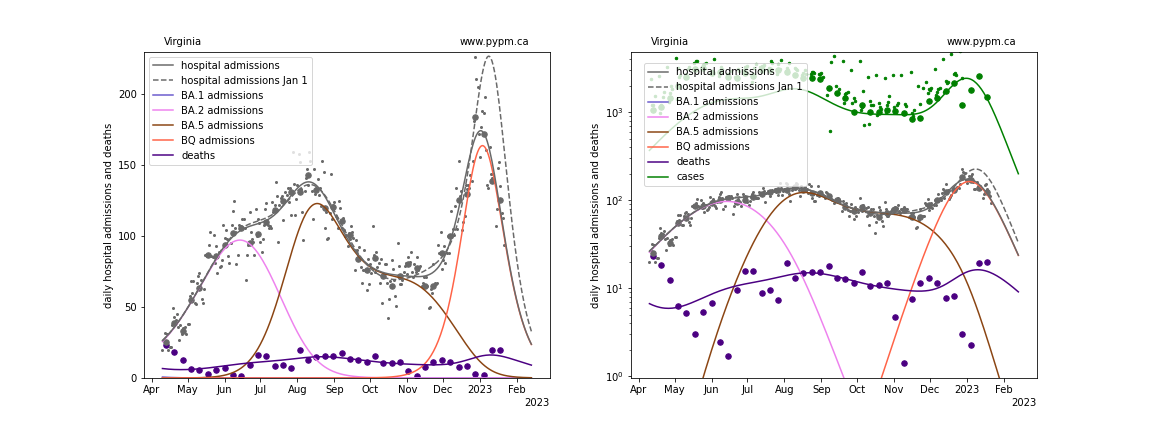
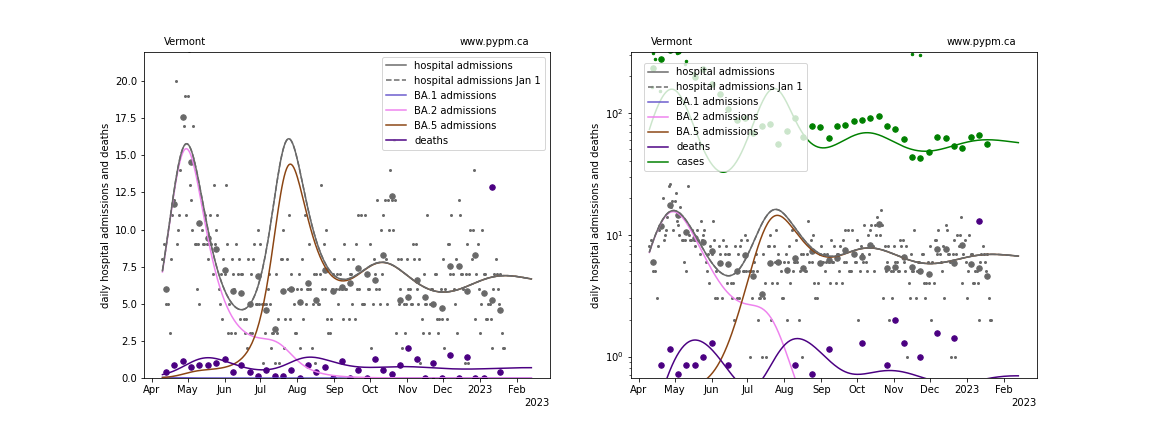
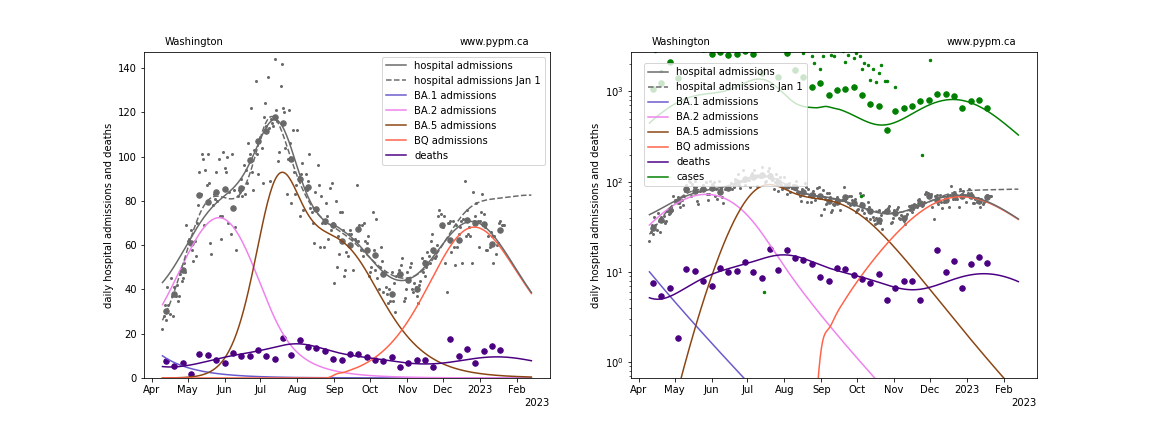
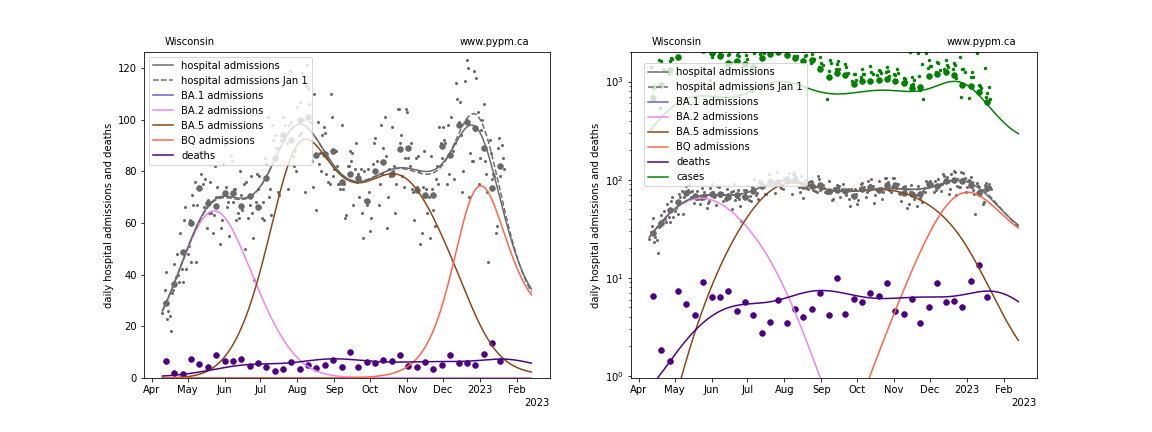
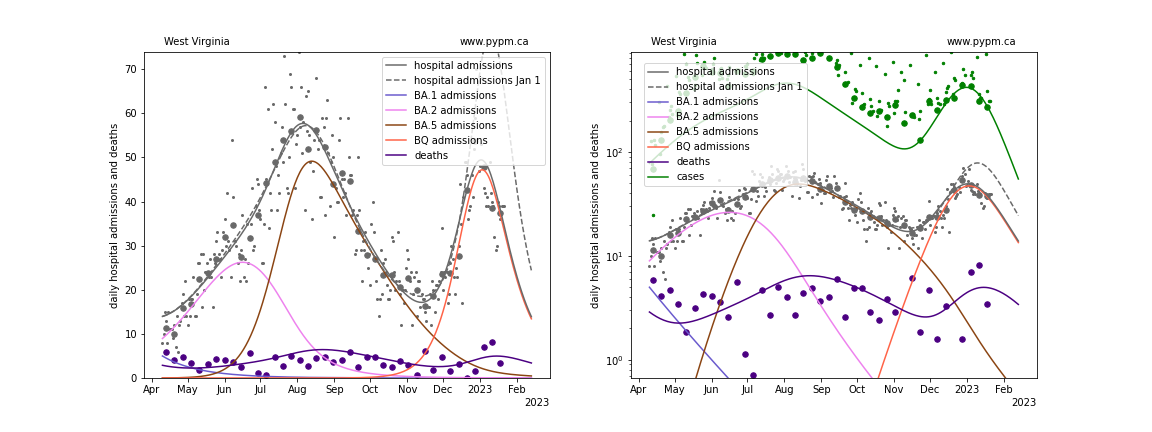
The plots for each state below show the daily hospital admissions and deaths since April on a linear scale (left) and log scale (right). Cases are also included on the right. BA.4 and BA.5 are combined into one strain, labelled BA.5. For some states, the combination of BA.2, BA.4 and BA.5 are combined in one strain, labelled BA.5. The most recent peak is ascribed to BQ.1, although in some states like New York, it is a combination of BQ.1 and XBB.
The rapid growth due to BQ.1 has peaked and hospital admission rates are now declining rapidly in most states. The figures below also show projections from a few weeks ago (January 1) to show that the change to rapid decline was expected, as a result of growing population immunity.
There is no indication yet of a return to growth, except perhaps in Colorado and Hawaii.
Alaska
Alabama
Arkansas
Arizona
California
Colorado
Connecticut
District Of Columbia
Delaware
Florida
Georgia
Hawaii
Iowa
Idaho
Illinois
Indiana
Kansas
Kentucky
Louisiana
Massachusetts
Maryland
Maine
Michigan
Minnesota
Missouri
Mississippi
Montana
North Carolina
North Dakota
Nebraska
New Hampshire
New Jersey
New Mexico
Nevada
New York
Ohio
Oklahoma
Oregon
Pennsylvania
Puerto Rico
Rhode Island
South Carolina
South Dakota
Tennessee
Texas
Utah
Virginia
Vermont
Washington
Wisconsin
West Virginia
Wyoming