July 17, 2022 Analysis of EU national data
Prior to 2022, the dynamics of COVIOD infections were primarily due to changing behaviour and, later, the emergence of new variants of concern. Dramatic turn-arounds in growth rates were generally attributed to to changes in health measures or personal behaviour. As a result, transitions from growth to decline could not be predicted in advance in general.
In 2022 the dynamics of infection rates are predominantly determined by emergence of new variants and the changing population immunity. Transitions from growth to decline can be predicted in advance in principle, since this can primarily be a result of growing population immunity.
There is a great deal of uncertainty in modelling population immunity from infection and vaccination histories:
- vaccine and natural immunity effectiveness
- waning of vaccine and natural immunity
- escape from vaccine and natural immunity by new variants
The analysis presented in this report uses a new approach to evaluate population immunity and forecast the growth of the current variant of concern, Omicron BA.5.
Evaluating population immunity from the BA.2 wave
Hospital admission data are used for these analyses and it is assumed that the a constant fraction of COVID infections lead to hospitalization in 2022. Furthermore, personal behaviour is assumed to be constant throughout.
For the six nations studied in this report, the BA.2 wave is distinct from the BA.1 and BA.4/5 waves. These three waves are modelled by separate strains.
The model starts with a fully susceptible population in late 2021 with the emergence of BA.1. There is no attempt to fit the full BA.1 wave. Instead, the magnitude of the BA.1 wave is effectively set by requiring that the BA.2 wave is reproduced by a new variant which has no escape from BA.1 natural infections. In other words, the modelled BA.1 wave defines the population immunity early in 2022.
Vaccinations are not explicitly included, to keep the model as simple as possible. They are implicitly included in that the modelled BA.1 wave captures the full population immunity.
The model fits estimates the following parameters in fitting the BA.2 wave:
- BA.1 outbreak and growth rate (magnitude of infections prior to BA.2)
- fraction of hospitalizations leading to hospitalization
- BA.2 outbreak timing and initial growth rate
The advantage of BA.4/5 is assumed to arise from two factors, a different transmission rate, and partial escape from previous BA.1 and BA.2 infections.
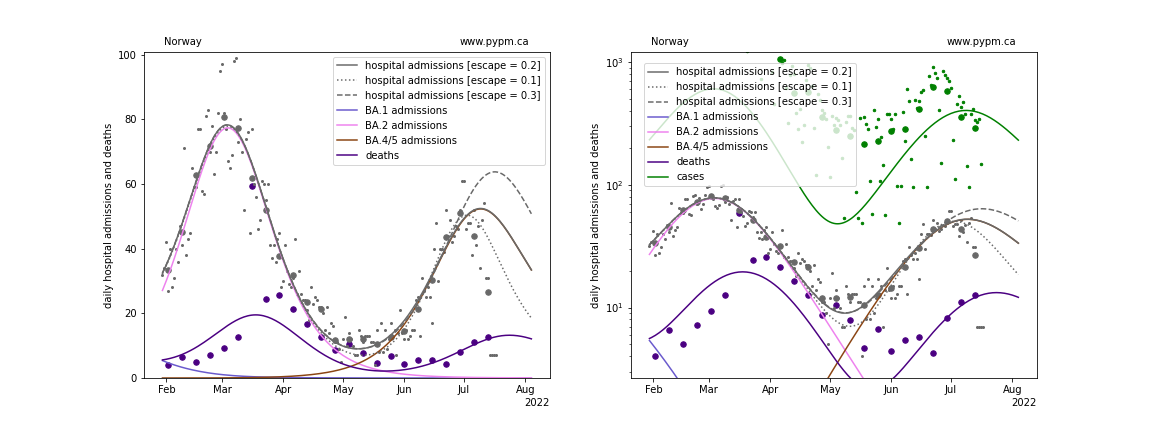
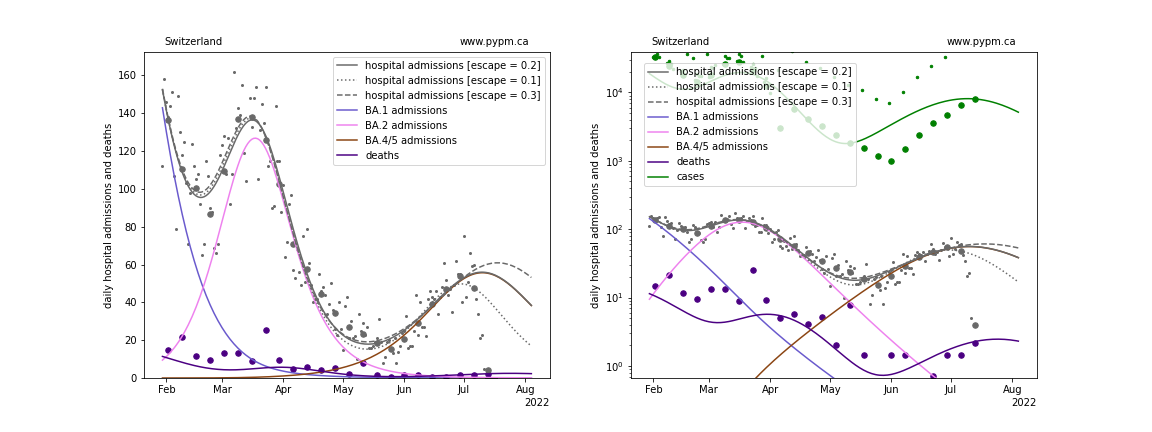
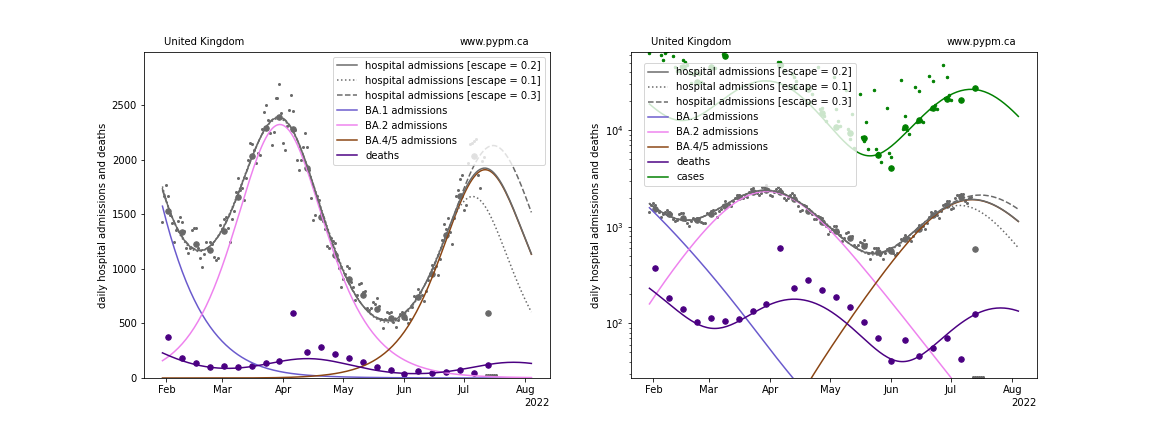
Natural immunity escape for BA.4/5 is unknown. For this study, it is assumed that the probability for individuals to become susceptible to BA.4/5 is 20% (+/- 10%). This is implemented by introducing a new susceptible population specifically for BA.4/5, that contains 20% of the population infected by BA.1 or BA.2. At that level of immunity escape, the transmission rate is similar for BA.4/5 as for BA.2.
The simple model fits the hospital admission data well, having 7 adjustable parameters. When the natural escape fraction is increased to 30% (decreased to 10%), the turnover data is later (earlier) and magnitude of the peak is higher (lower), as expected. One turnovers are established in data, the natural escape fraction can be included in the set of adjustable parameters.
If this approach is to have value in predicting future turnover in growth rates, the natural escape fraction for different populations will be seen to take on similar values, since natural escape should be a property of the virus, not the population.
Model fits to data
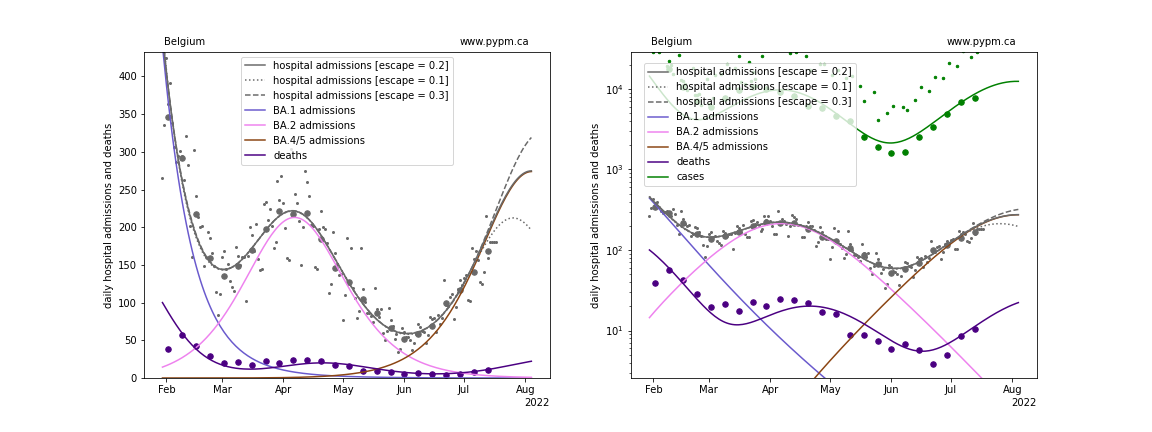
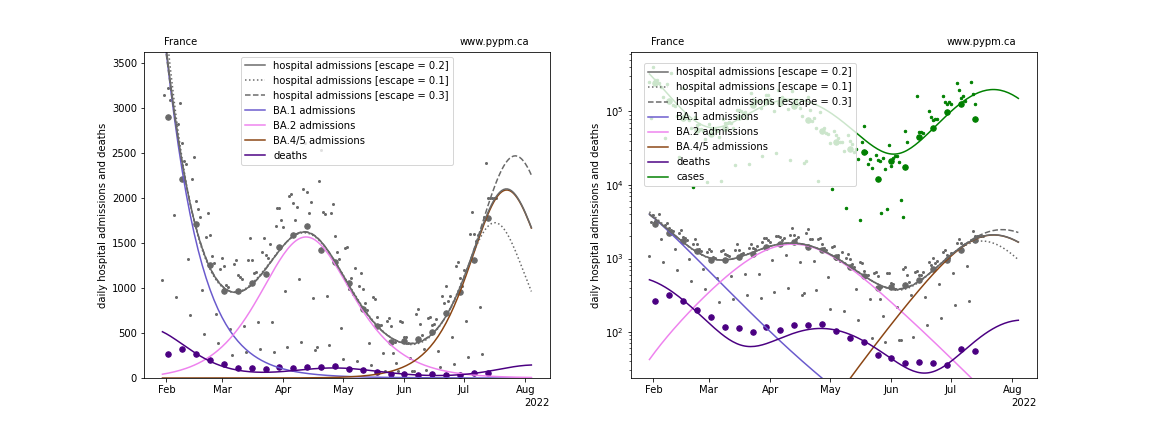
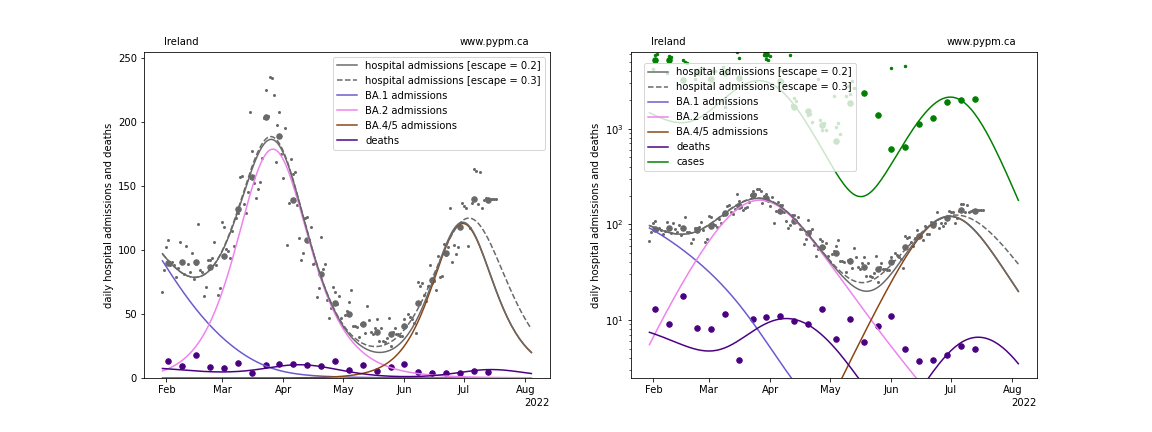
The figures below show the fit of the simple model to six nations.
Belgium
France
Ireland
Norway
Switzerland
United Kingdom
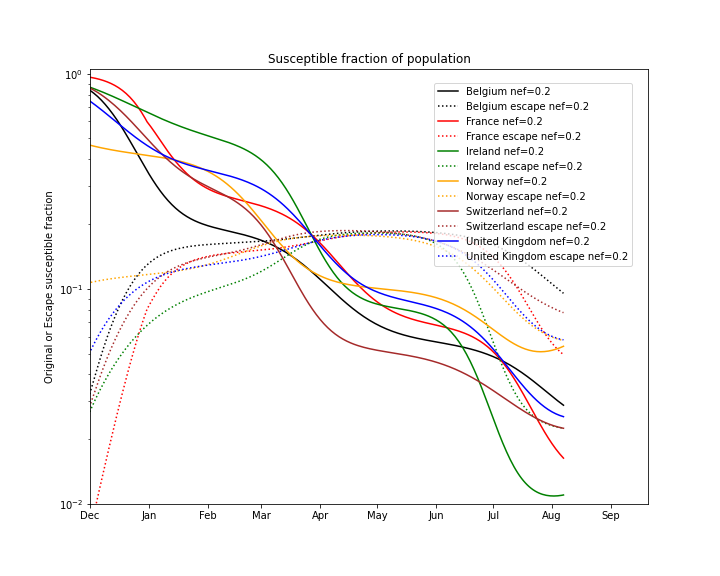
Comparing the evolution of the susceptible fractions
The following plot shows how the susceptible fraction of the populations change with increasing infections on a log scale. Those who are infected are removed from the “original” susceptible population shown by the solid lines. Of those, 20% are added to the “escape” susceptible population (susceptible only to BA.4/5 infections) shown by the dotted lines.
The decline in susceptible fraction is set by the fit to the BA.2 wave.
When the escape susceptible population is larger than the original susceptible population, most of the new infections come from reinfections.