September 4, 2022 Analysis of US state data
This report shows the result of analyses that use hospital admission data to estimate the transmission rates in the past few months to characterize the recent Omicron waves. Hospital admission data are used, to avoid testing capacity issues and to better predict future hospital admission rates.
The modelling approach for US states has now changed to follow the approach first applied in July for European nations. See this link for more information.
The European nations in the study were chosen for the distinct BA.2 wave which allowed critical aspects of population-level immunity to be measured from the data:
- the population-level immunity at the start of the BA.2 wave
- the rate at which immunity grew with every hospital admission
Few US states had a distinct BA.2 wave, and so the identical approach cannot be applied. Instead, information from the previous models (that included the entire time history) was transferred to the new models that contain now history prior to 2022, and mimic the initial population immunity as arising from natural infections occuring near the beginning of 2022. Since the turnover of waves results from the growth in immunity from infections, the rate to which immunity grows is effectively measured by fit of the model parameters to the data, assuming constant transmission rates.
As seen in the recent European analyses, immunity waning appears to be a significant effect, and the same waning parameters are fit in the US data. Given the lack of the well established BA.2 wave to calibrate immunity, the waning parameter estimates may not be directly comparable to those from Europe.
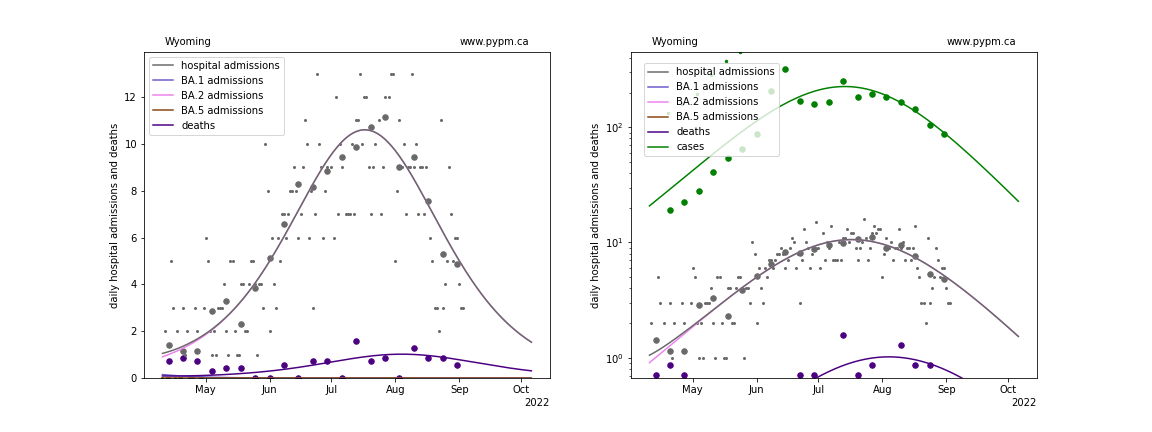
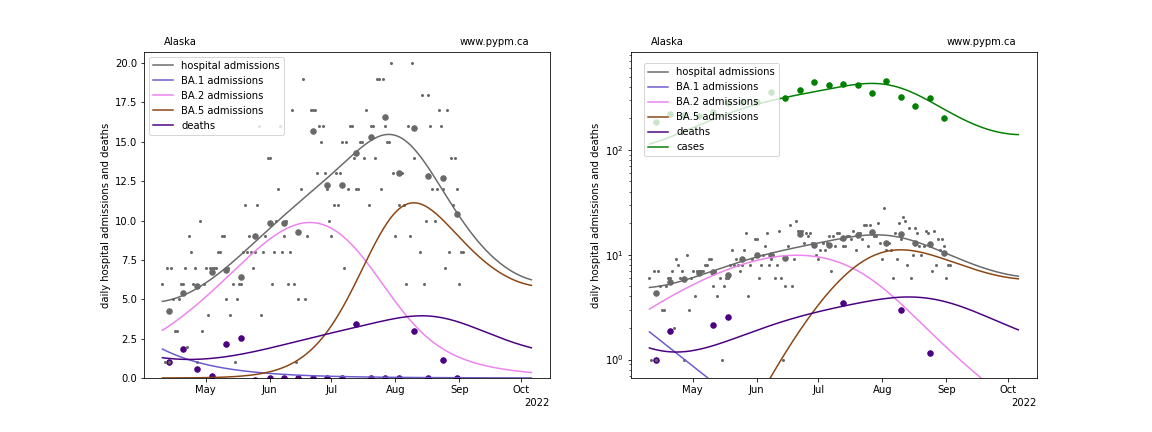
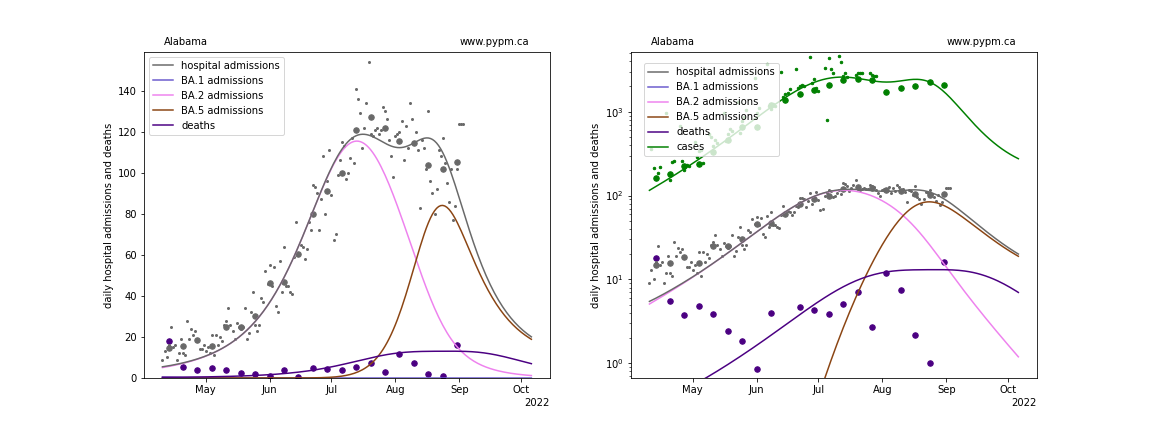
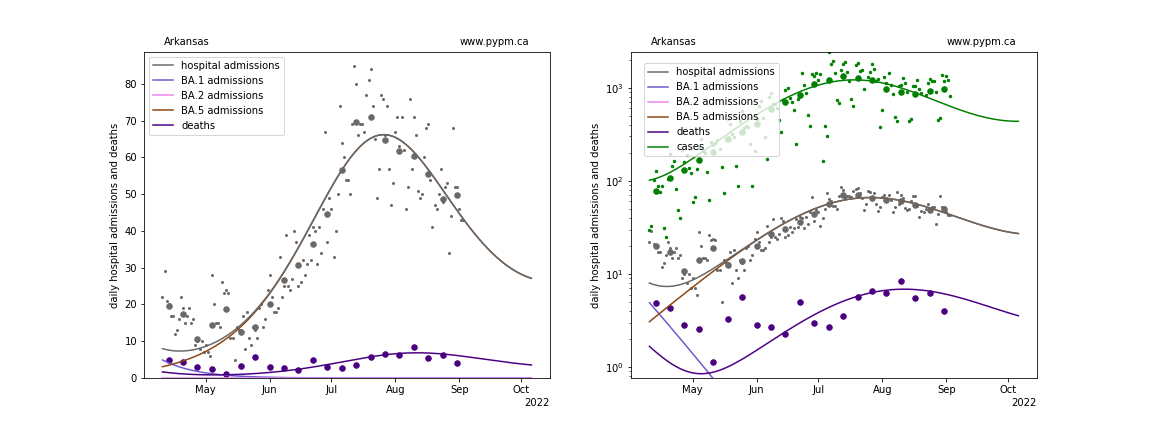
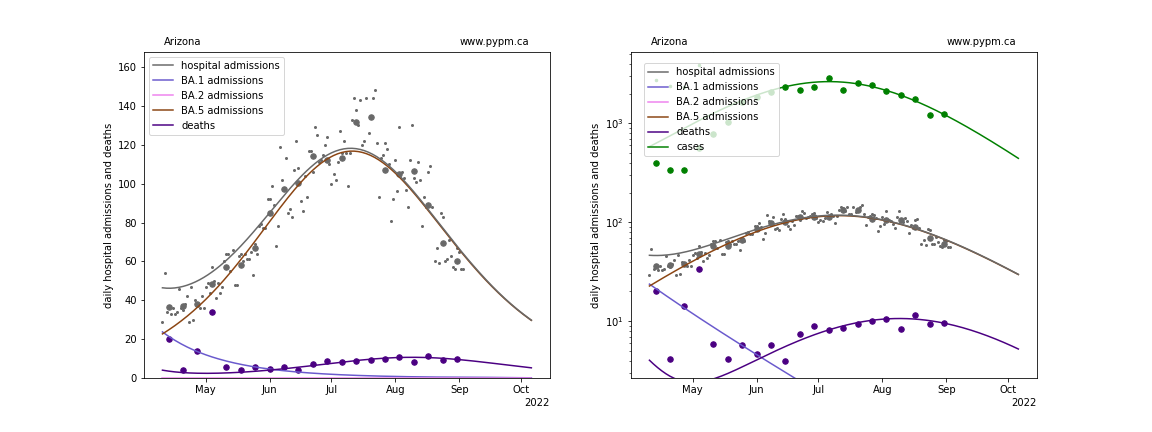
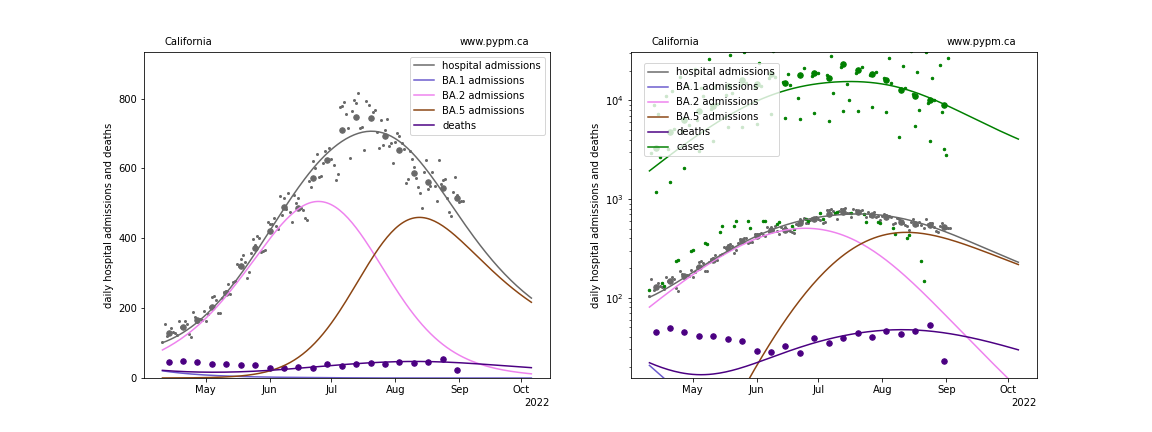
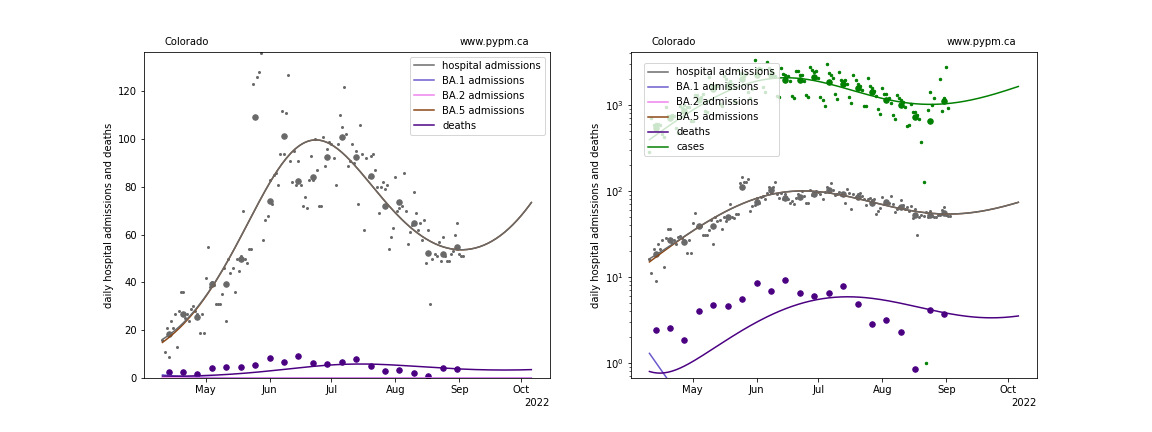
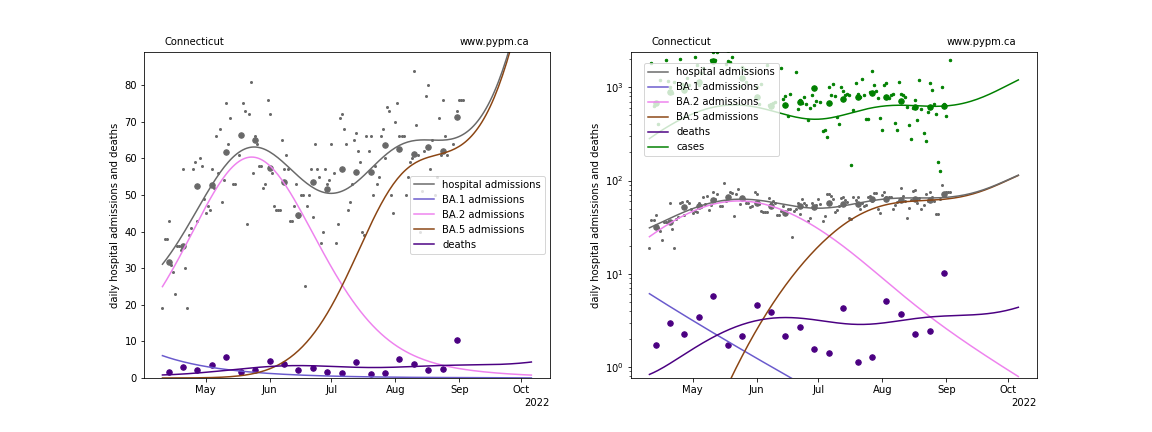
In the figures below, the small dots show daily values, and the larger circles are weekly averages to help guide the eye. There are no changes to transmission rates (normally shown by dashed vertical lines) within the time periods shown below. Each strain has just 2 parameters (transmission rate and timing).
Individual state hospitalization analyses
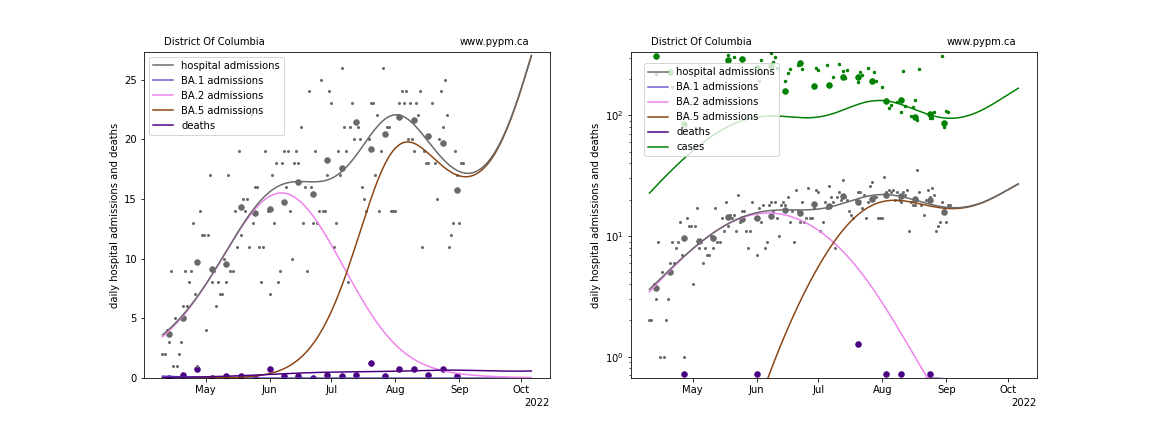
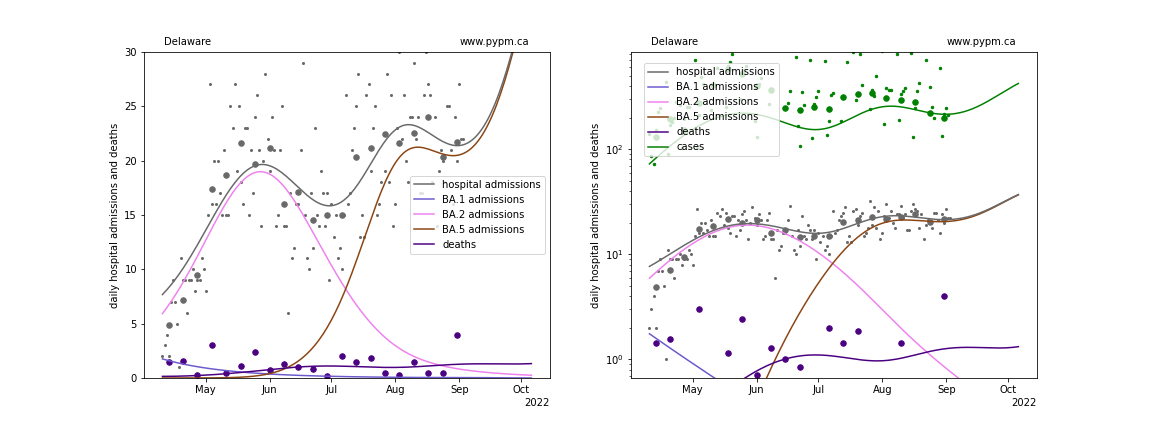
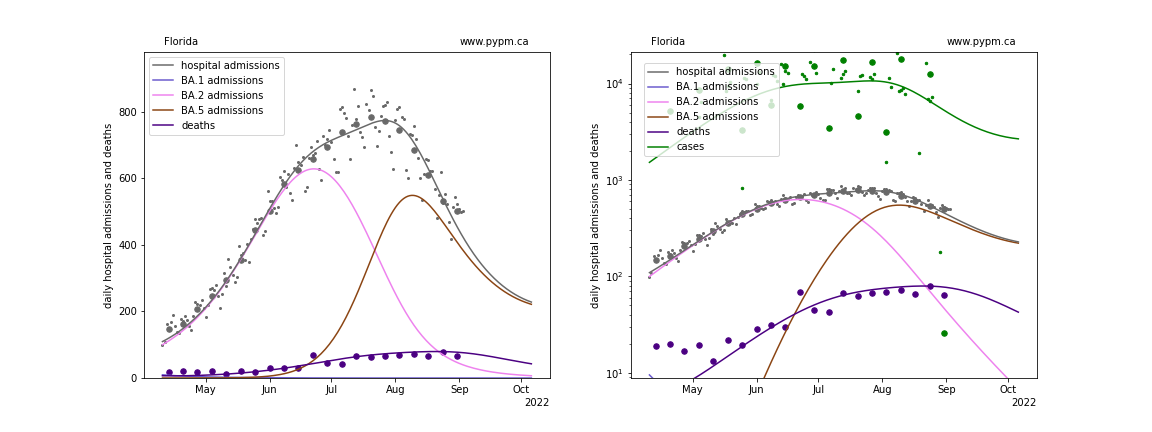
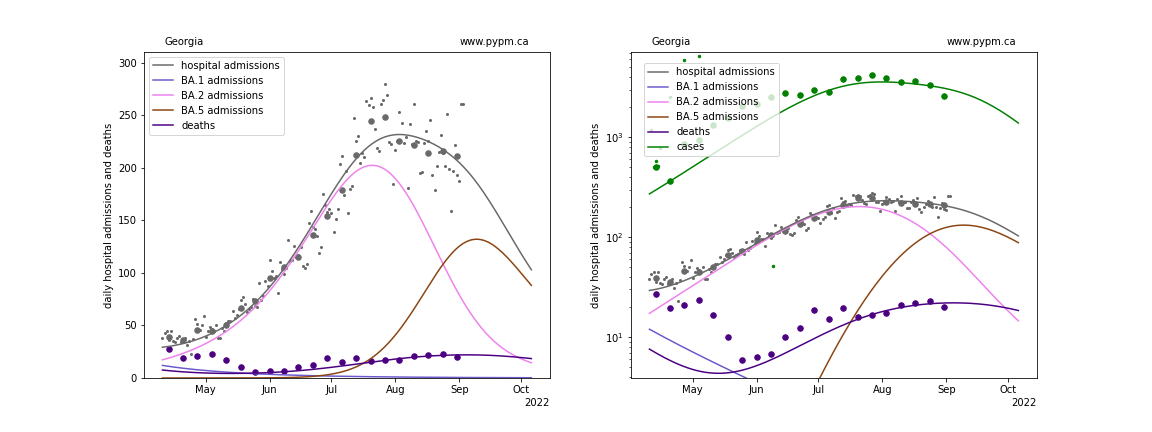
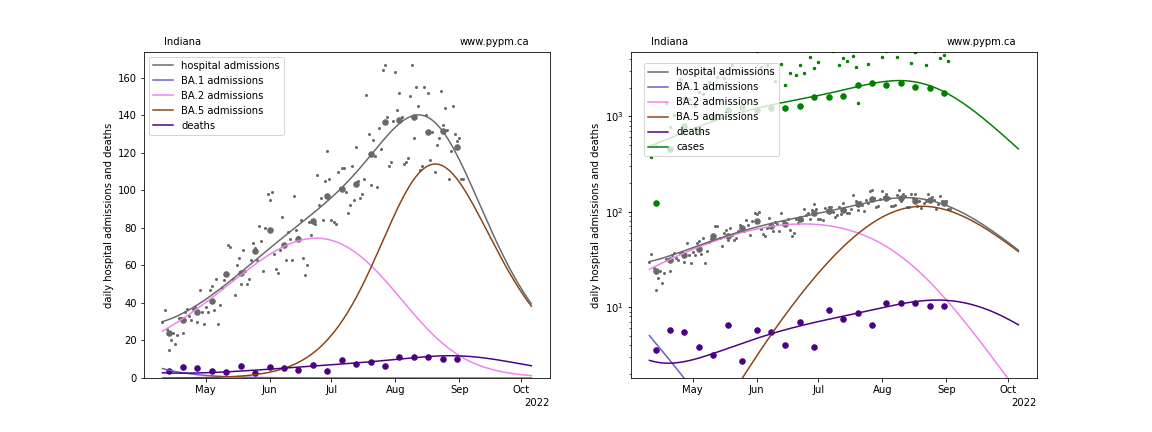
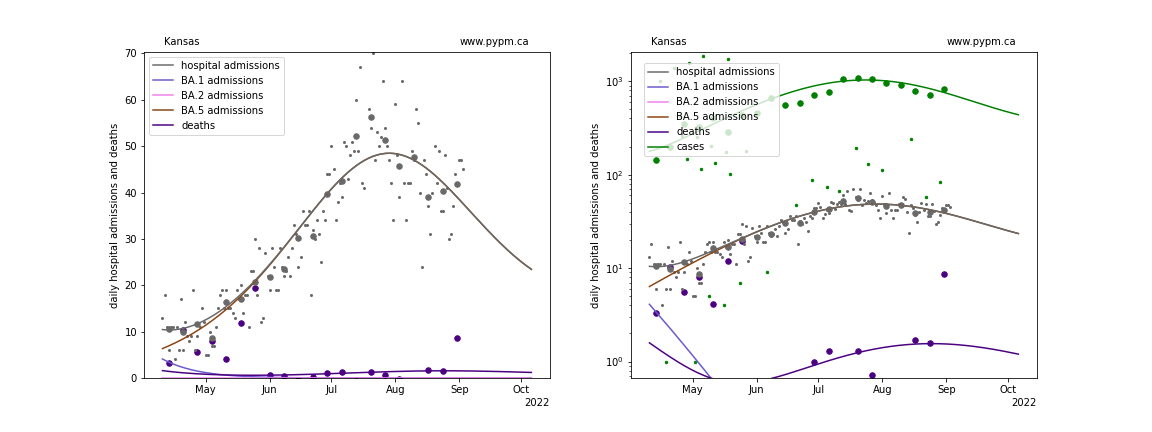
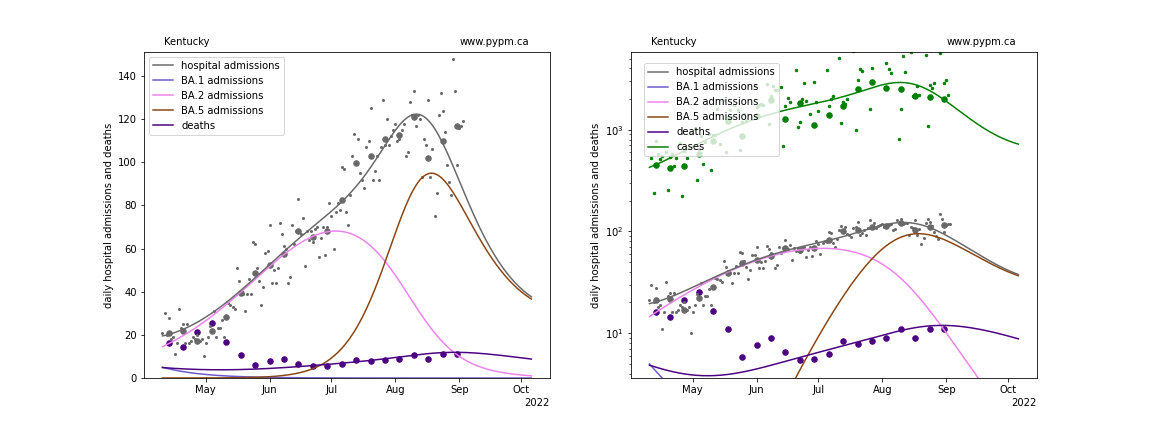
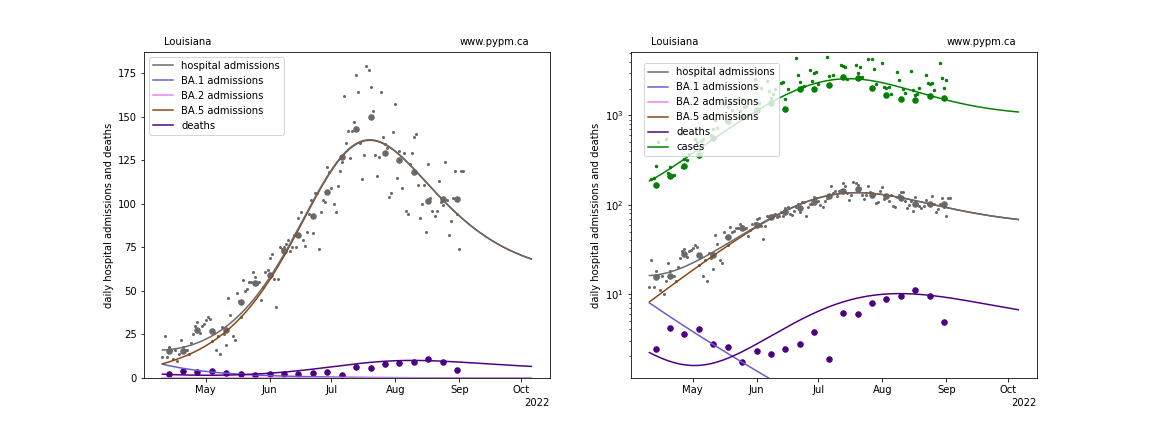
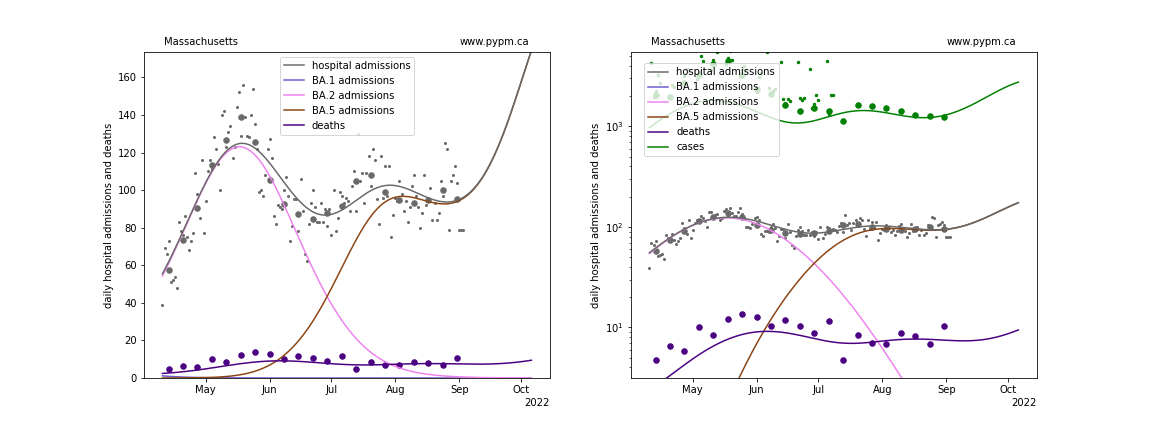
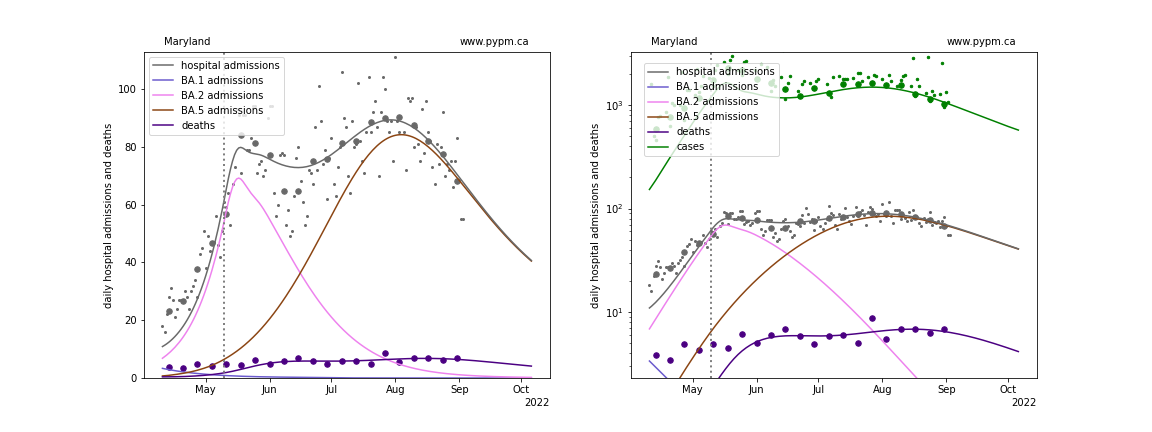
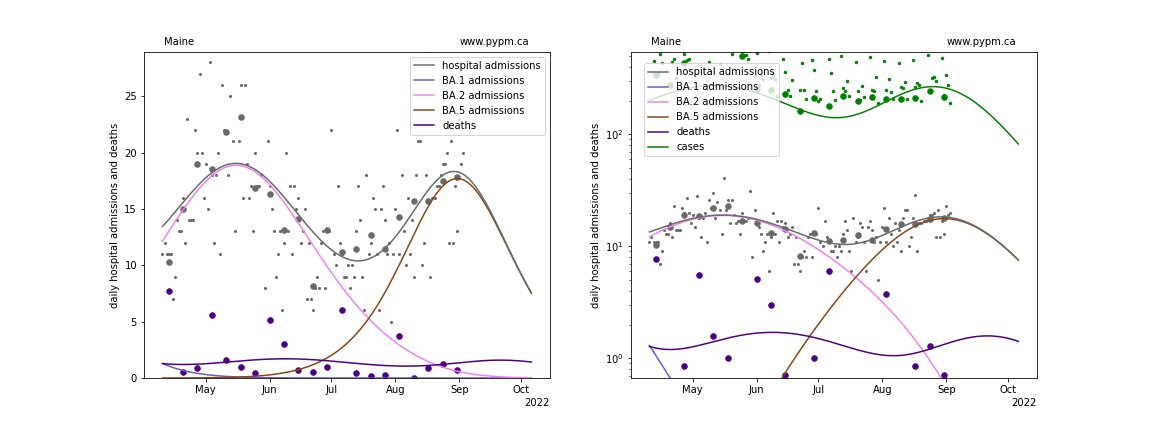
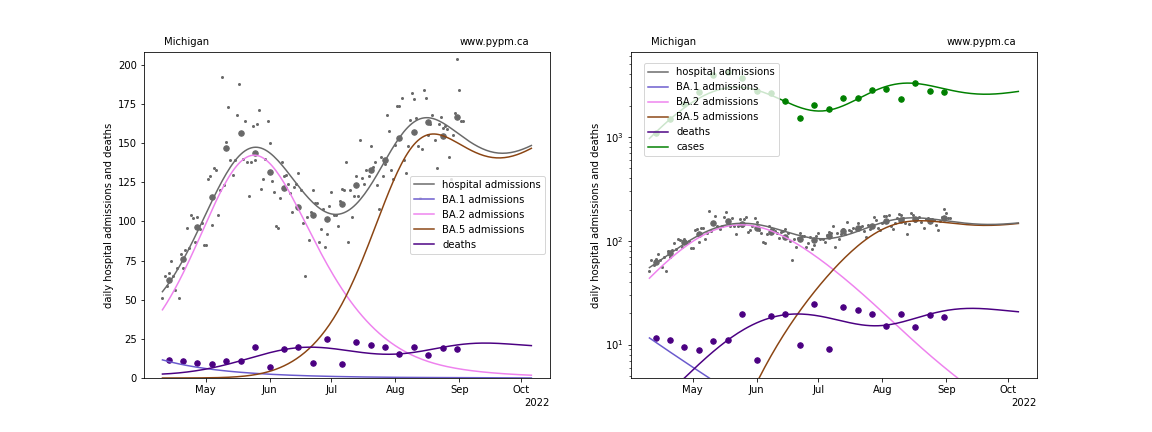
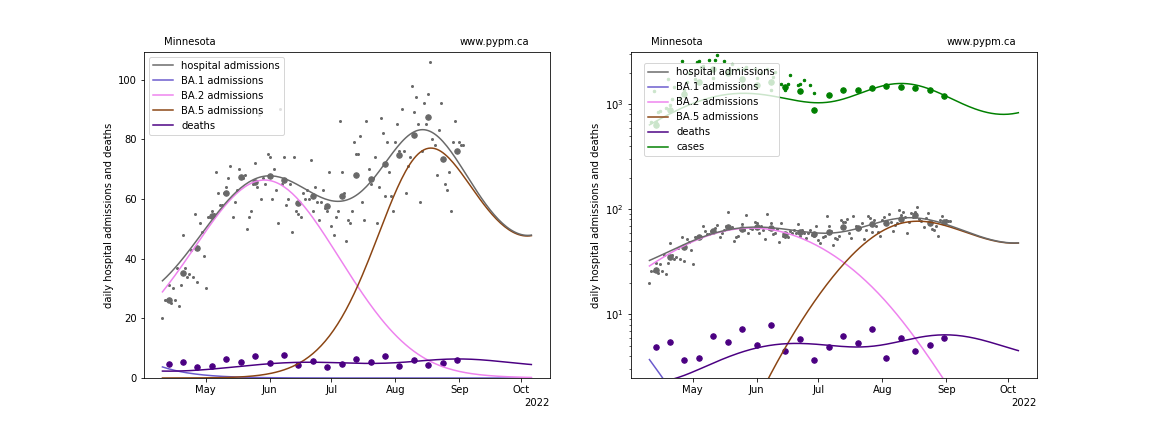
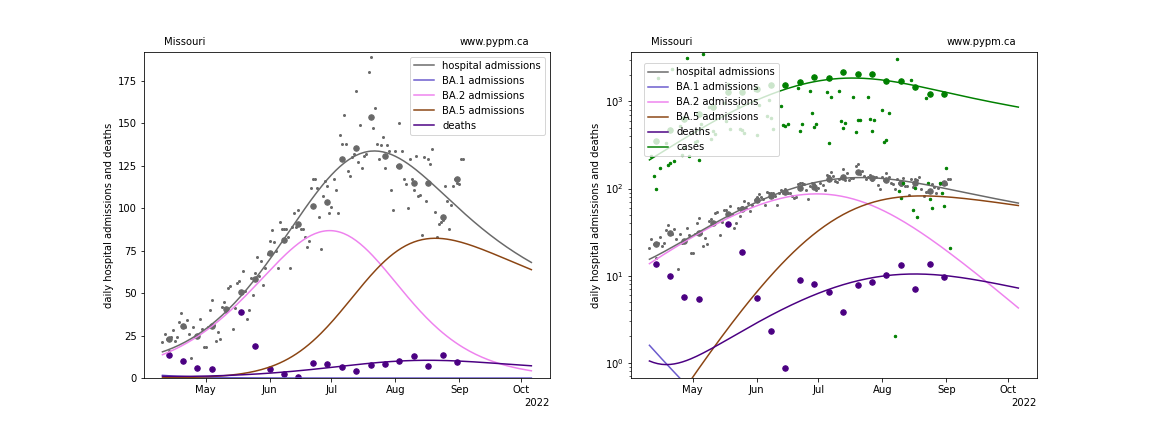
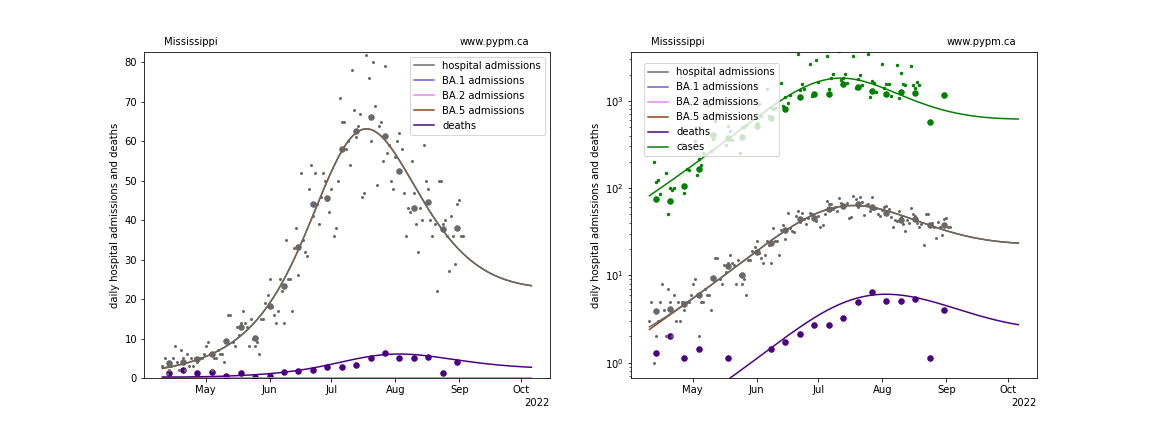
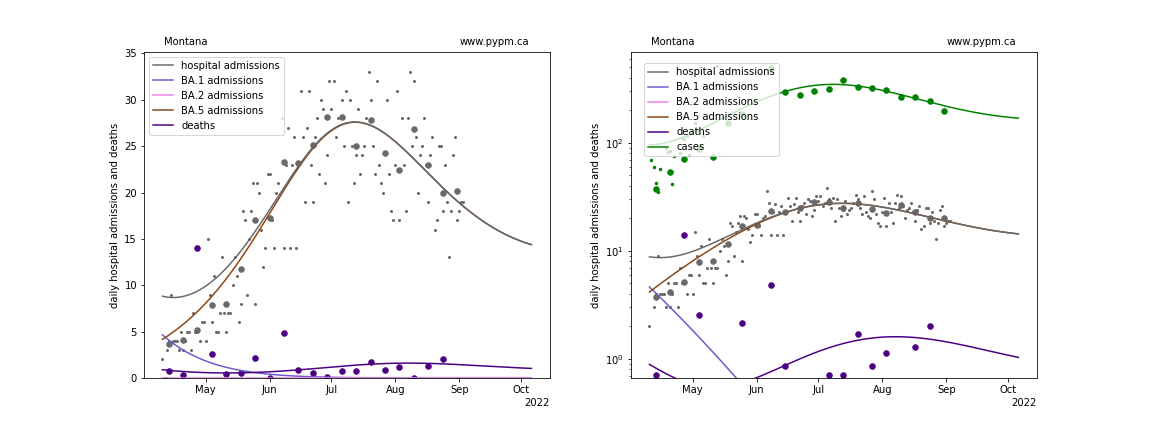
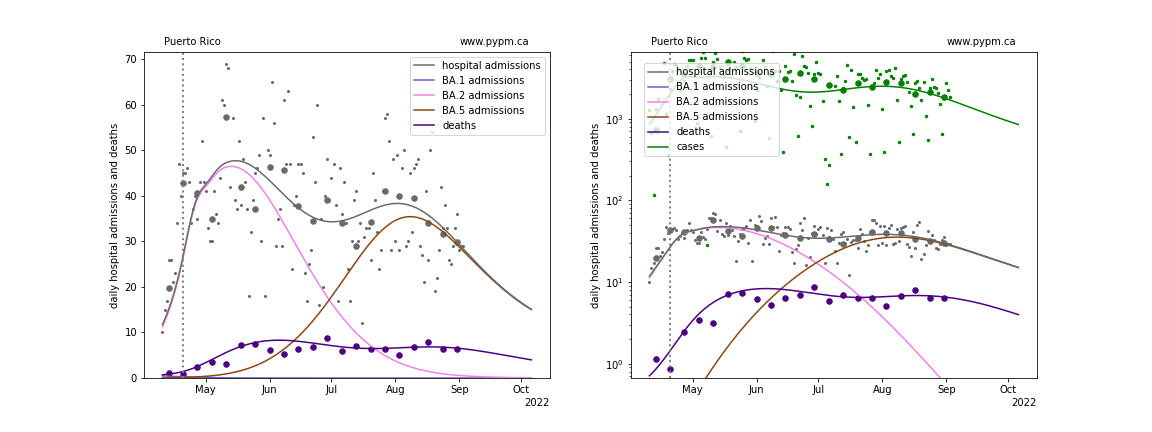
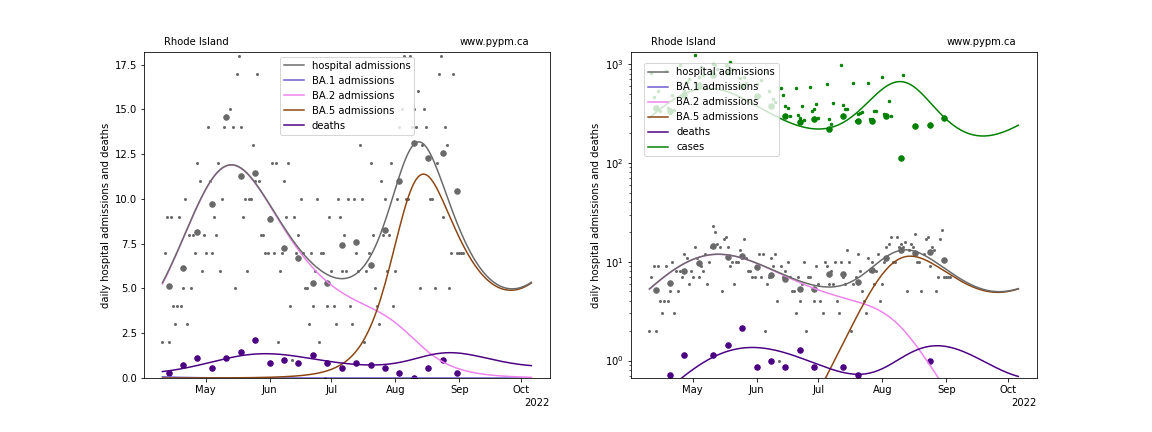
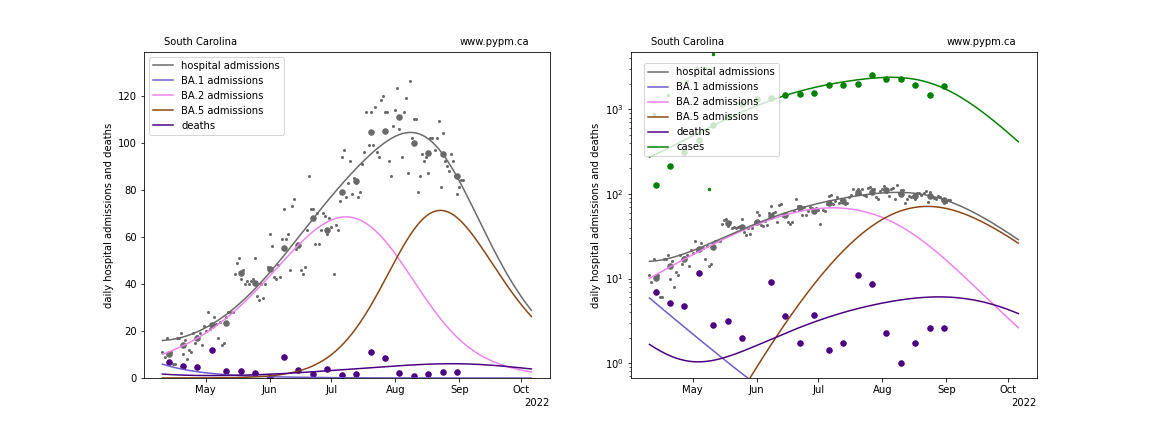
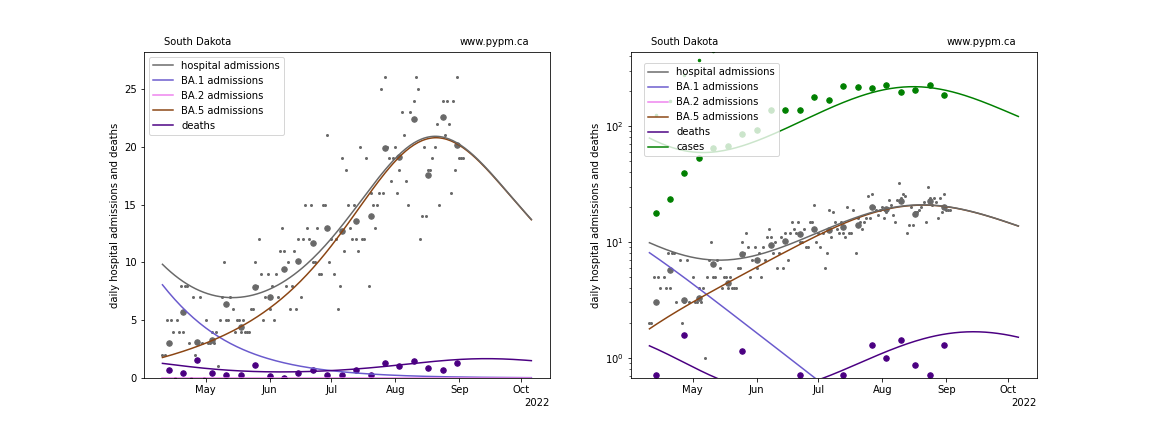
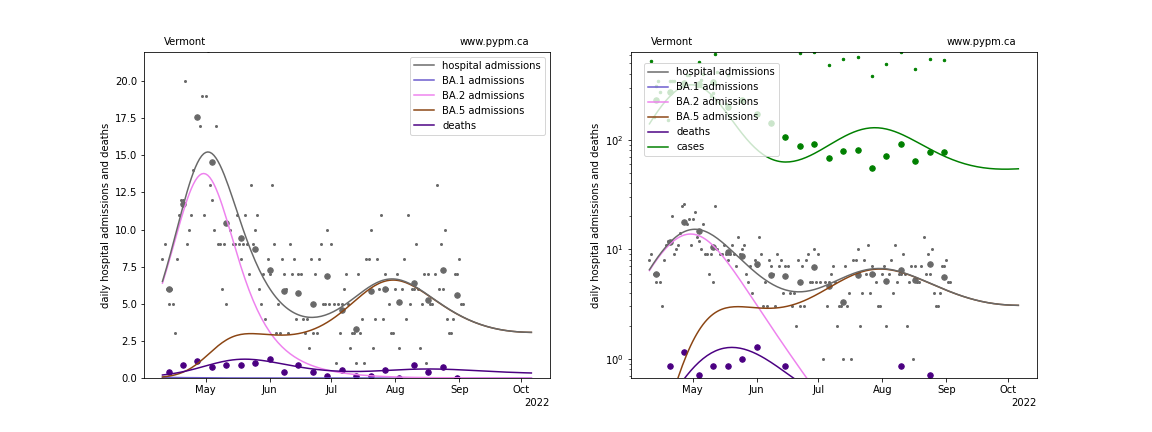
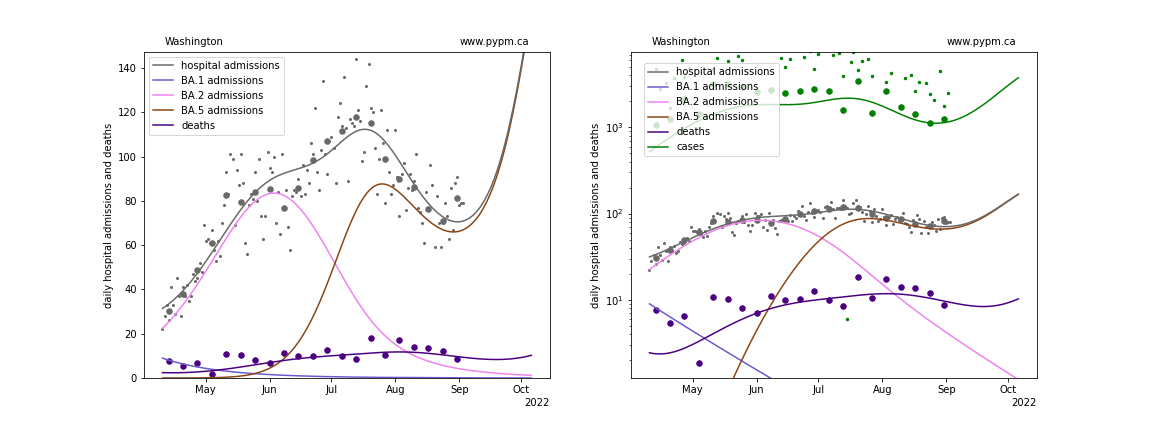
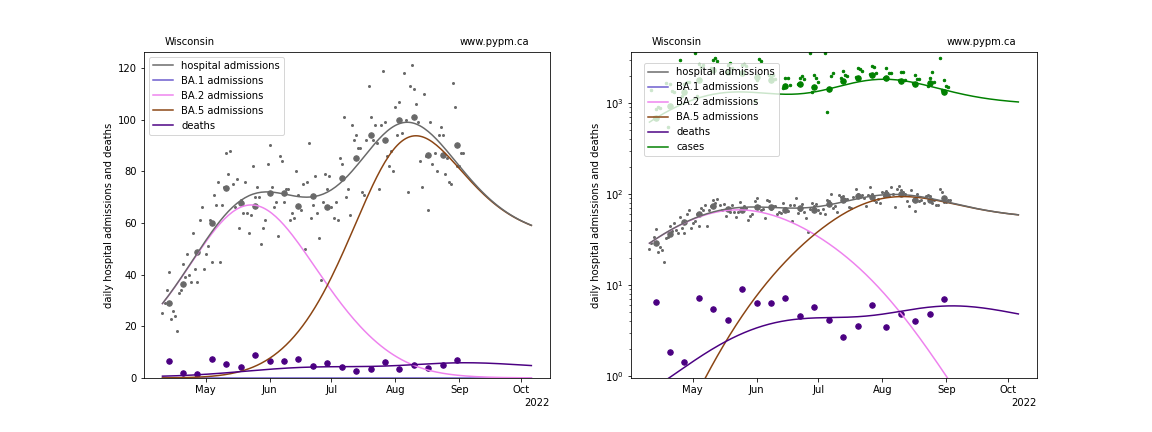
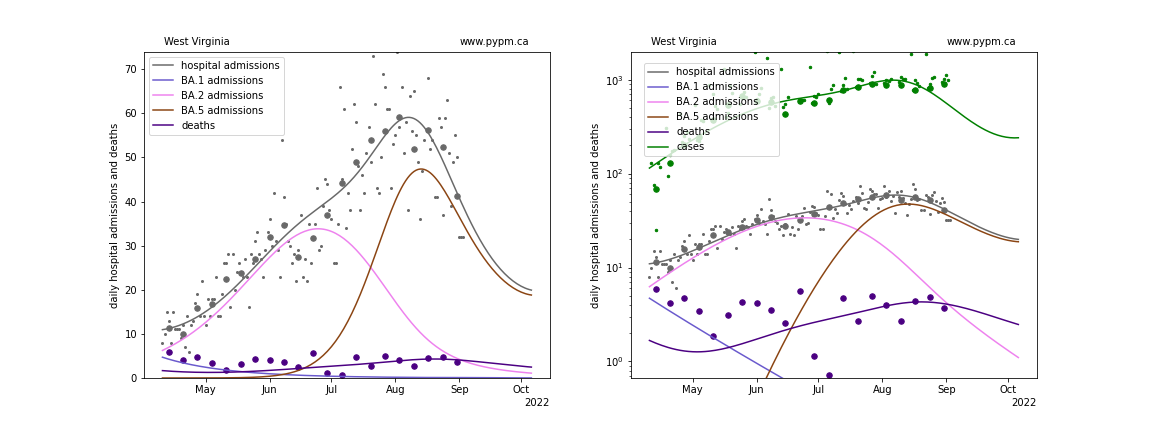
The plots for each state below show the daily hospital admissions and deaths since April on a linear scale (left) and log scale (right). Cases are also included on the right. BA.4 and BA.5 are combined into one strain, labelled BA.5. For some states, the combination of BA.2, BA.4 and BA.5 are combined in one strain, labelled BA.5.
The projections below show a significant resurgance for some states. These are not definitive predictions, but instead is an indication of the sensitivity on the degree to which immunity wanes, which is not yet well established.
Alaska
Alabama
Arkansas
Arizona
California
Colorado
Connecticut
District Of Columbia
Delaware
Florida
Georgia
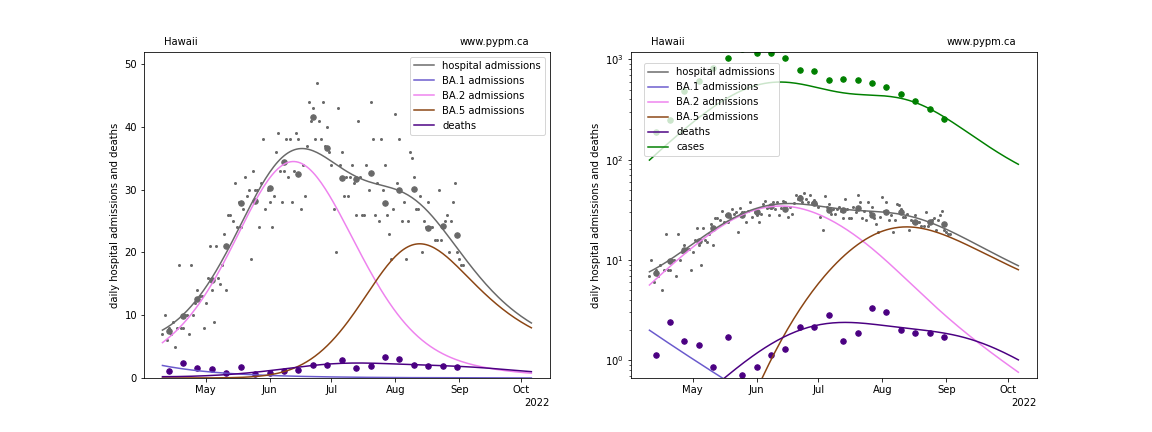
Hawaii
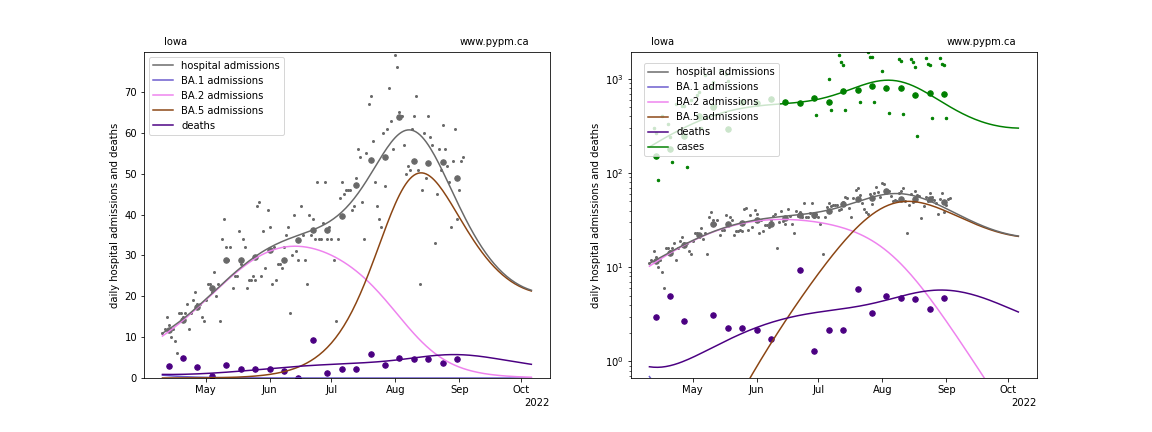
Iowa
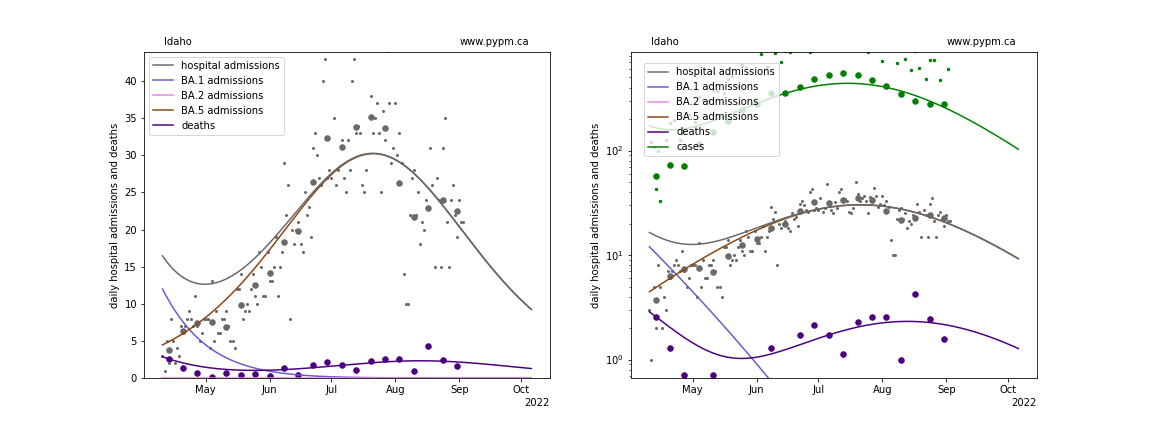
Idaho
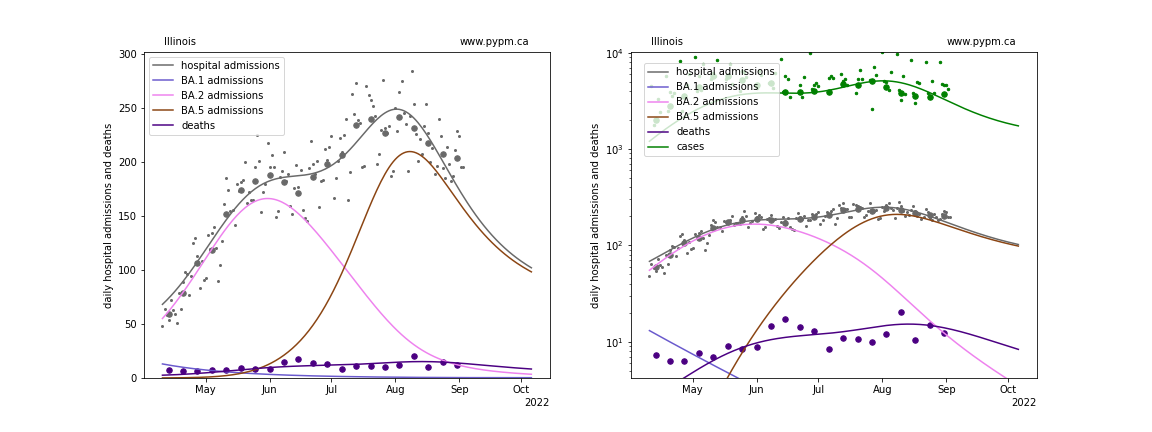
Illinois
Indiana
Kansas
Kentucky
Louisiana
Massachusetts
Maryland
Maine
Michigan
Minnesota
Missouri
Mississippi
Montana
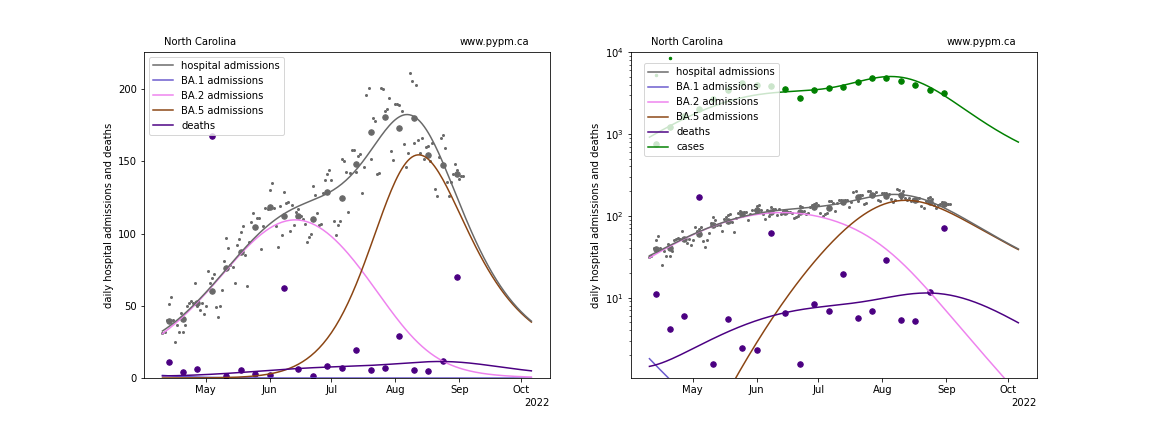
North Carolina
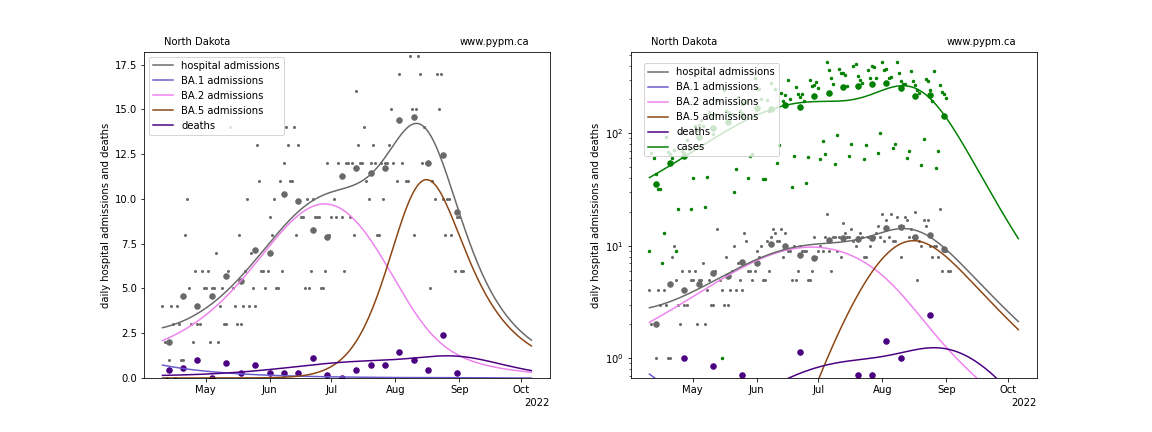
North Dakota
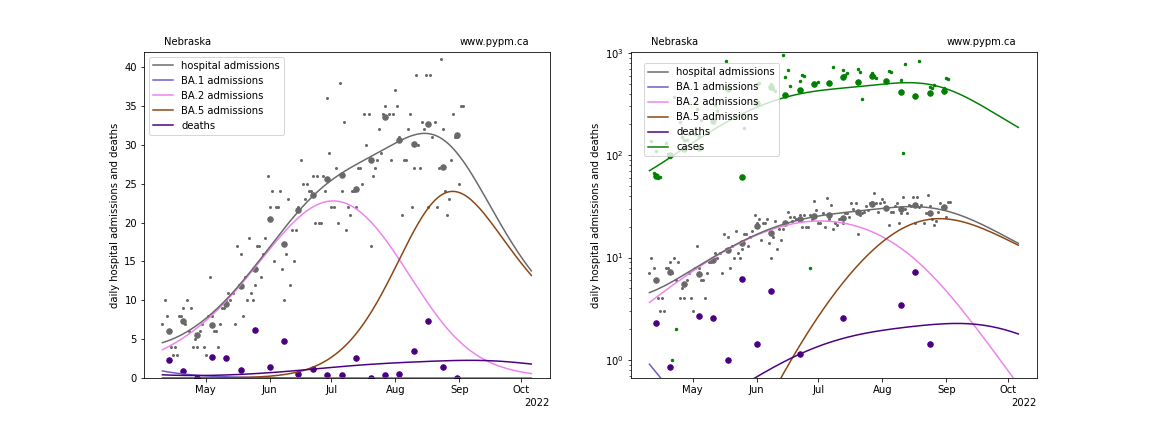
Nebraska
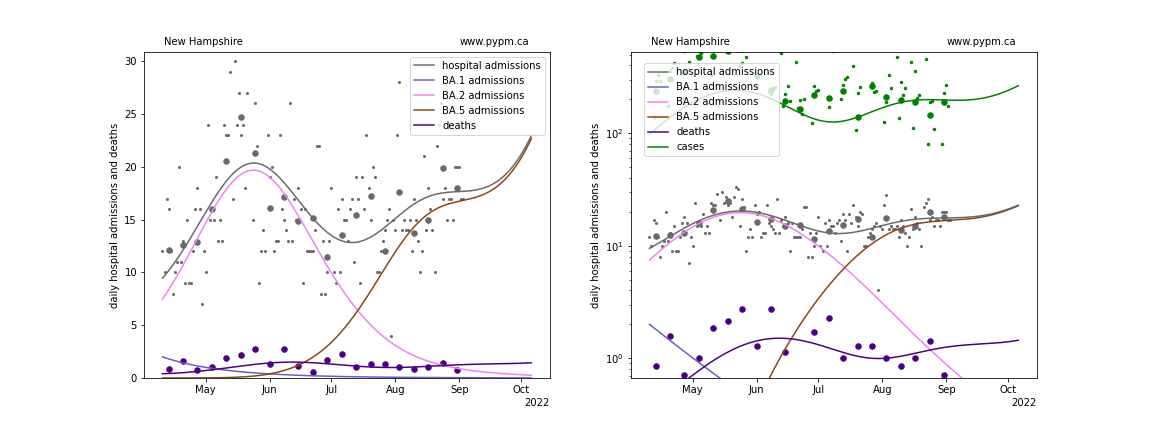
New Hampshire
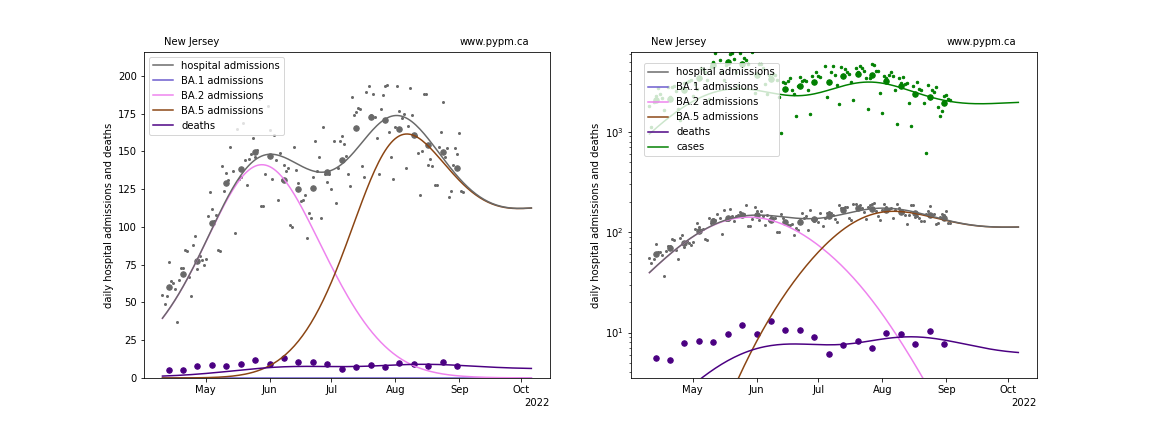
New Jersey
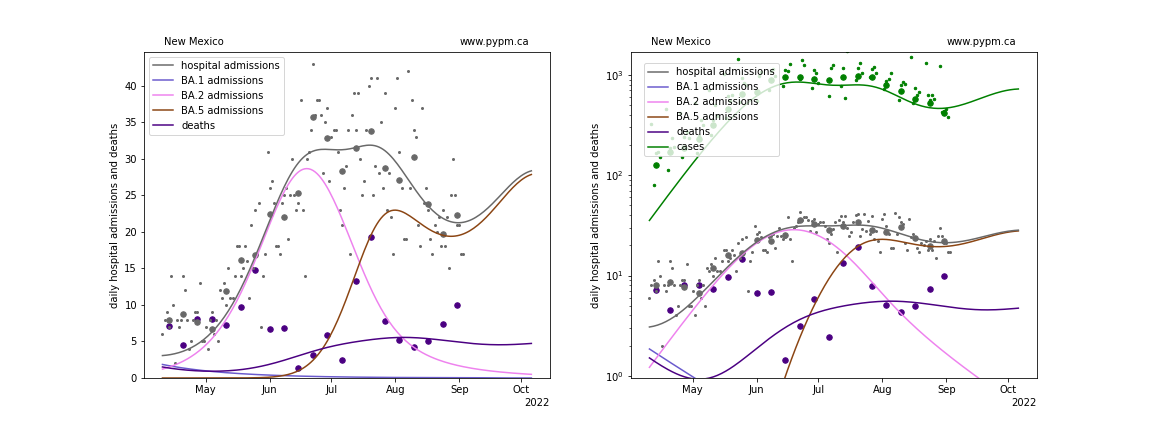
New Mexico
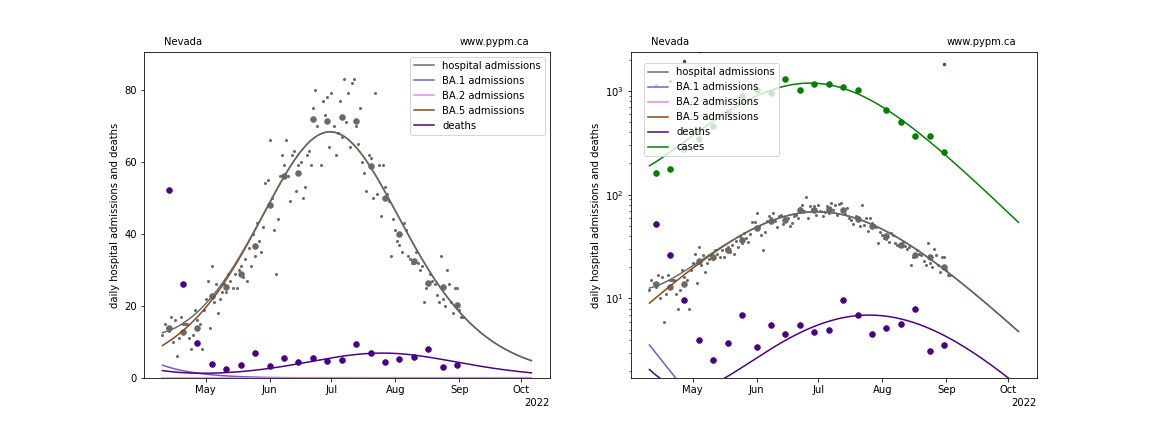
Nevada
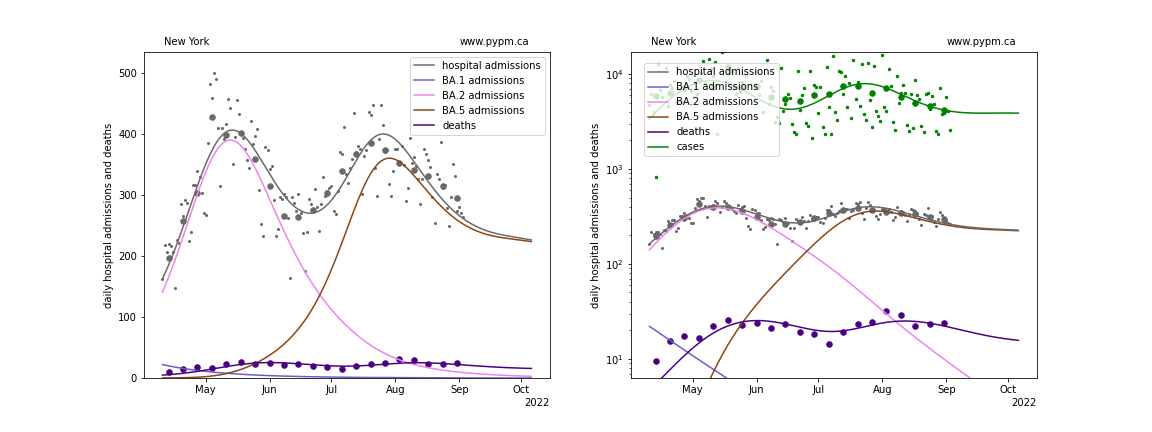
New York
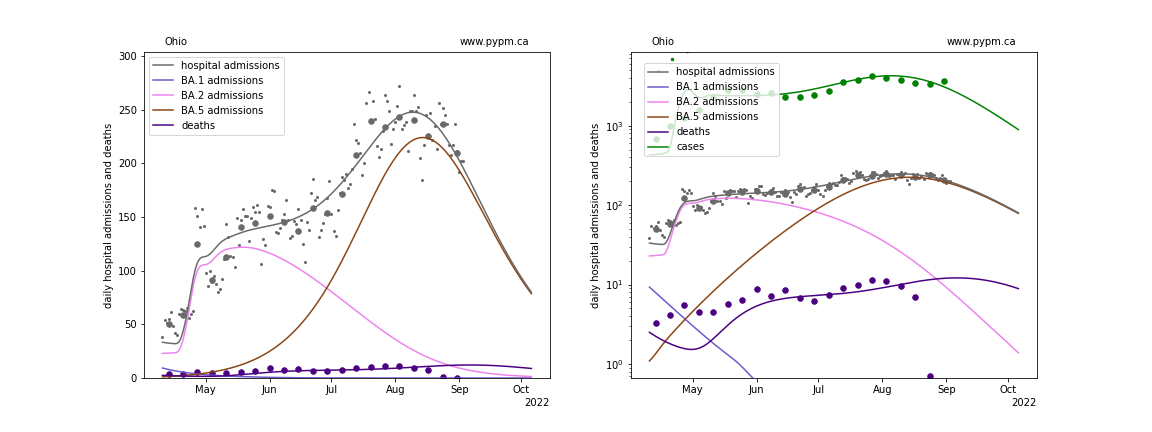
Ohio
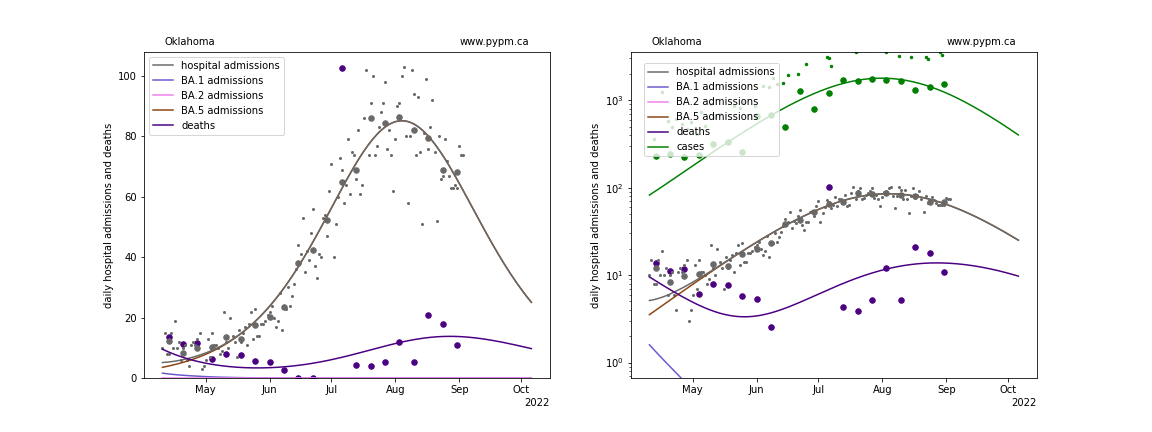
Oklahoma
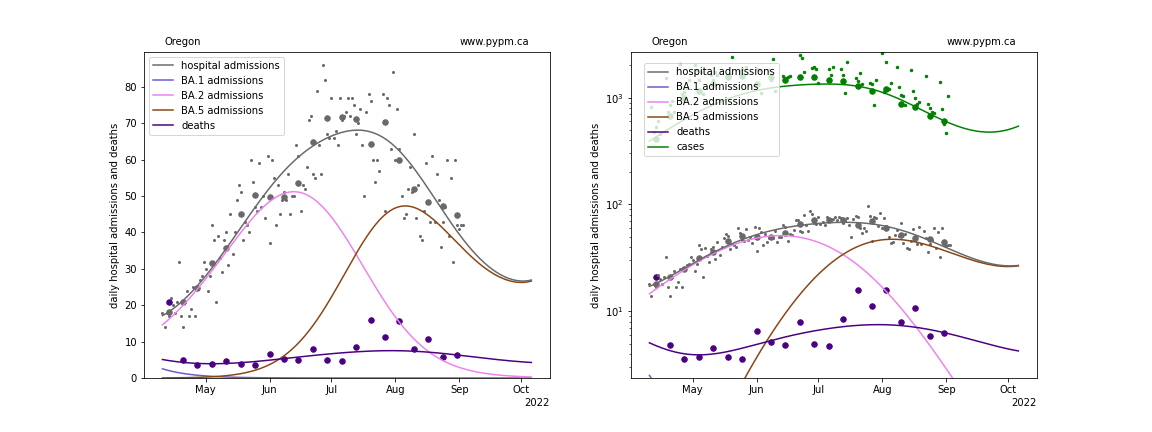
Oregon
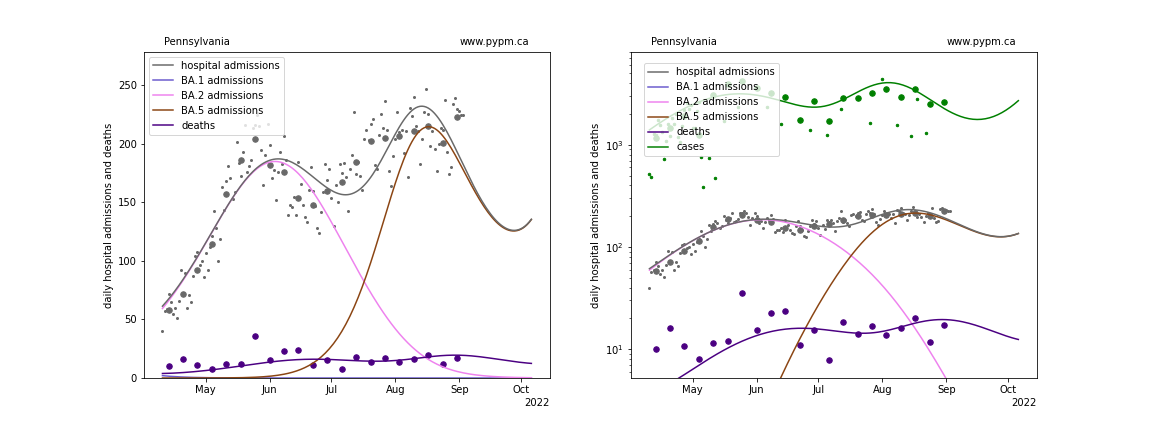
Pennsylvania
Puerto Rico
Rhode Island
South Carolina
South Dakota
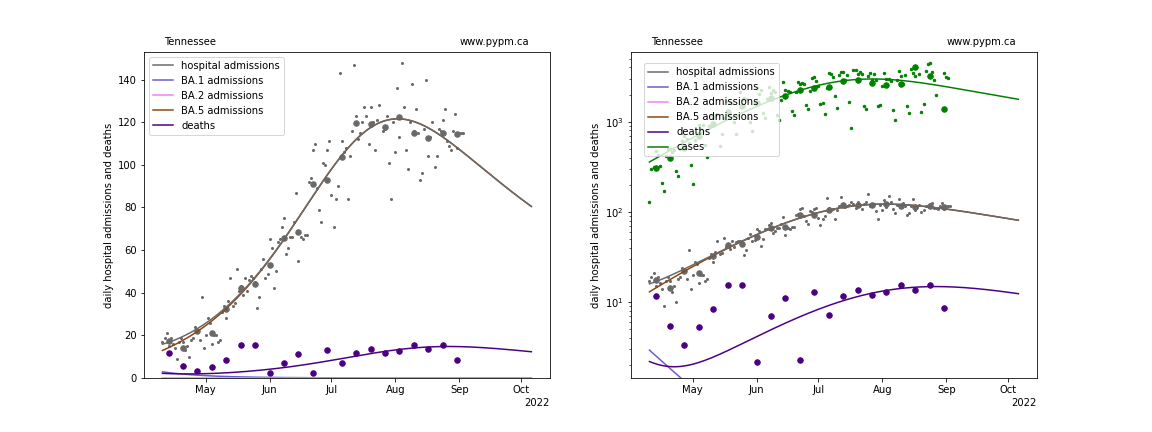
Tennessee
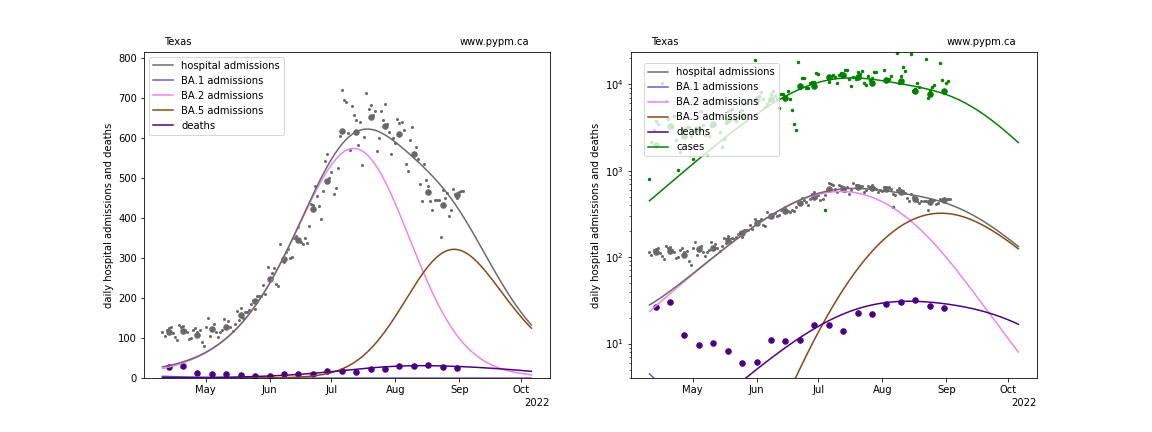
Texas
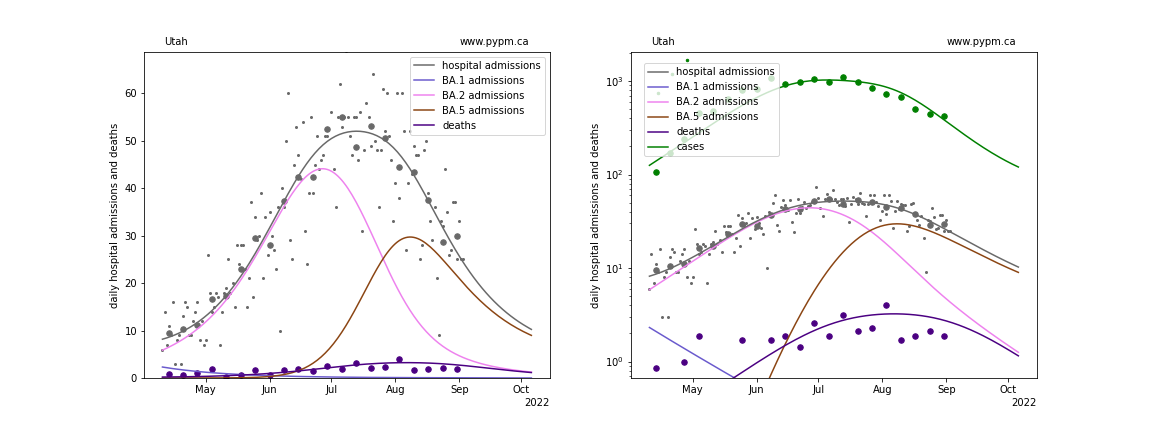
Utah
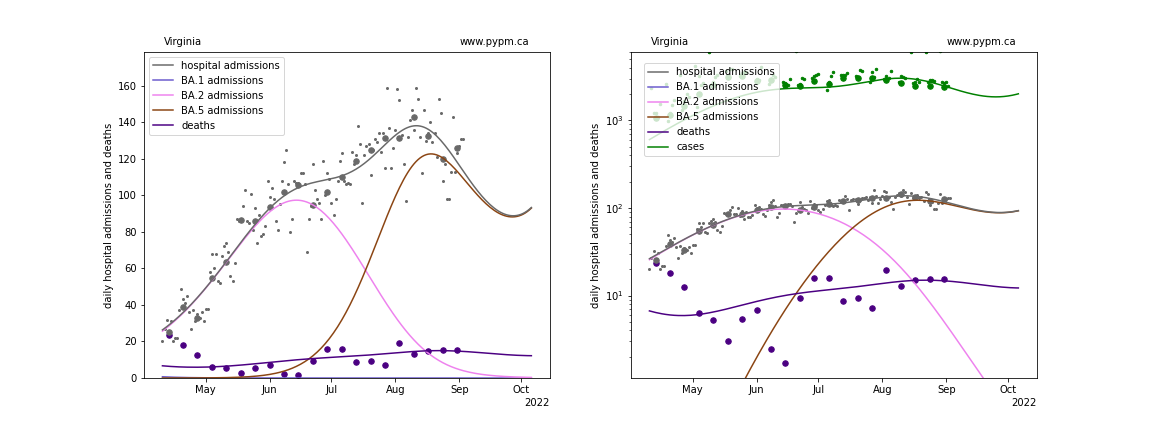
Virginia
Vermont
Washington
Wisconsin
West Virginia
Wyoming