March 21, 2021 Analysis of USA state data
Individual state histories
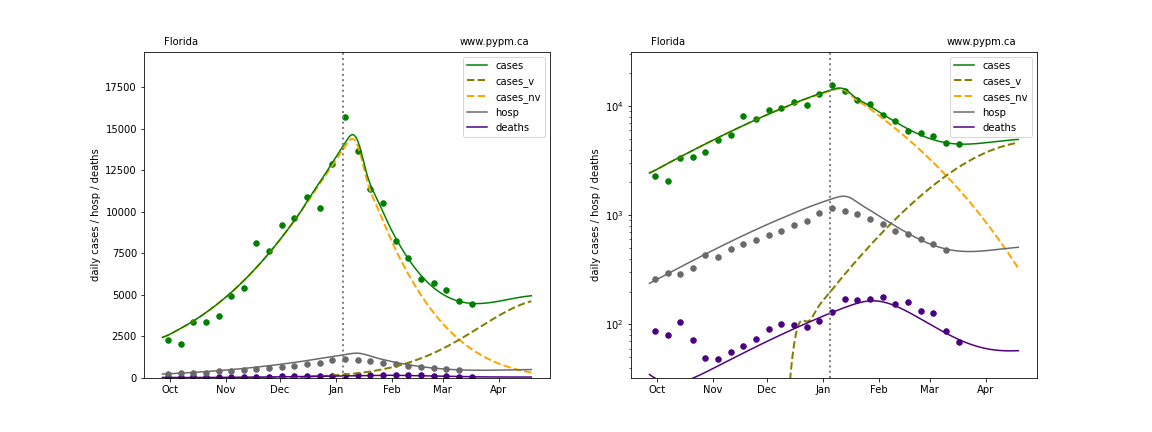
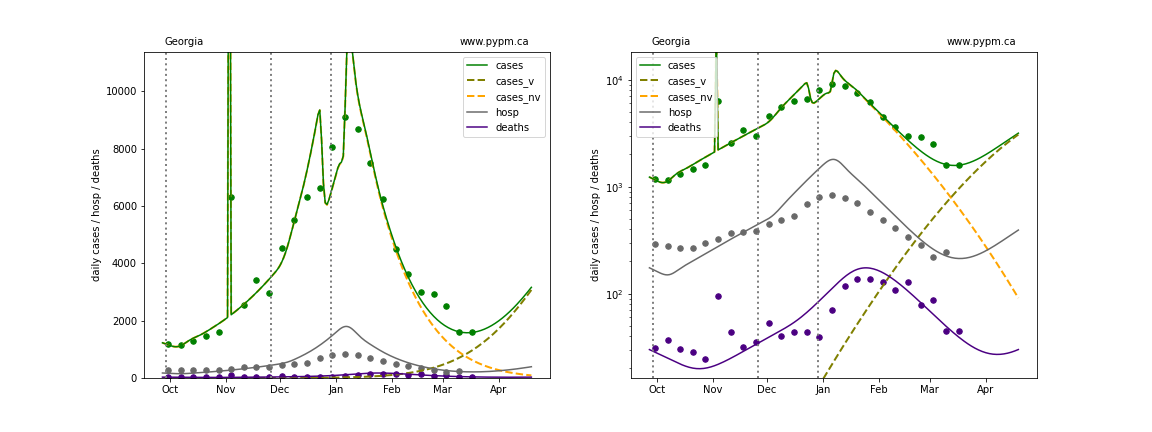
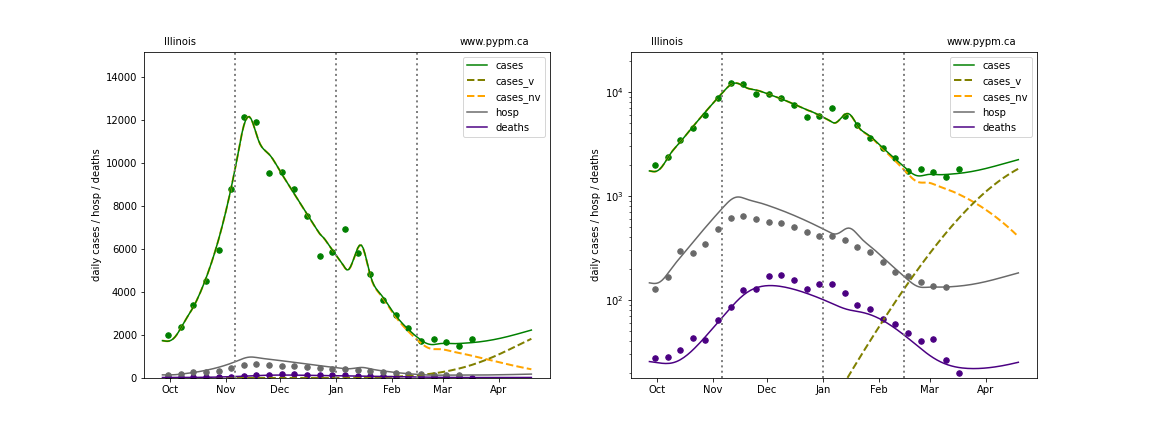
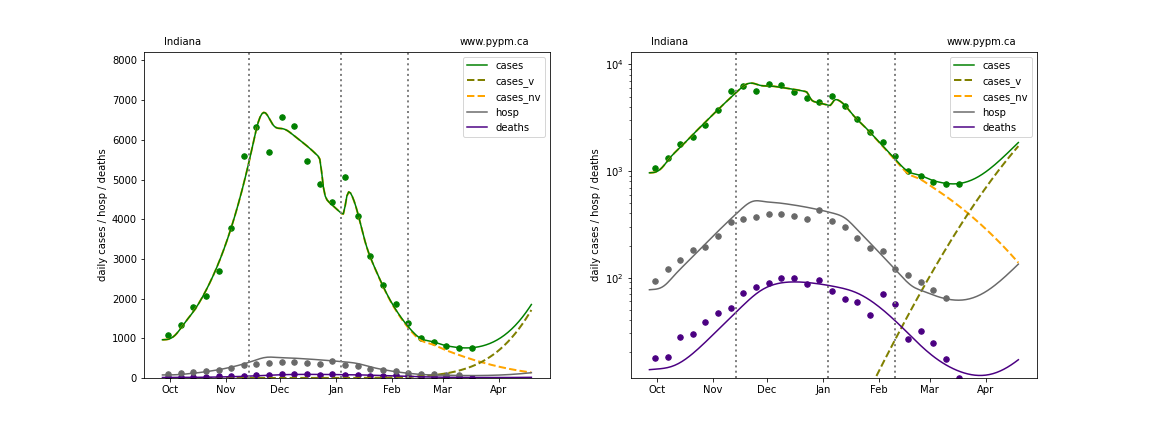
The plots below show the case / hospitalization / deaths data for all 50 states, DC, and PR. The data fits were done using data up until March 15, 2021.
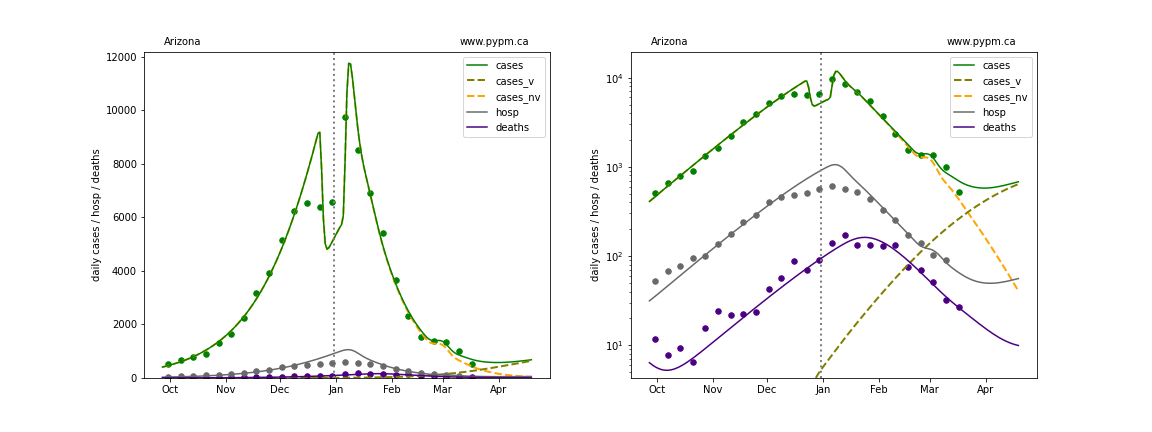
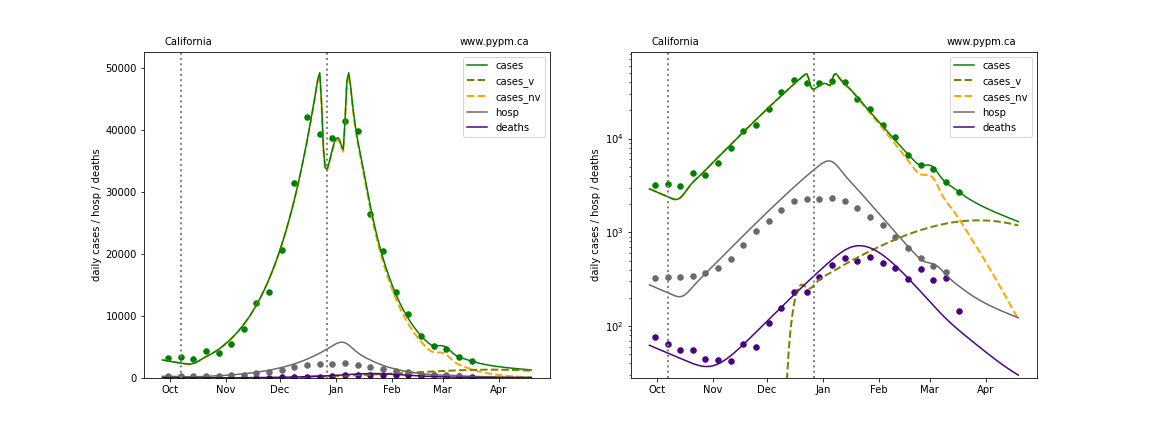
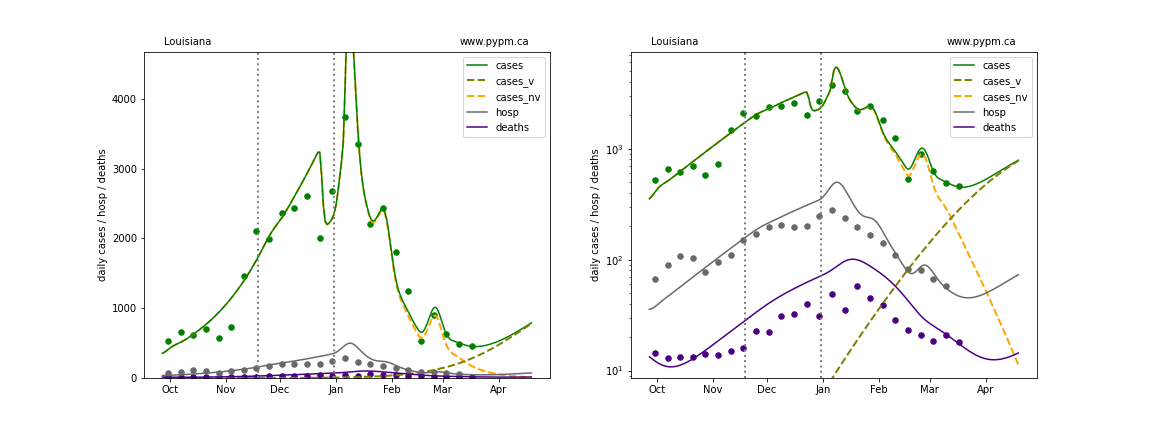
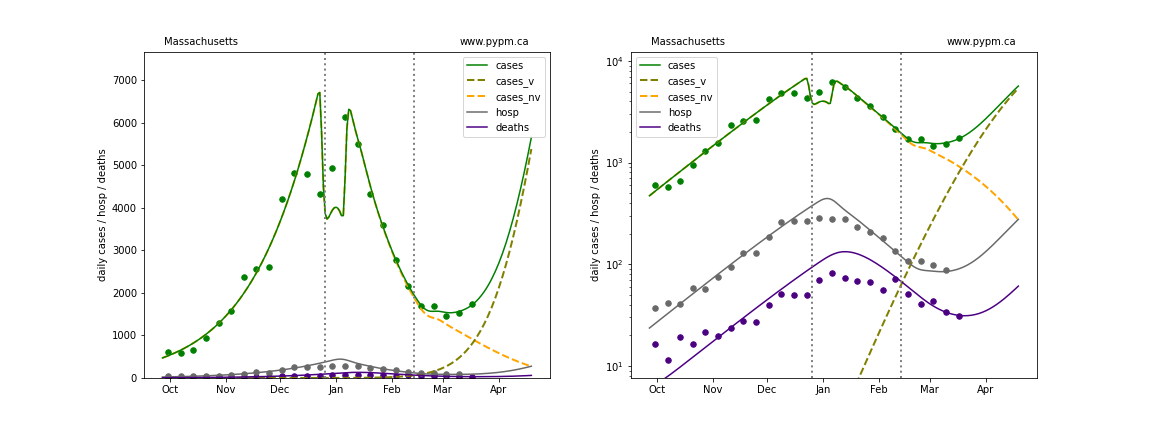
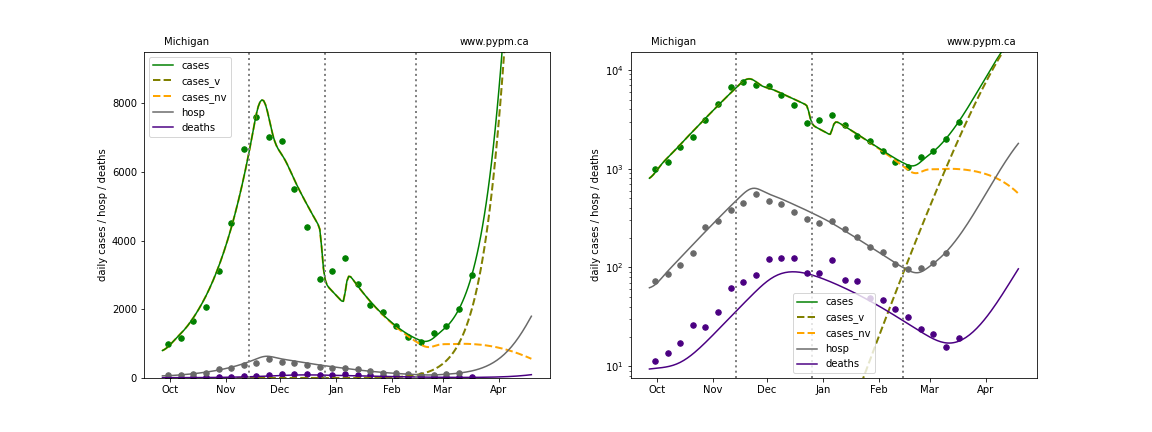
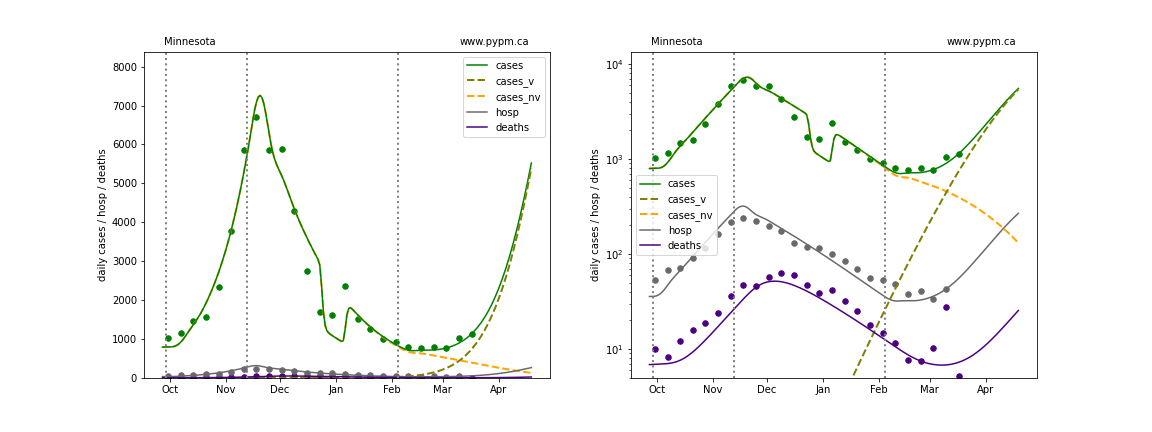
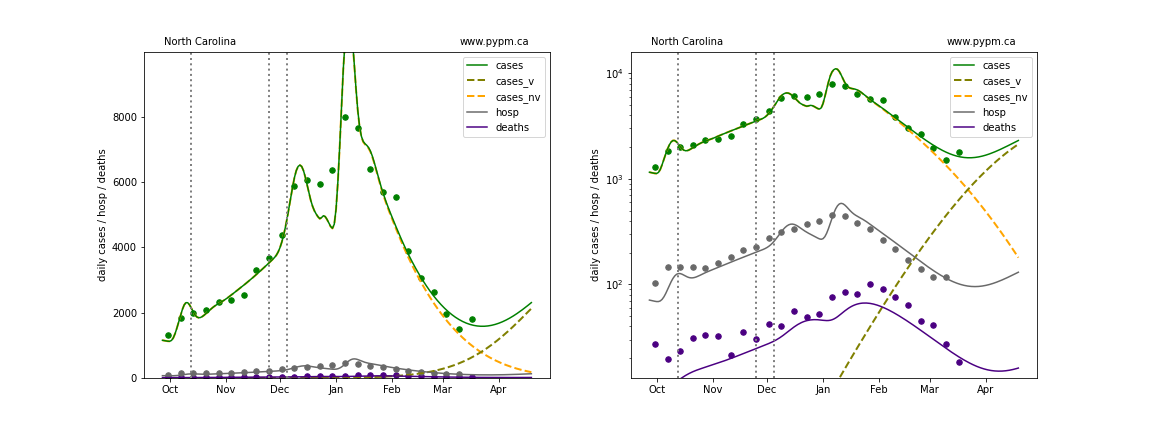
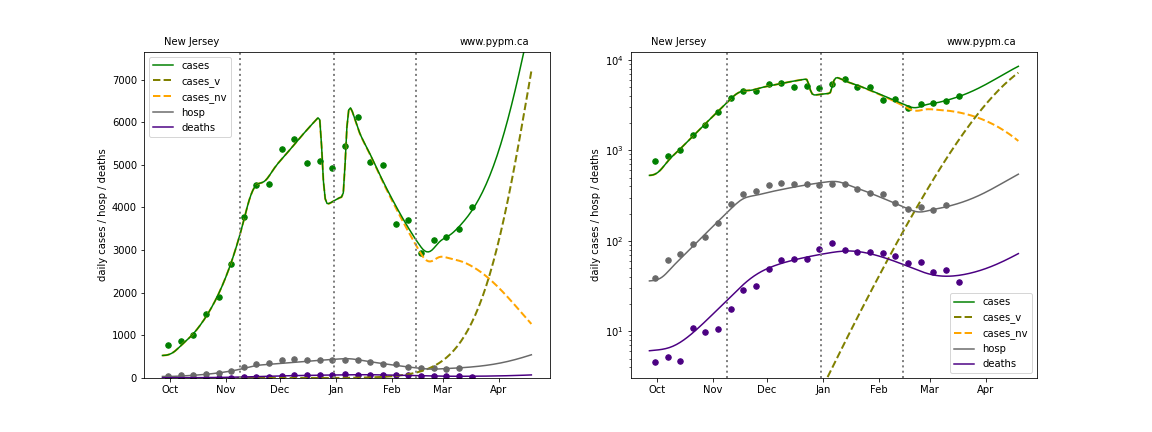
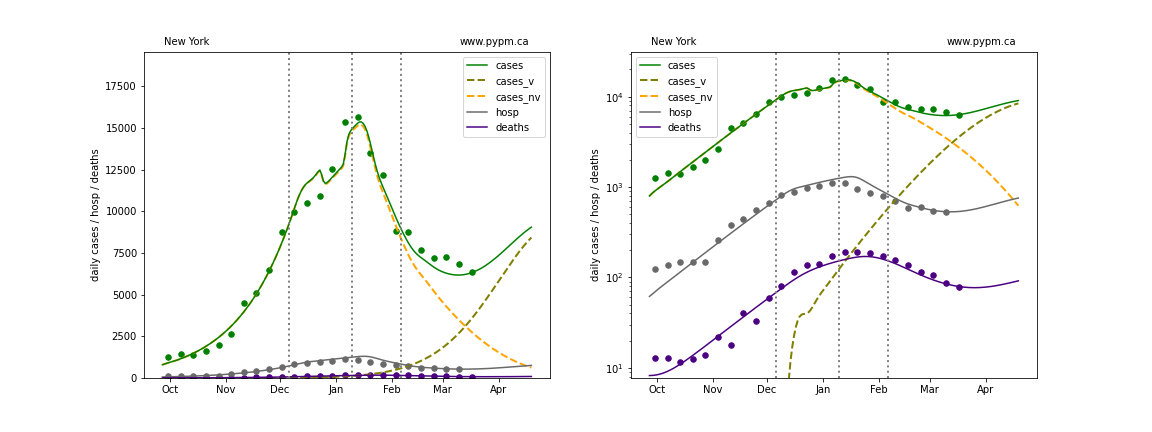
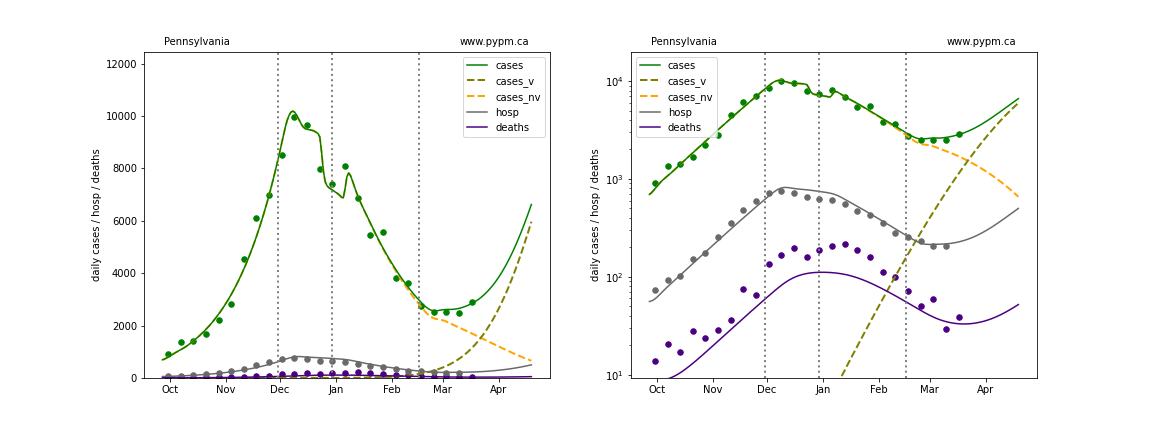
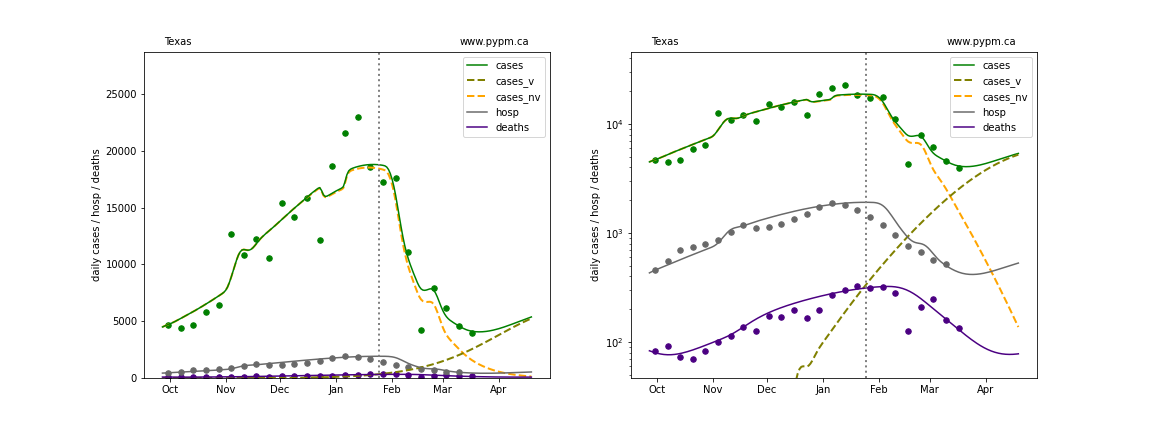
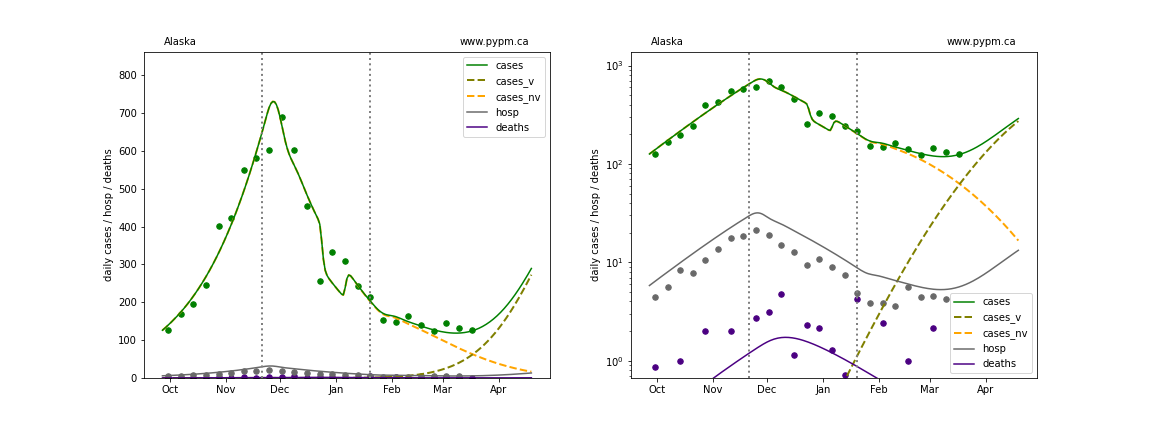
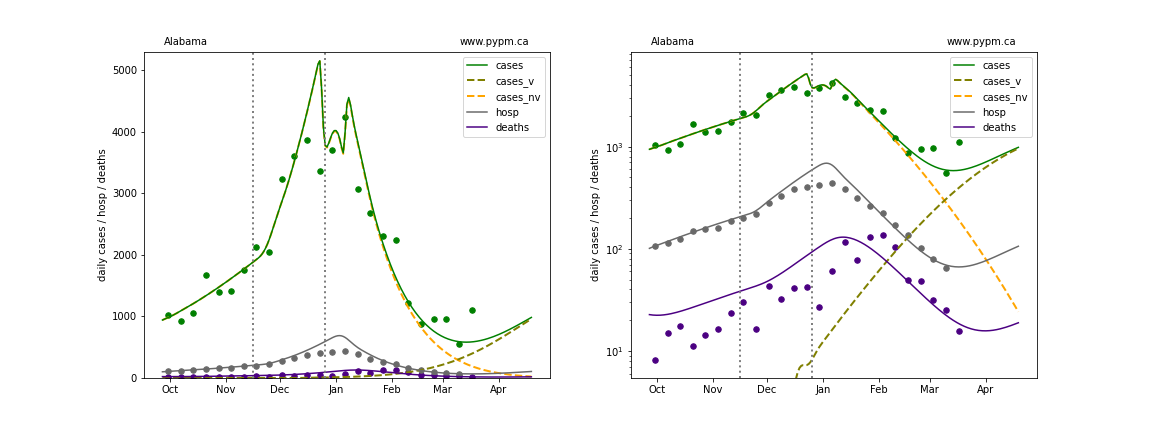
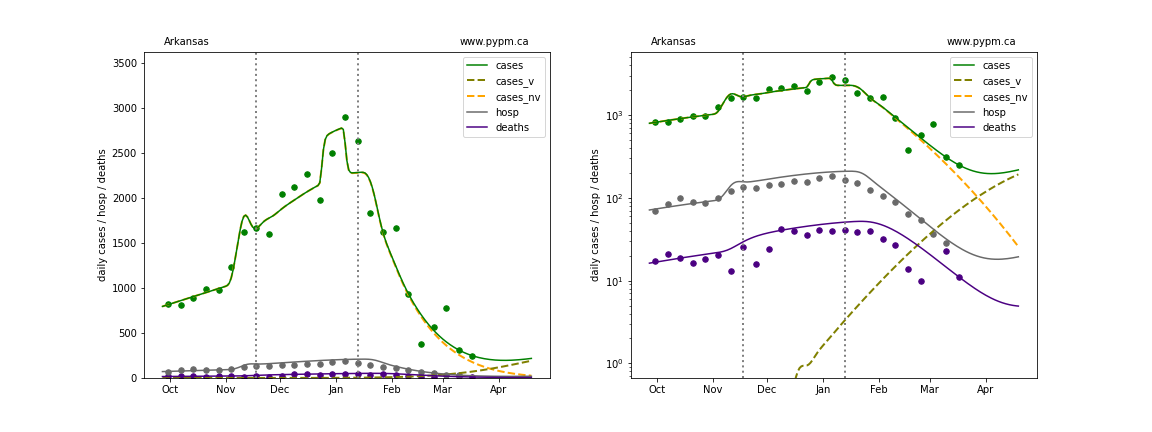
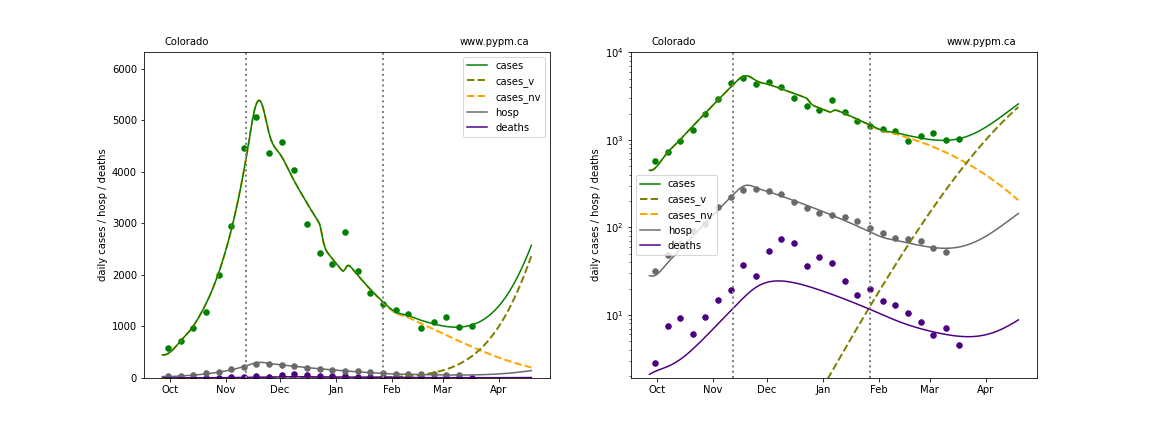
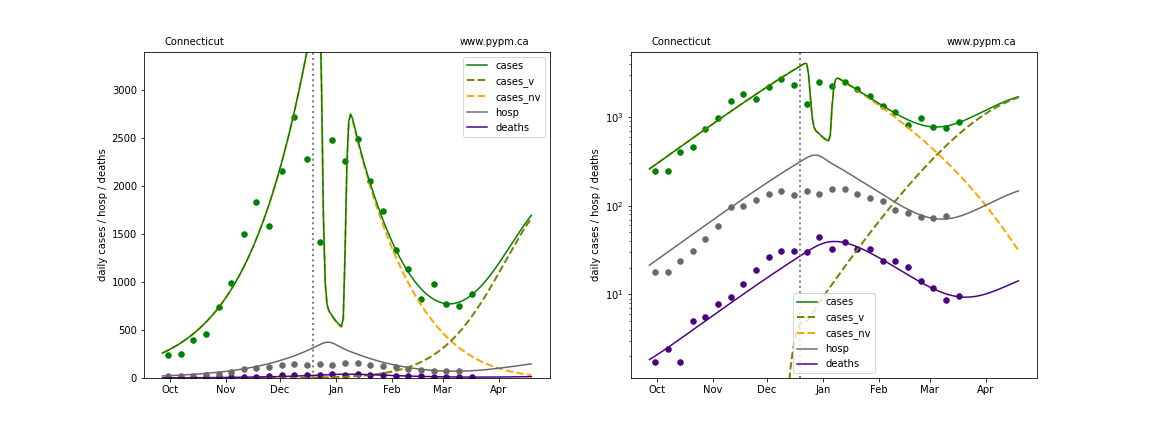
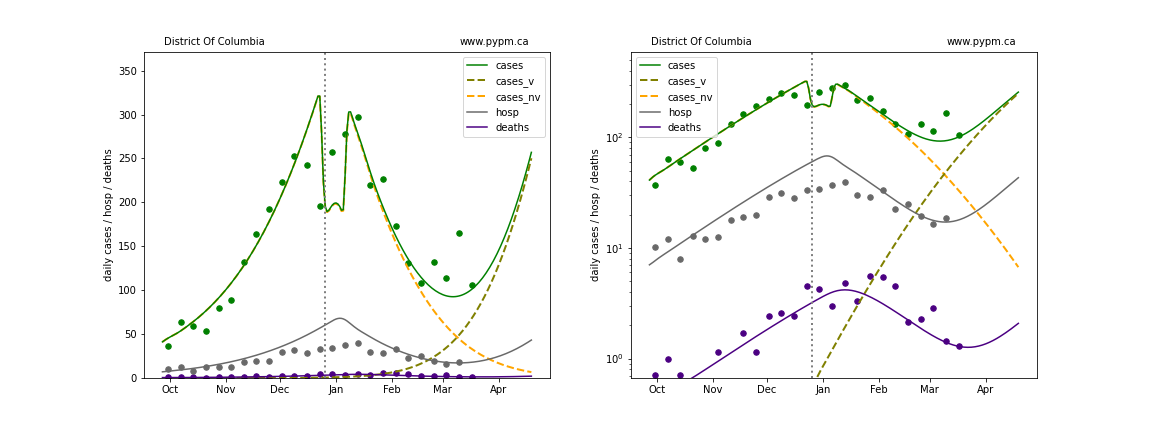
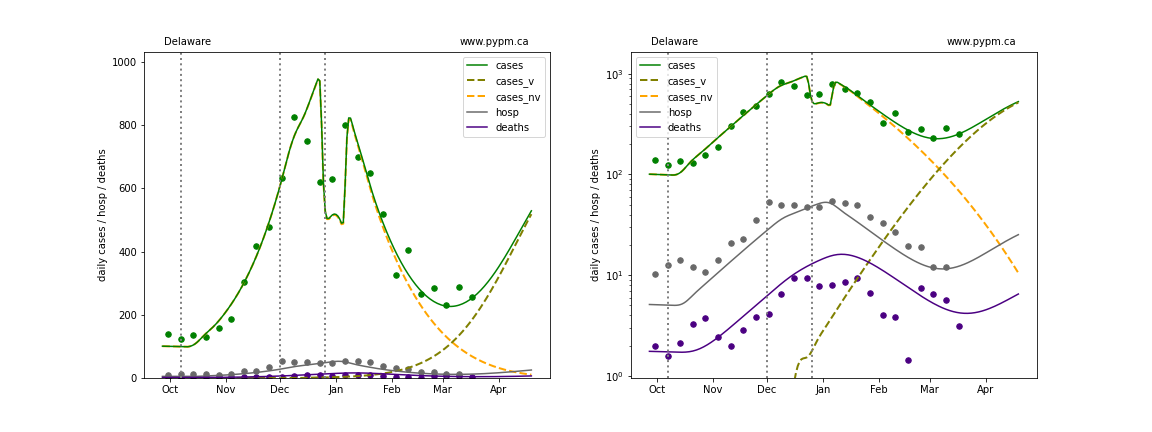
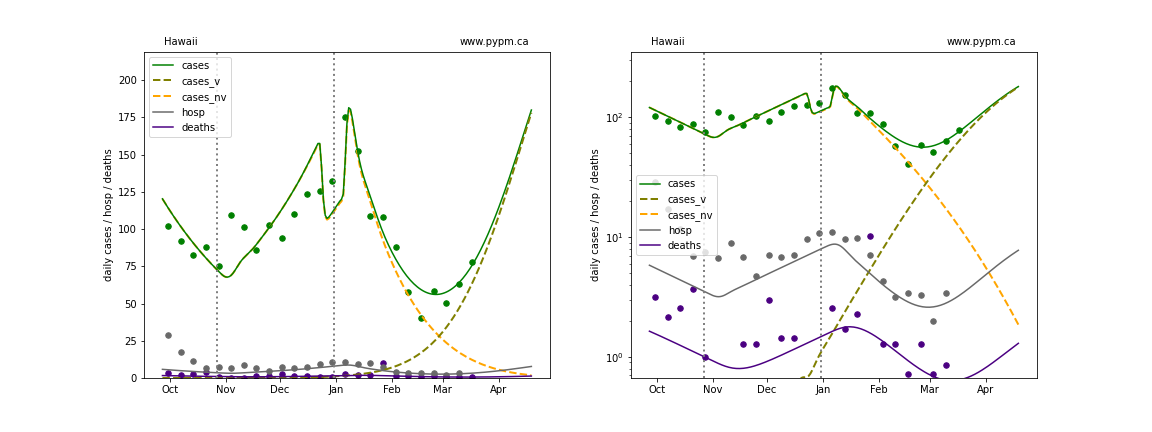
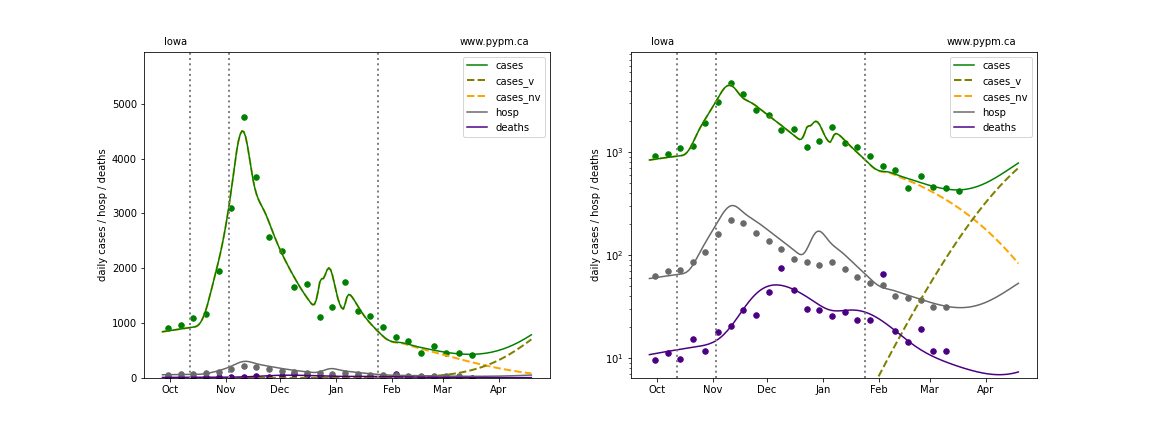
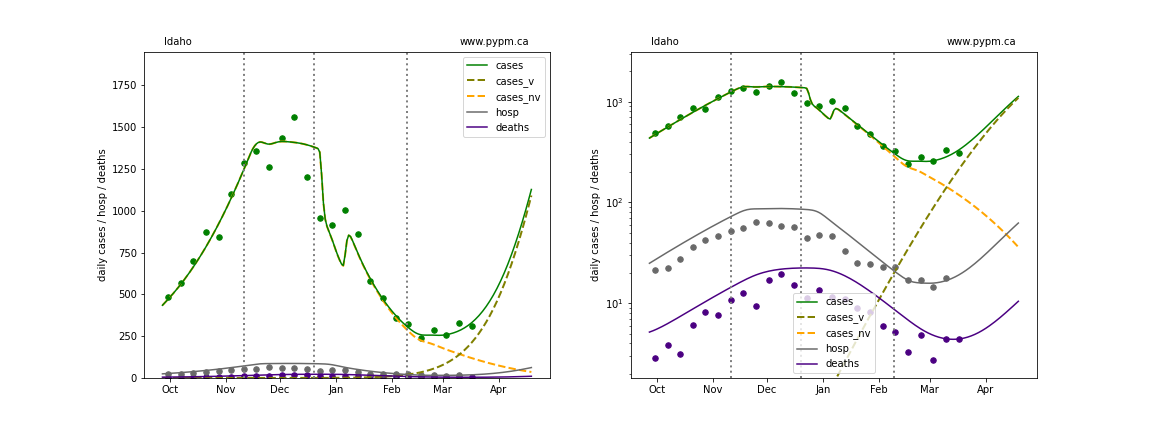
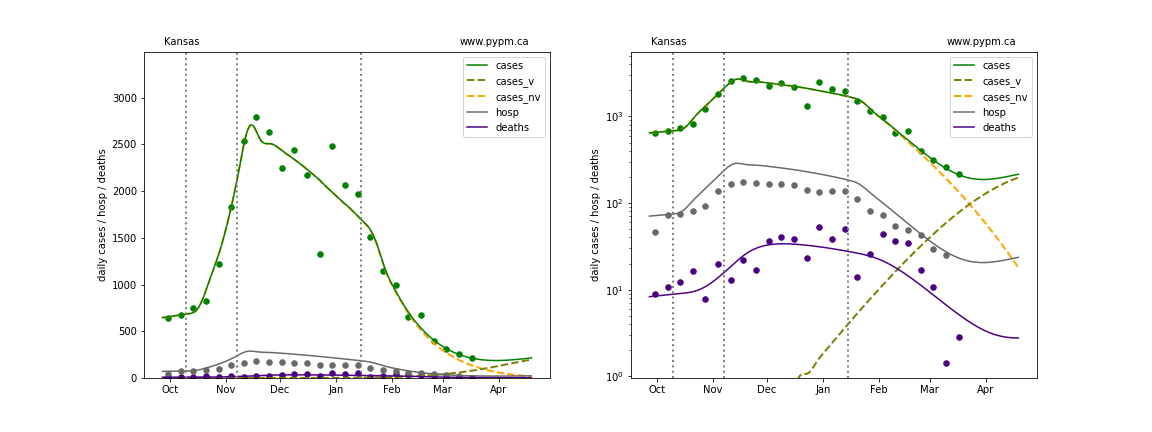
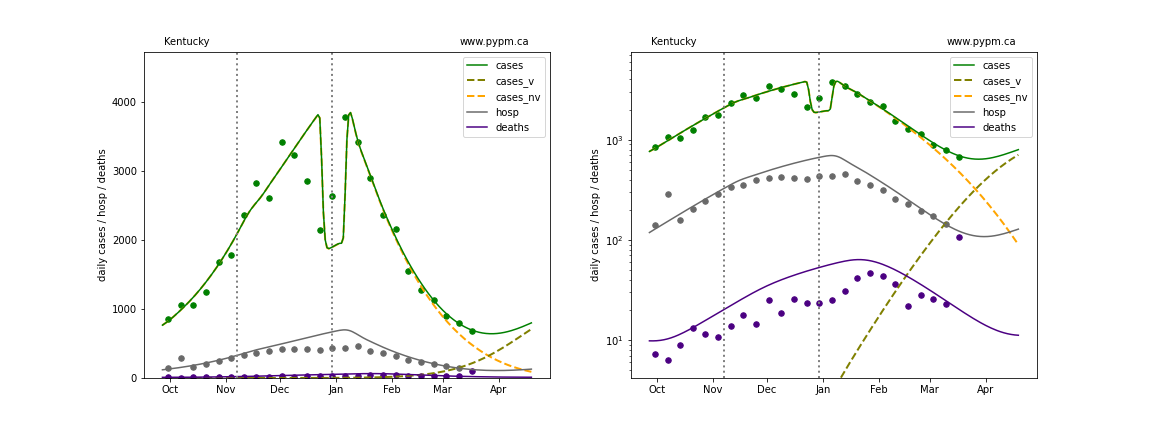
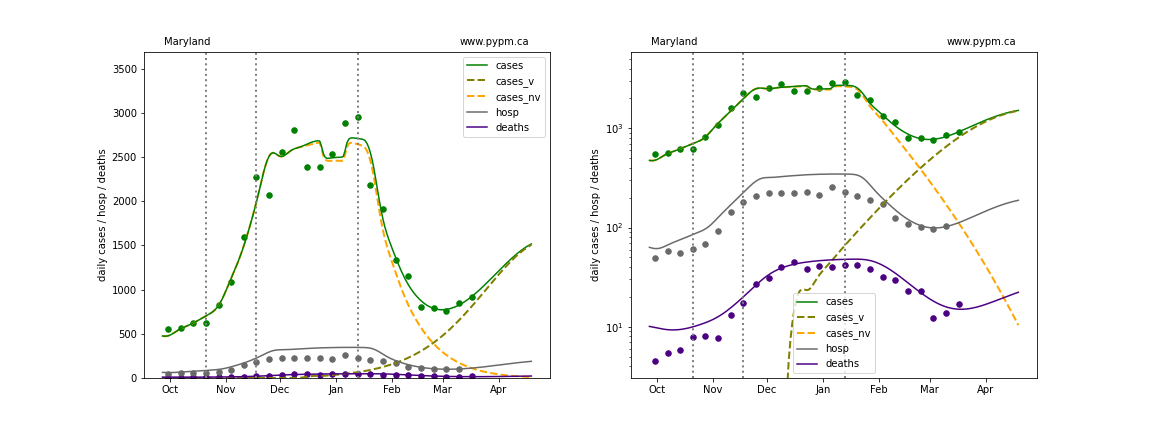
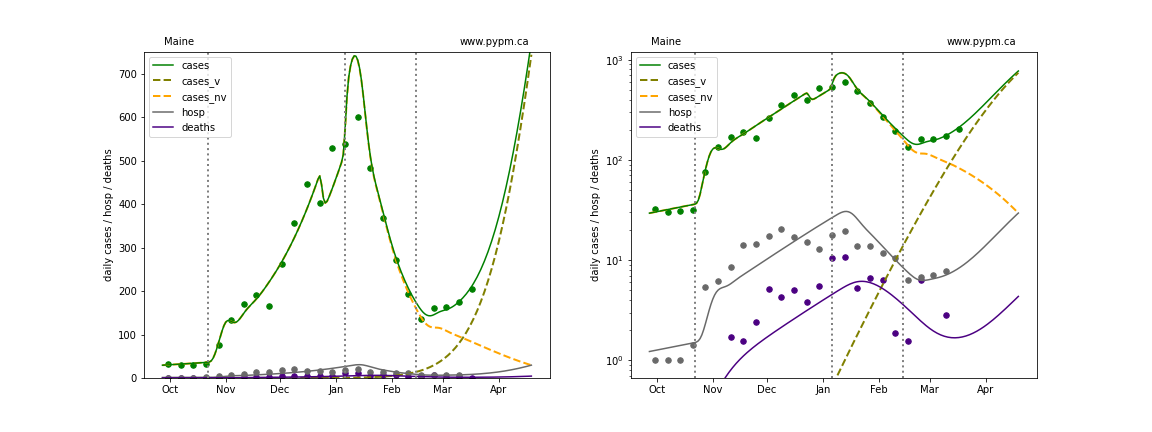
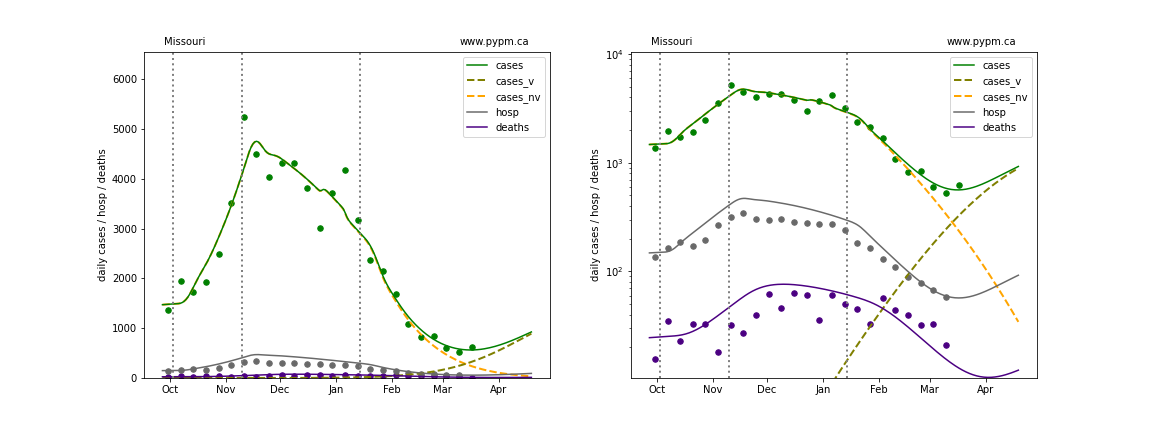
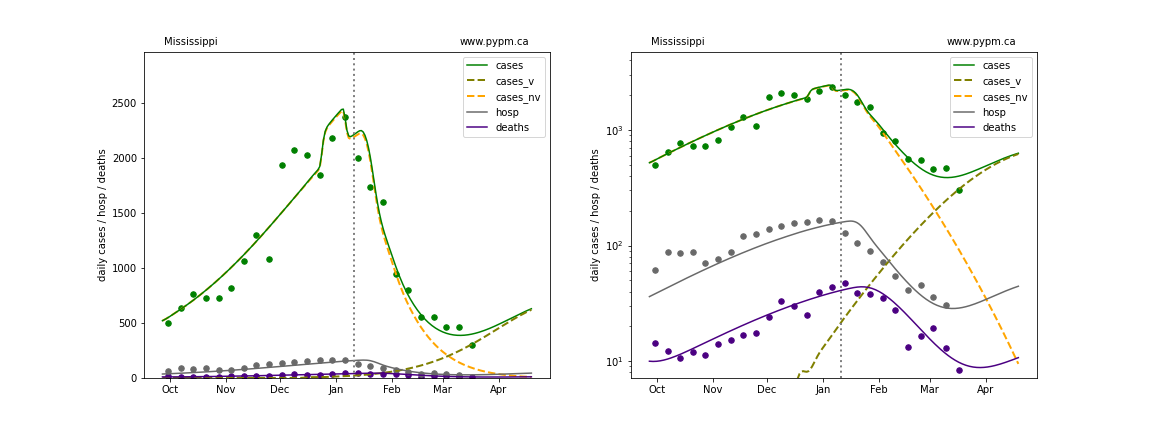
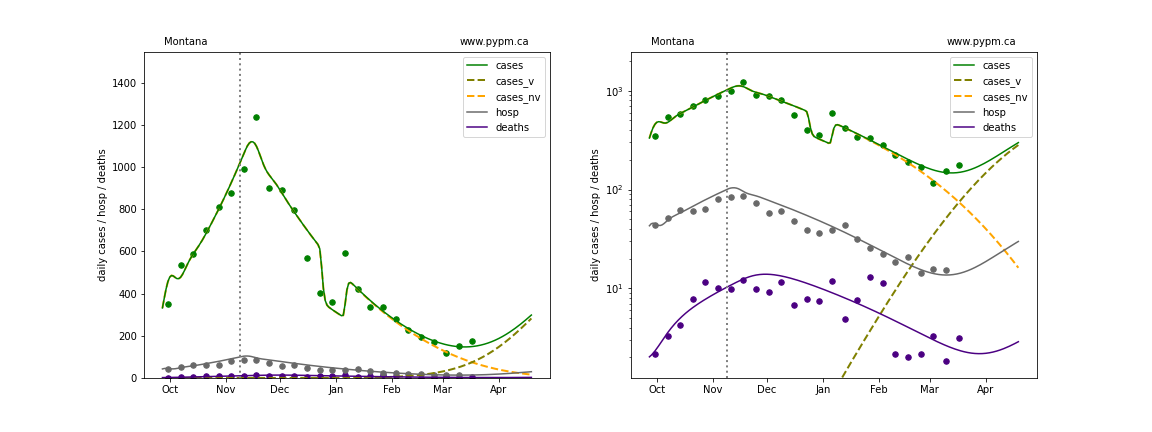
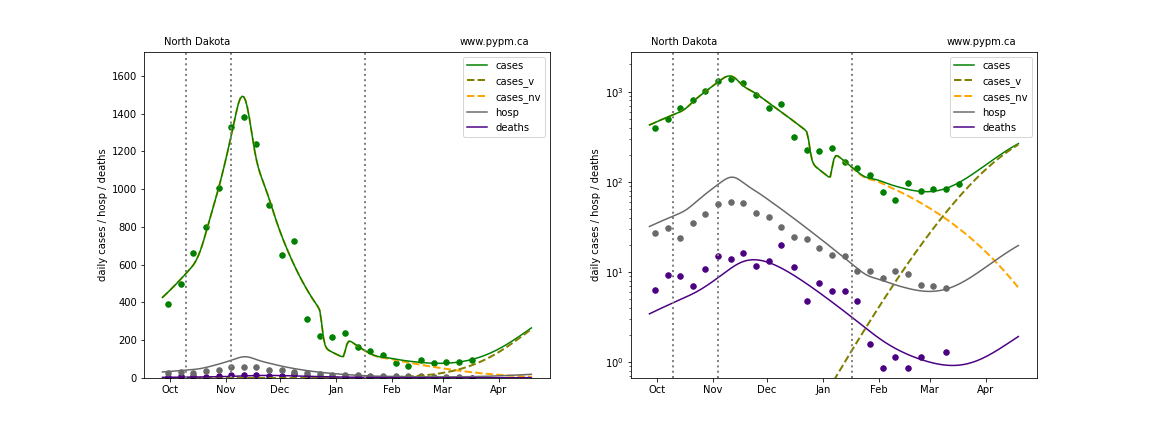
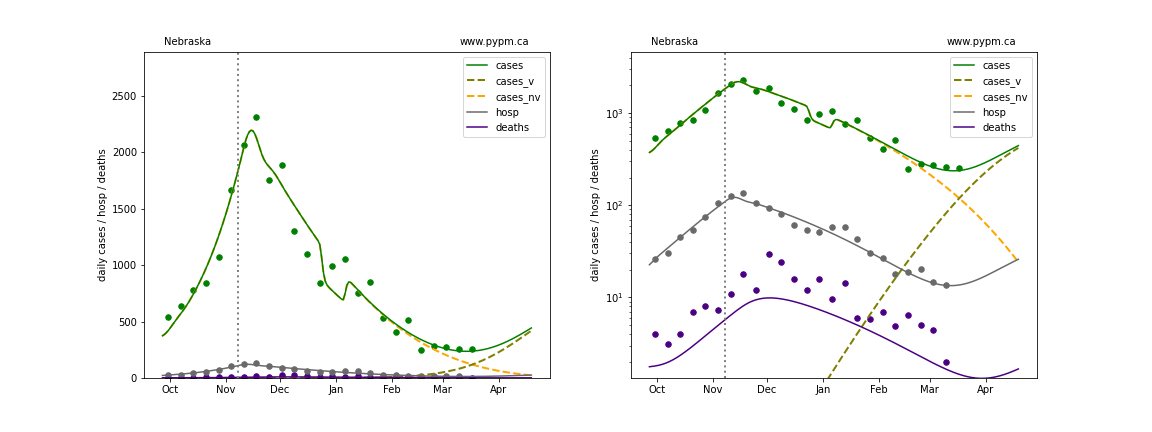
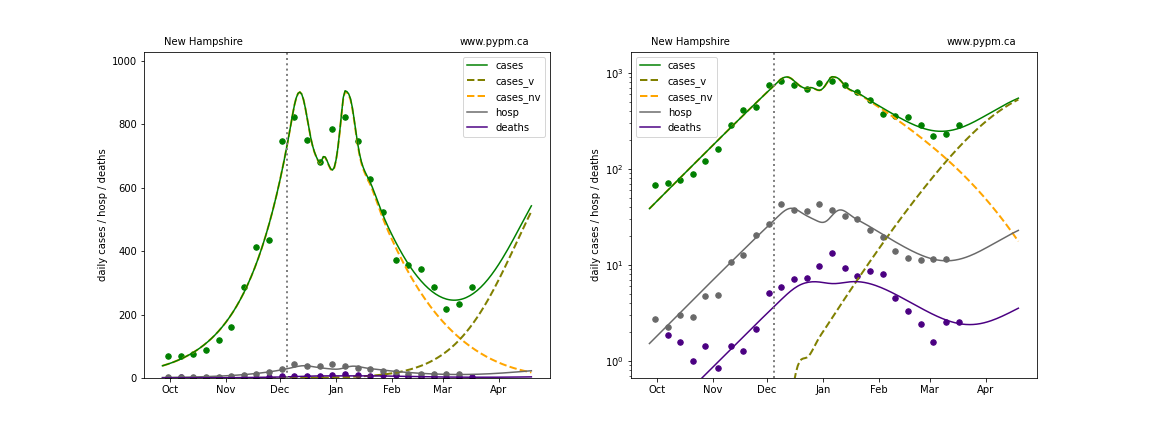
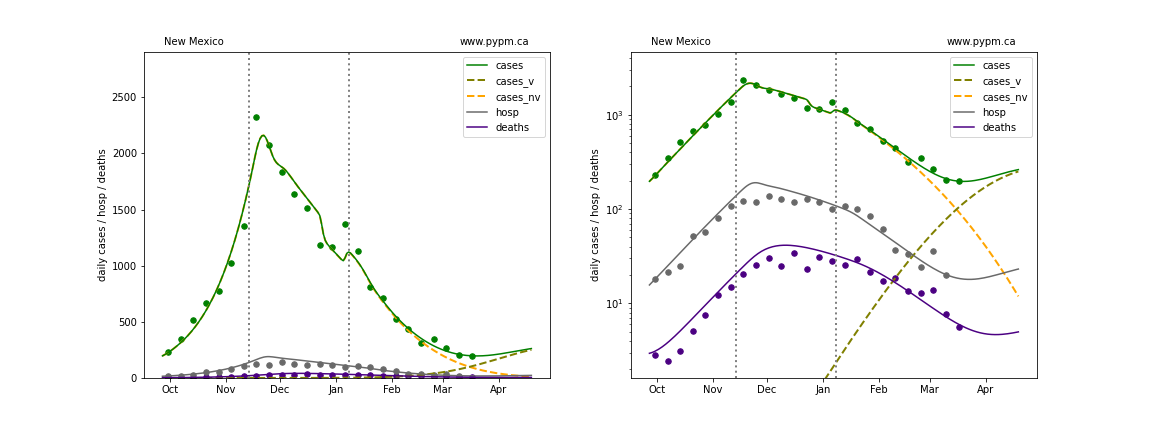
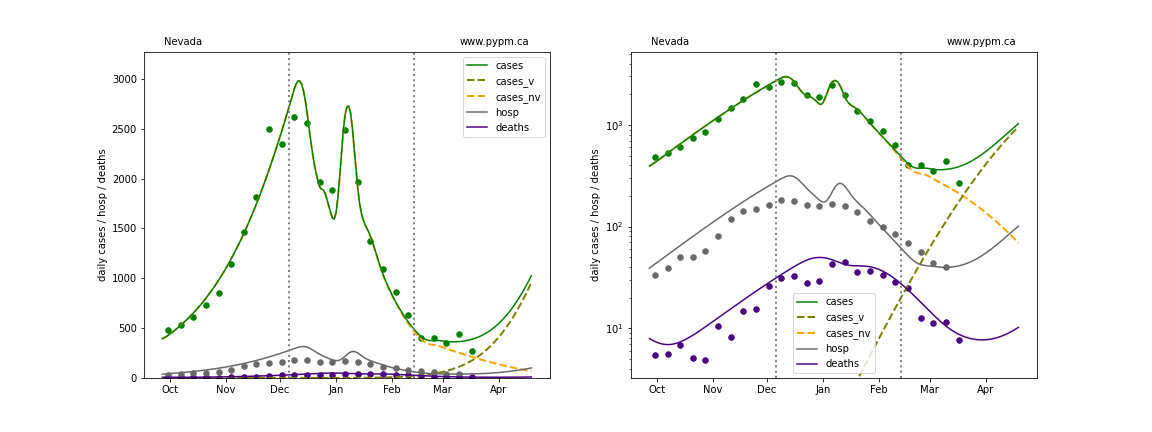
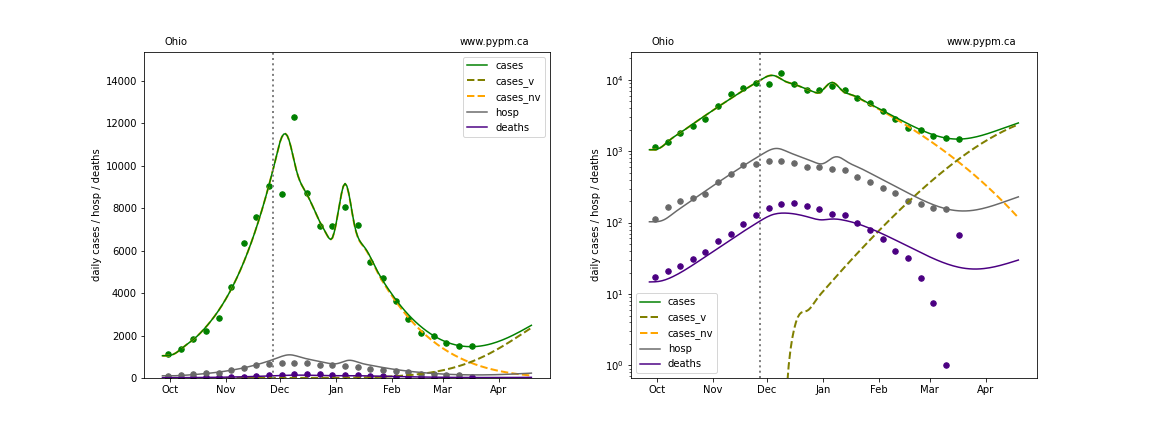
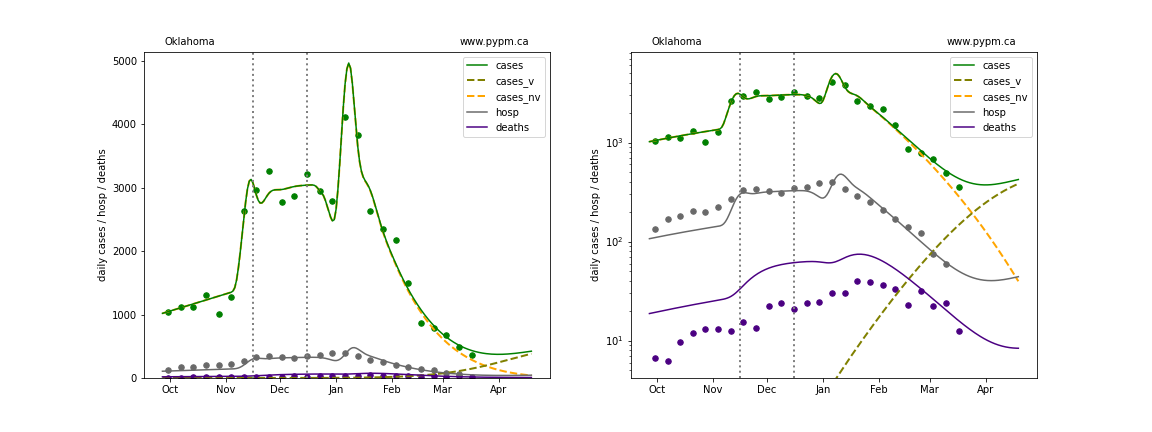
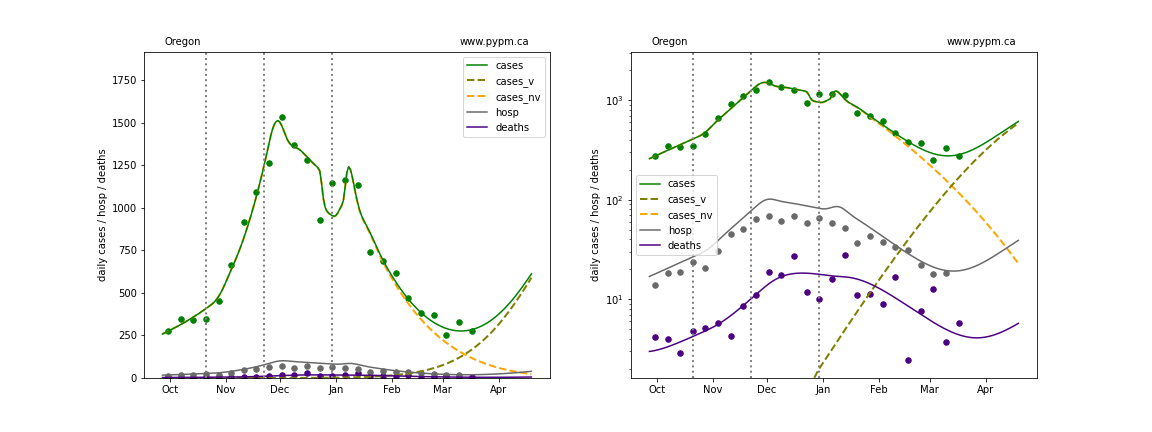
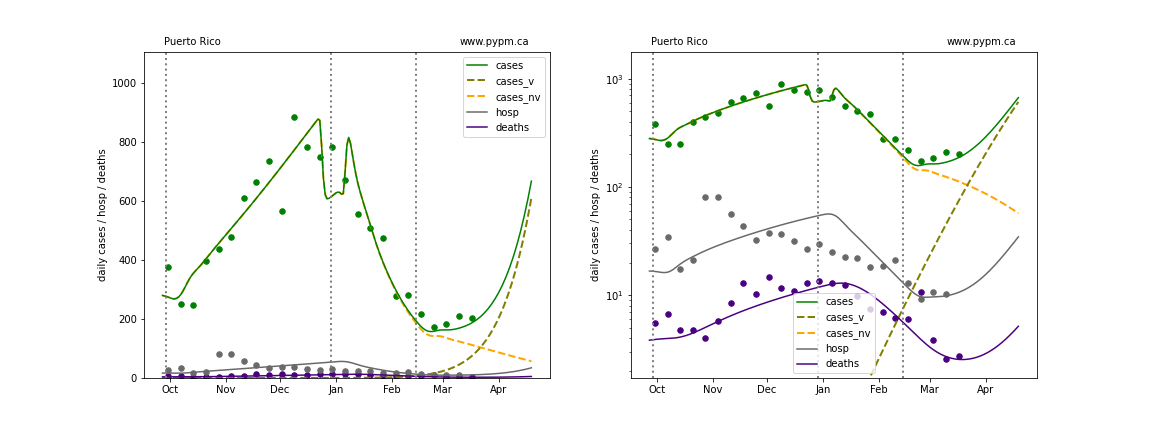
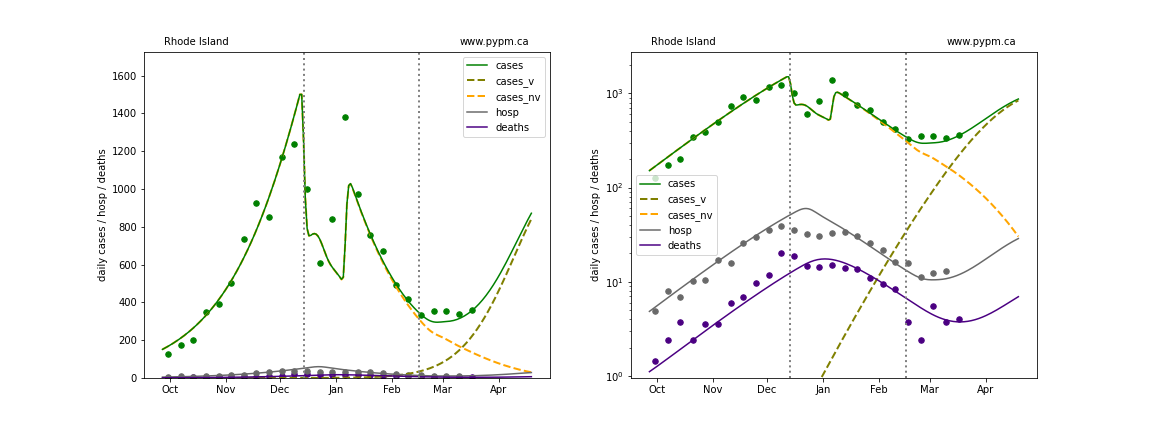
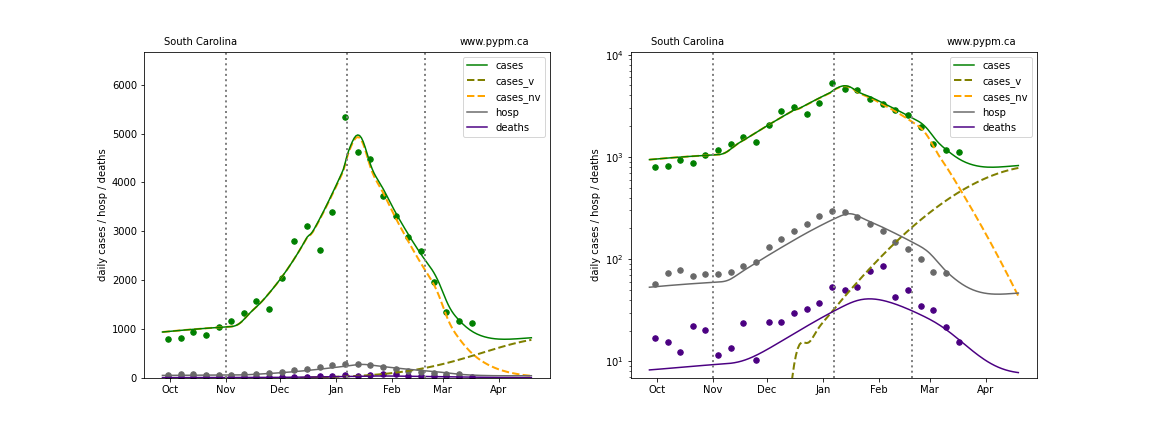
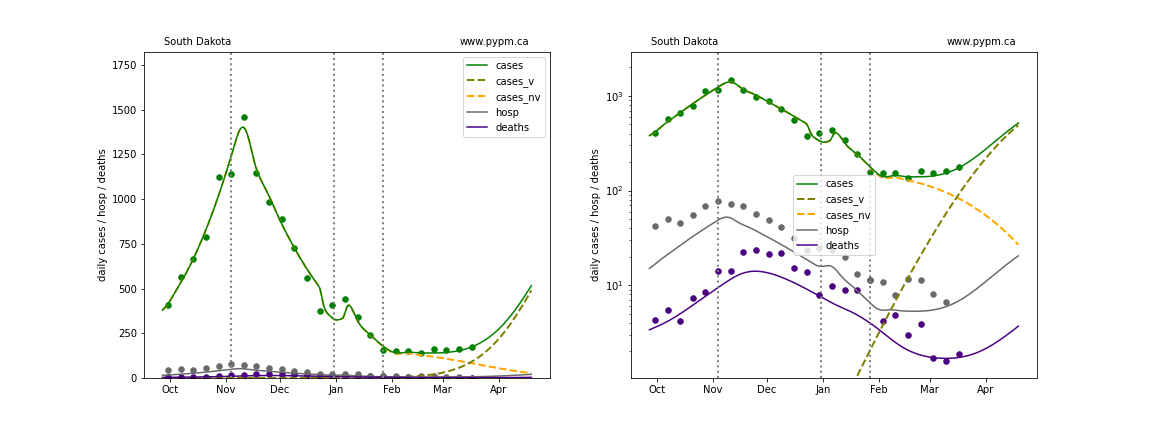
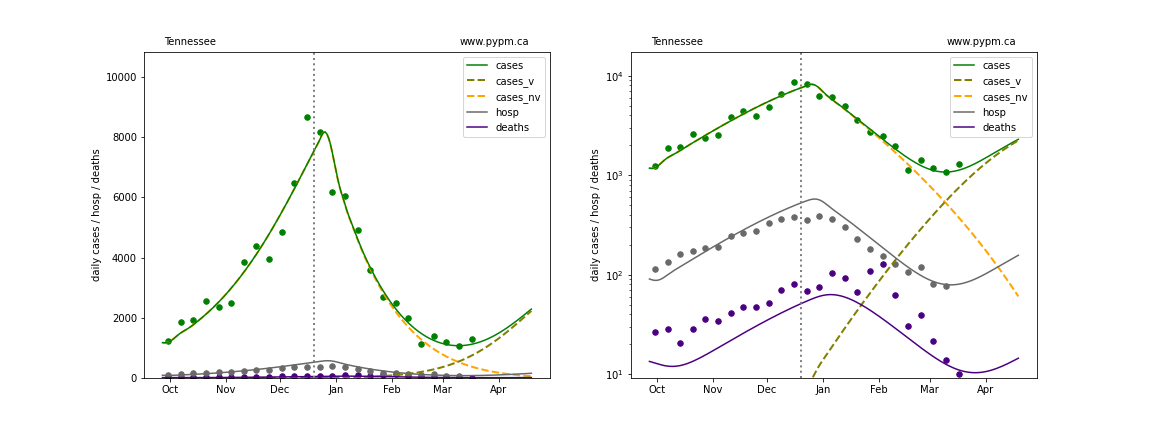
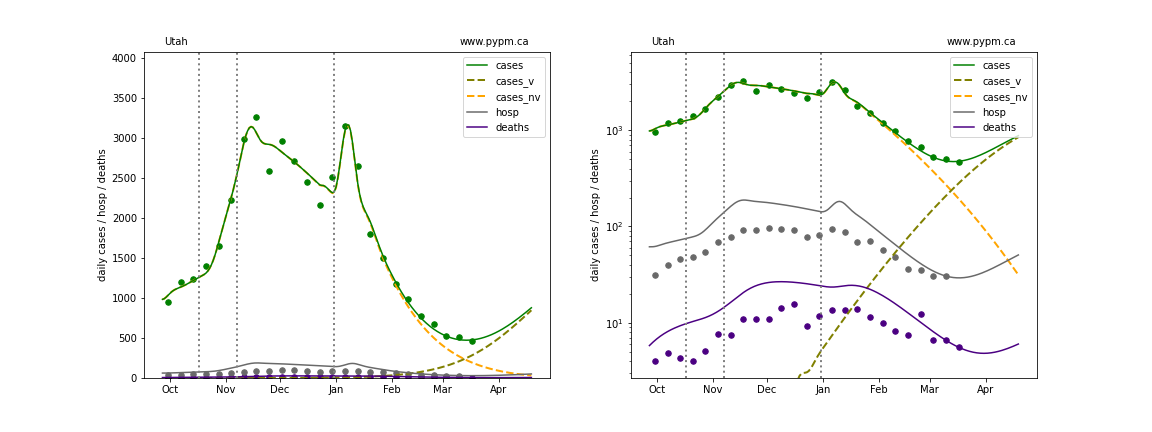
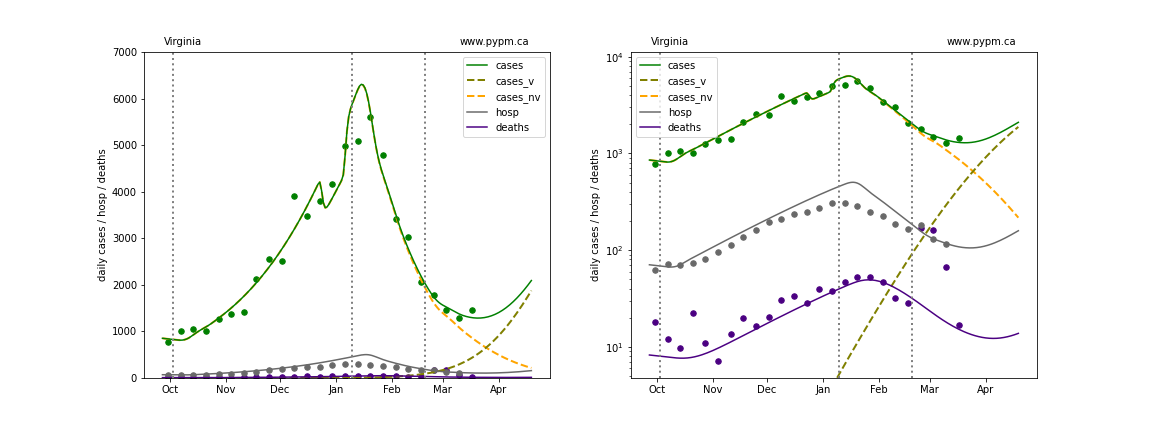
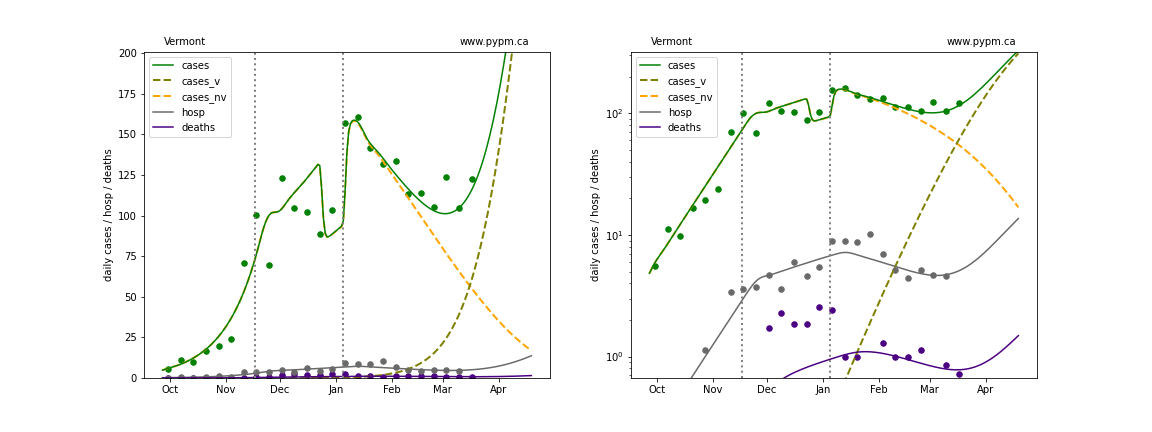
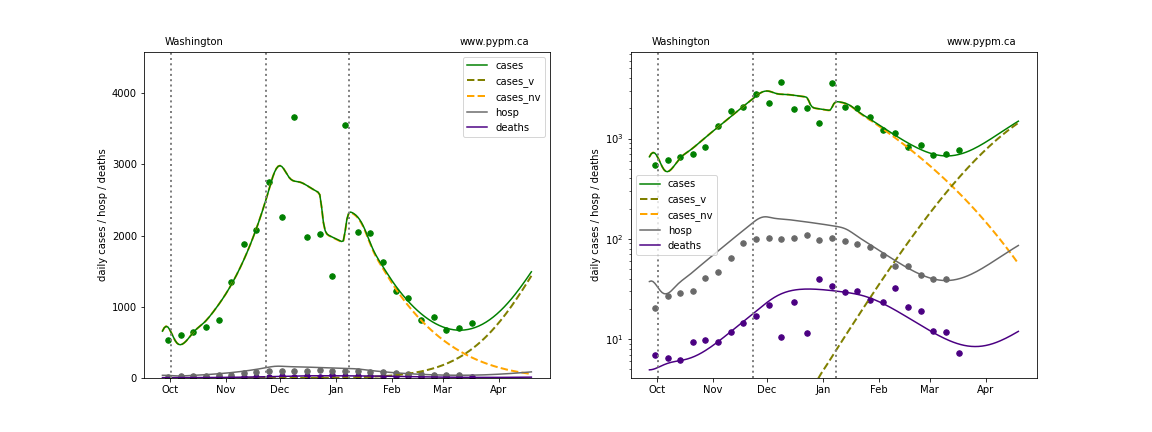
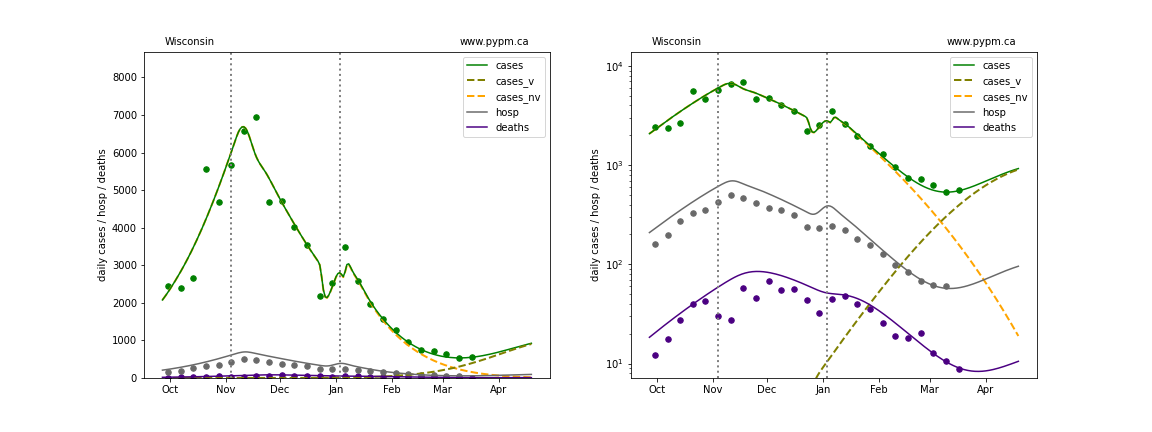
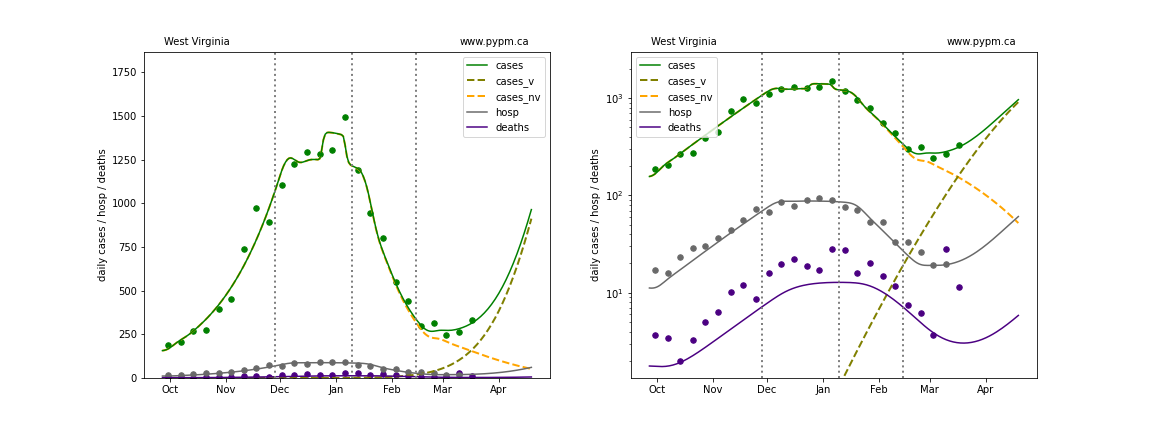
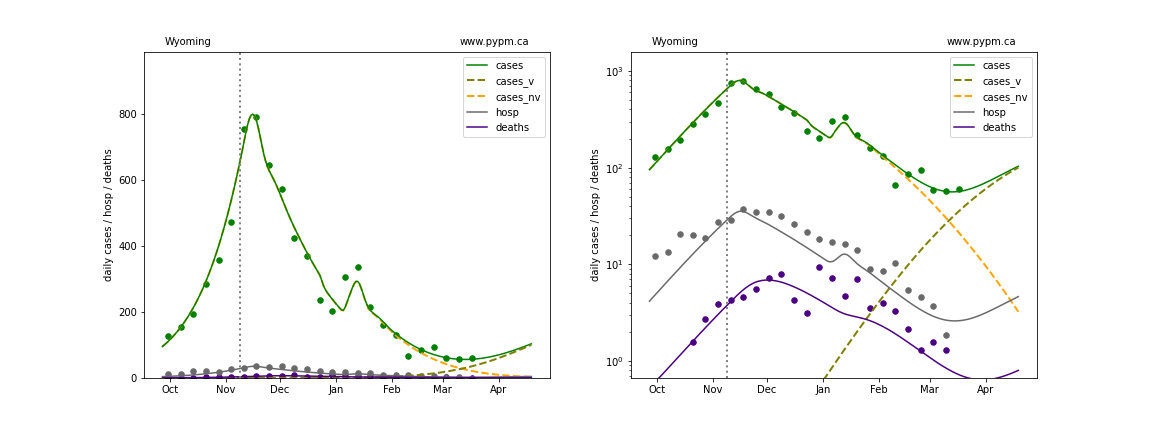
The green points are the daily cases, the grey points the daily hospitalizations, and indigo points are the daily deaths (each averaged over a week). The case data are used to define the periods for which transmission rate appears to be constant. The vertical lines show where the transmission rate is changed. In absence of immunity, constant transmission rates lead to steady exponential growth or decline during, which appear as straight lines on these log-scale plots. With immunity growing, these lines are no longer straight - bending downwards due to the herd effect. The curves are the model expectations for cases, hospitalizations, and deaths, as determined from the case data. The dashed curves separately show the reported cases from the original variant and the B117 variant.
Below the set of individual state plots, summary plots are provided that indicate the degree that natural and vaccination immunization is helping to bring down infections.
The final set of plots show the 4 week forecast for the USA and for each state.
Genomic data
For some staes, genomic screening data is available to estimate the growth advantage (aka selection coefficient, s) of the B117 variant as well as the current fraction of cases dues to that variant.
Below is a figure showing fits to the ratio of the SGTF cases to non-SGTF cases used to estimate the selection coefficient and current “frequency” of these cases.
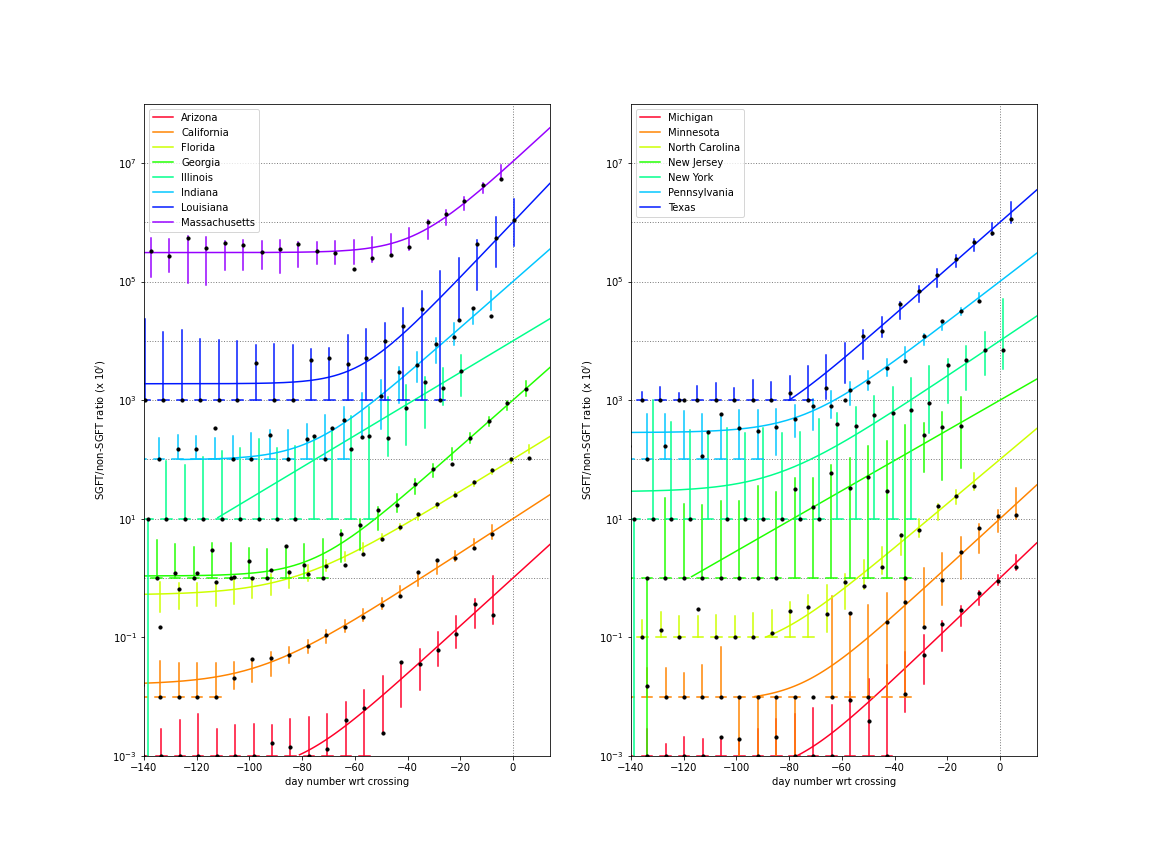
| State | s | w | f_v (Mar 20) |
|---|---|---|---|
| Arizona | 0.093 +/- 0.008 | 0.001 +/- 0.000 | 0.467 +/- 0.065 |
| California | 0.066 +/- 0.002 | 0.002 +/- 0.000 | 0.469 +/- 0.018 |
| Florida | 0.063 +/- 0.001 | 0.005 +/- 0.000 | 0.683 +/- 0.009 |
| Georgia | 0.090 +/- 0.003 | 0.001 +/- 0.000 | 0.727 +/- 0.017 |
| Illinois | 0.061 +/- 0.007 | 0.000 +/- 0.000 | 0.304 +/- 0.056 |
| Indiana | 0.090 +/- 0.005 | 0.001 +/- 0.000 | 0.450 +/- 0.034 |
| Louisiana | 0.107 +/- 0.020 | 0.002 +/- 0.001 | 0.665 +/- 0.099 |
| Massachusetts | 0.095 +/- 0.007 | 0.030 +/- 0.002 | 0.538 +/- 0.033 |
| Michigan | 0.098 +/- 0.005 | 0.000 +/- 0.000 | 0.766 +/- 0.019 |
| Minnesota | 0.094 +/- 0.010 | 0.001 +/- 0.000 | 0.757 +/- 0.042 |
| North Carolina | 0.086 +/- 0.005 | 0.001 +/- 0.000 | 0.422 +/- 0.031 |
| New Jersey | 0.059 +/- 0.010 | 0.000 +/- 0.001 | 0.372 +/- 0.084 |
| New York | 0.069 +/- 0.011 | 0.003 +/- 0.003 | 0.622 +/- 0.080 |
| Pennsylvania | 0.079 +/- 0.003 | 0.003 +/- 0.000 | 0.462 +/- 0.018 |
| Texas | 0.090 +/- 0.003 | 0.000 +/- 0.000 | 0.714 +/- 0.021 |
- s: selection coefficient
- w: SGTF false identification probability
- f_v: fraction of cases due to the variant on March 20, 2021
States with genomic data
The states with independent genomic data allow for better constraint on the growth advantage and current case fraction. With the variant potentially causing growth in the weeks to come, predictions for these states are much better established.
Arizona
California
Florida
Georgia
Illinois
Indiana
Louisiana
Massachusetts
Michigan
Minnesota
North Carolina
New Jersey
New York
Pennsylvania
Texas
States without genomic data
In absence of genomic data, the growth advantage s = 0.08 is assumed. The current strength of the B117 is estimated from the fit to case data. Essentially this is derived by how fare the case data deviate from the expected trajectory for the original strain model (orange dashed curve). For states where the deviation is just beginning, there will be significant uncertainty on the timing of the next peak.
These model fits assume that there is no change to NPI (non-pharmiceutical intervention) between the vertical dotted lines. Such NPI changes can lead to large changes in the projections for the future growth of the variant.
Alaska
Alabama
Arkansas
Colorado
Connecticut
District Of Columbia
Delaware
Hawaii
Iowa
Idaho
Kansas
Kentucky
Maryland
Maine
Missouri
Mississippi
Montana
North Dakota
Nebraska
New Hampshire
New Mexico
Nevada
Ohio
Oklahoma
Oregon
Puerto Rico
Rhode Island
South Carolina
South Dakota
Tennessee
Utah
Virginia
Vermont
Washington
Wisconsin
West Virginia
Wyoming
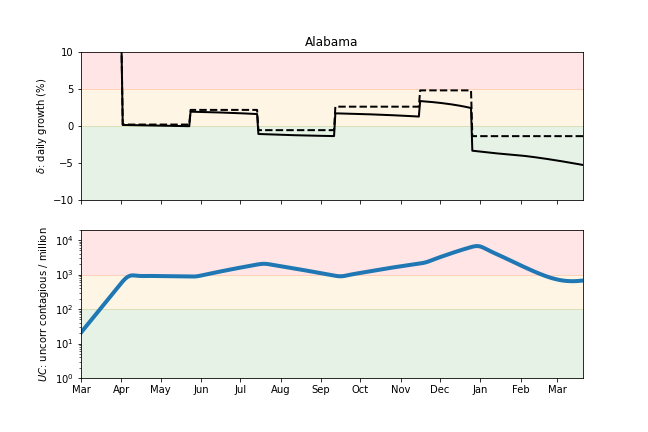
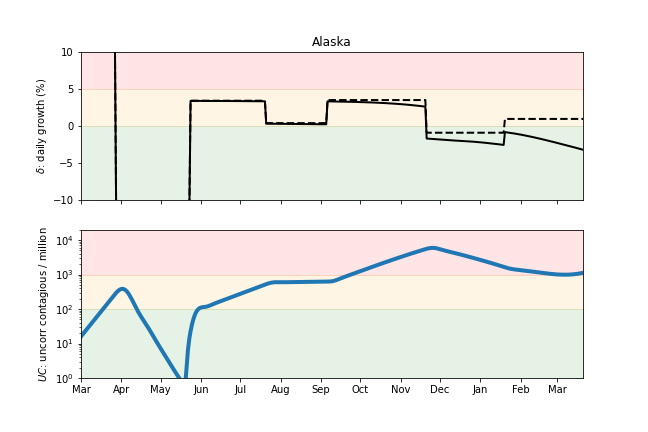
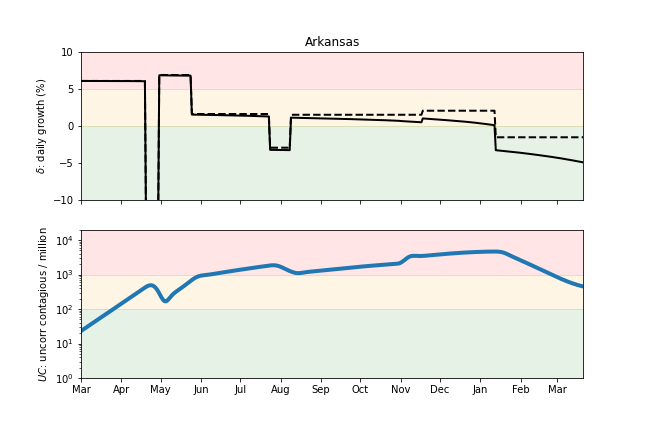
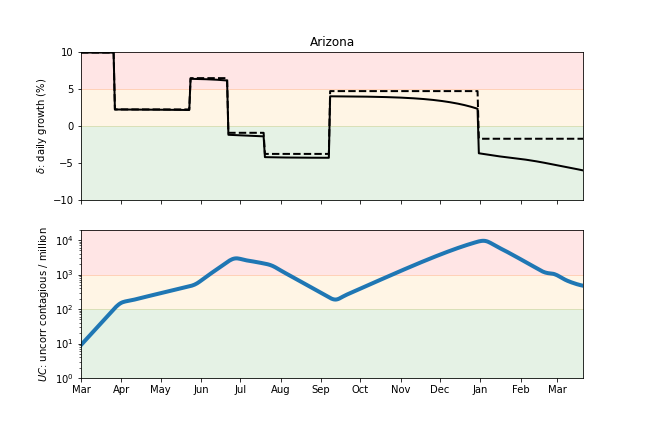
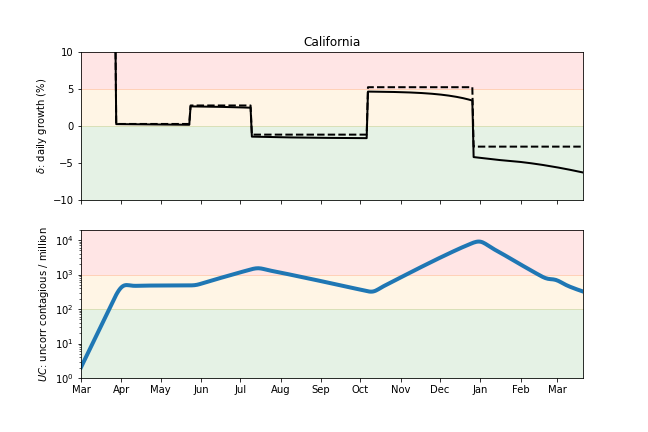
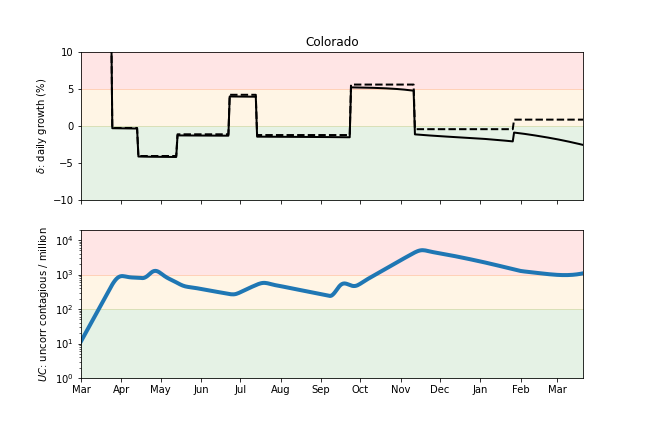
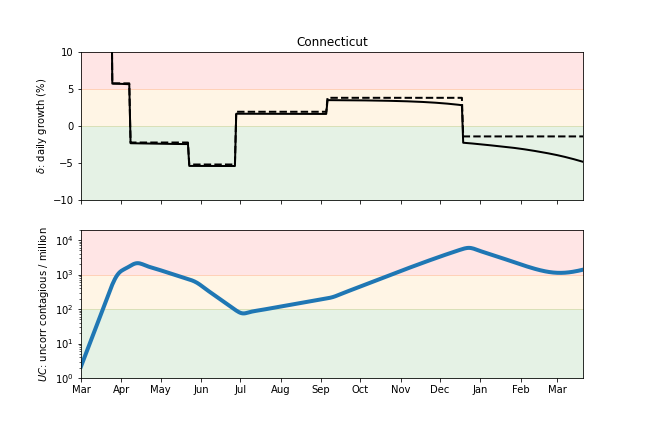
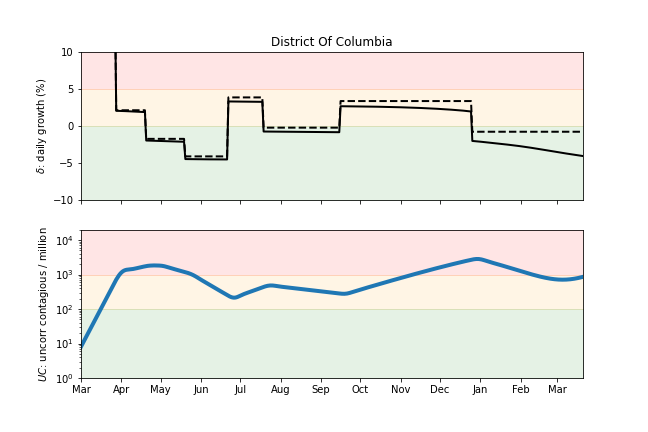
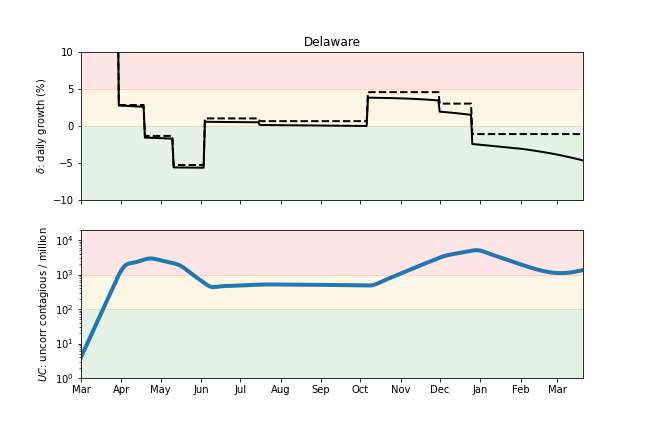
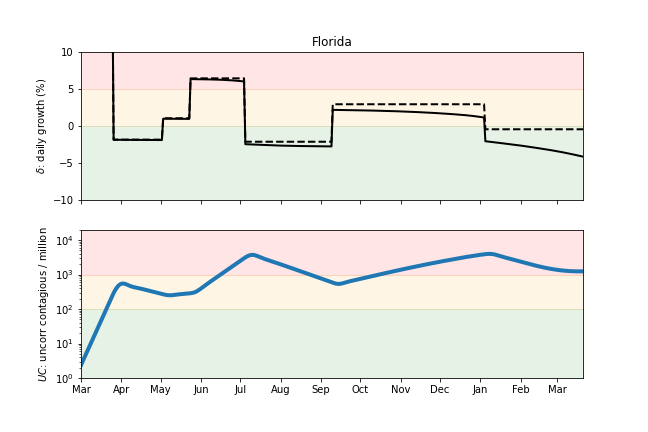
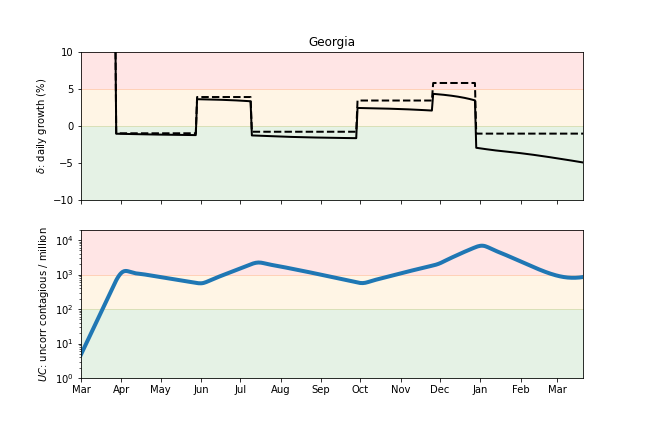
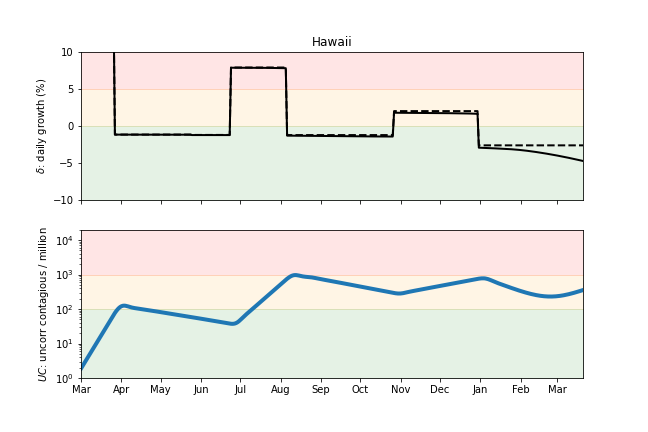
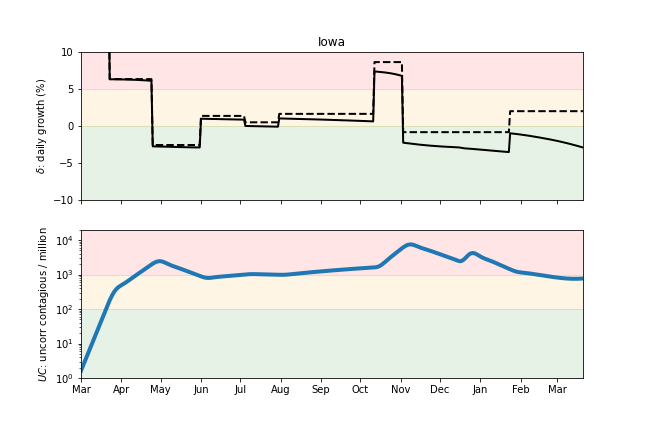
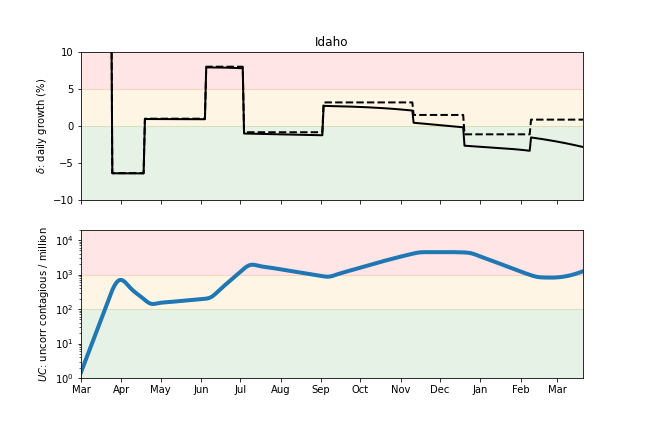
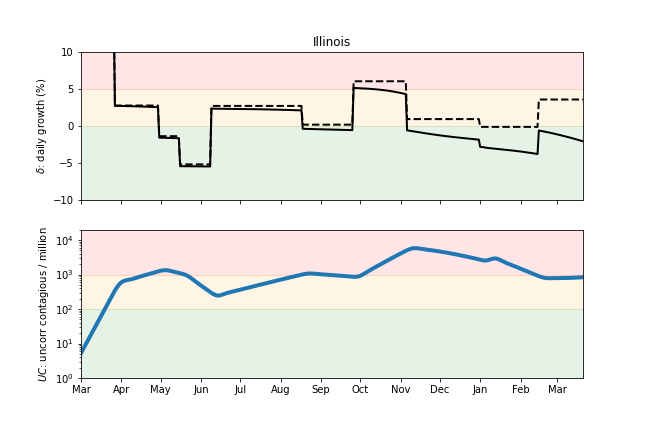
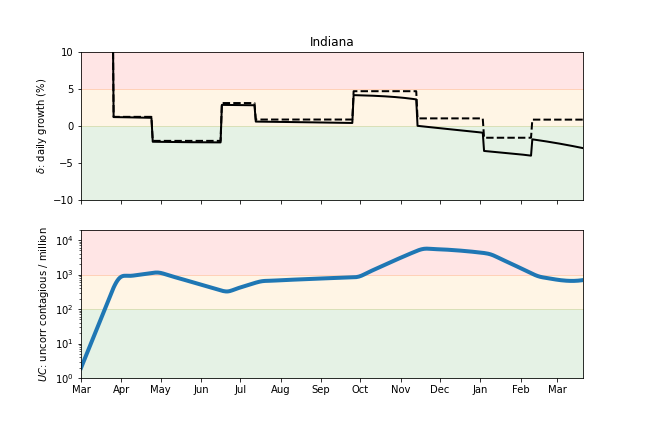
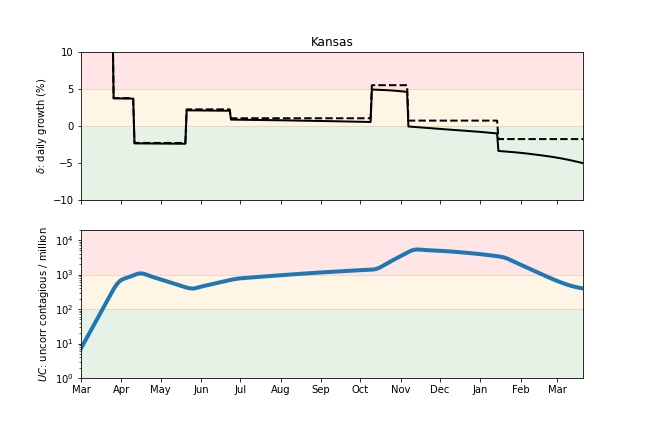
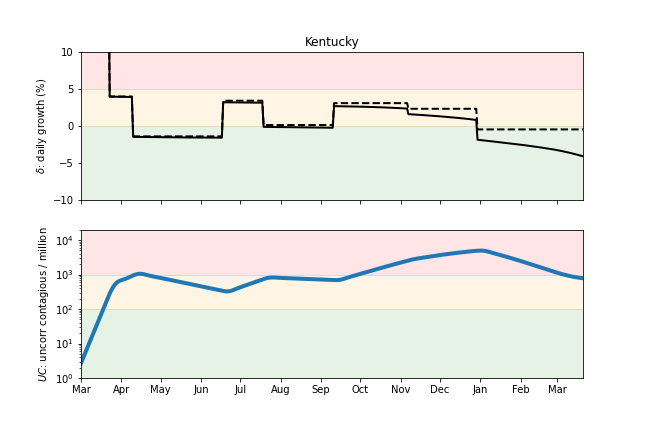
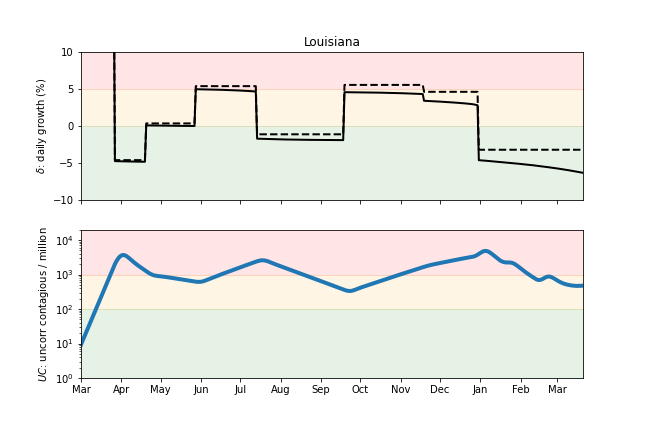
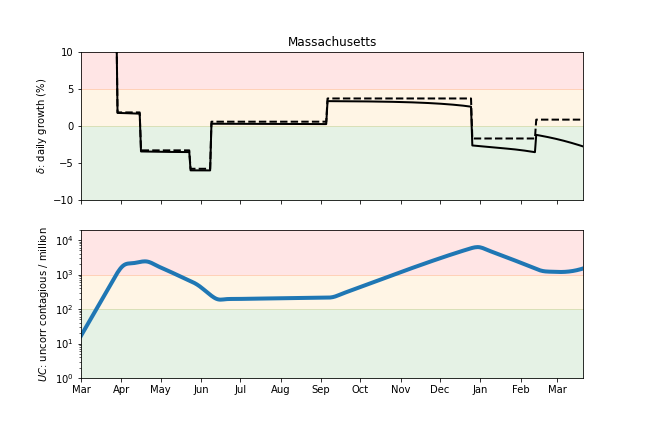
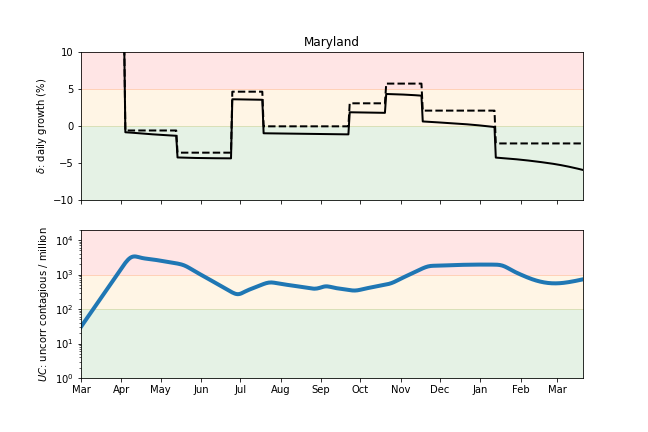
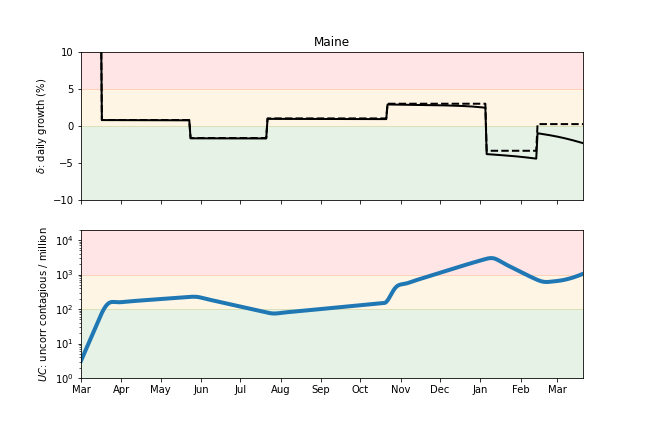
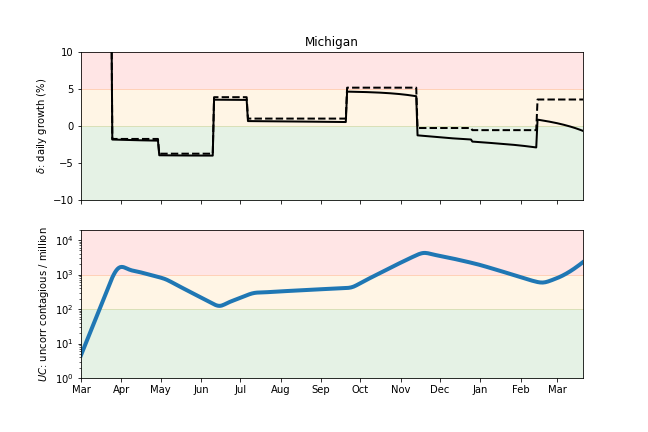
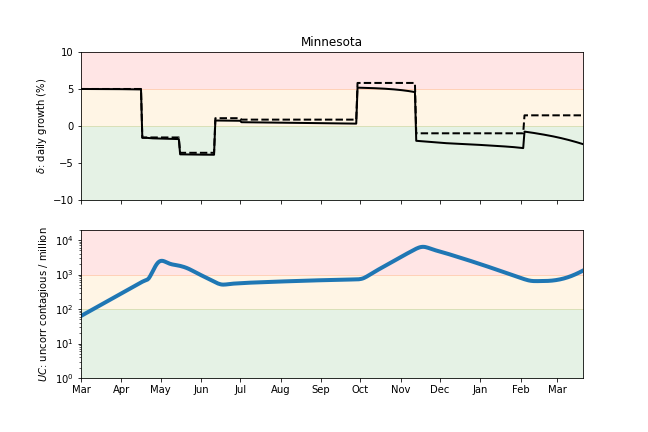
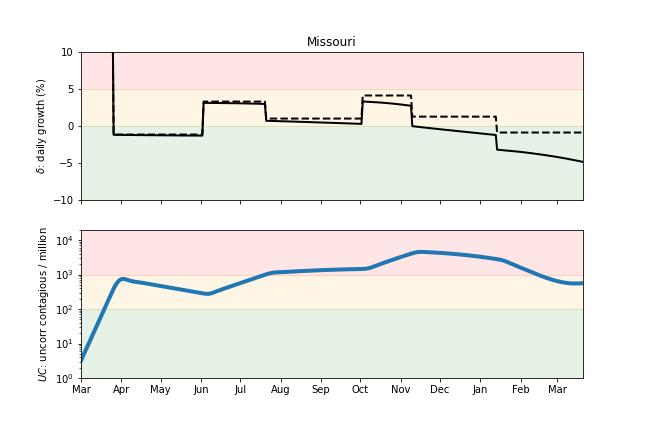
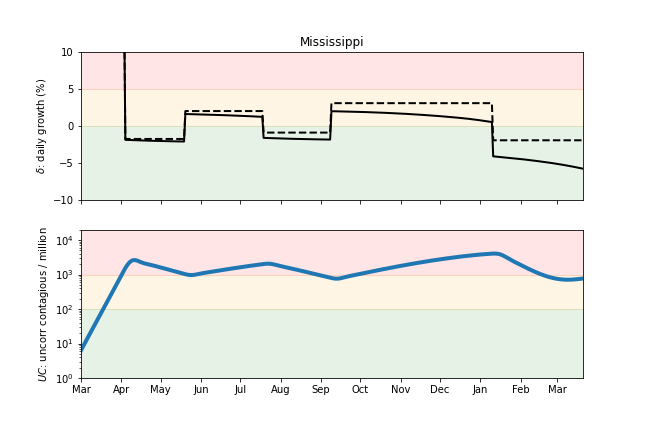
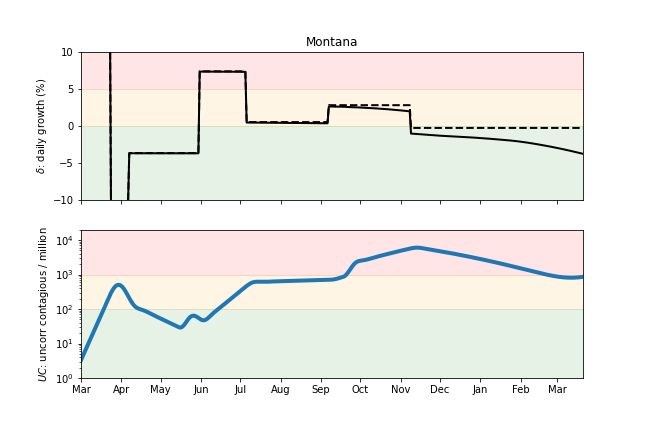
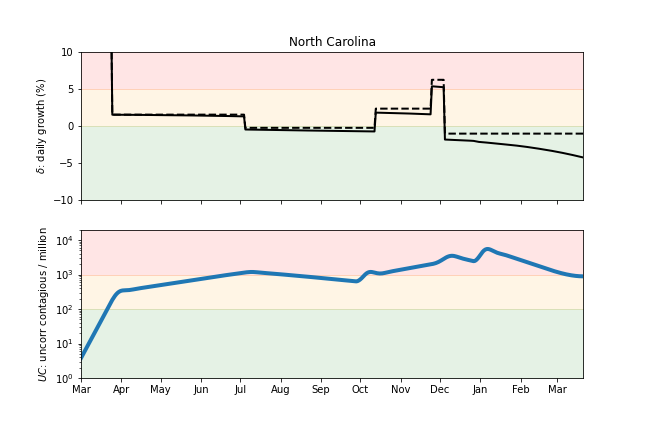
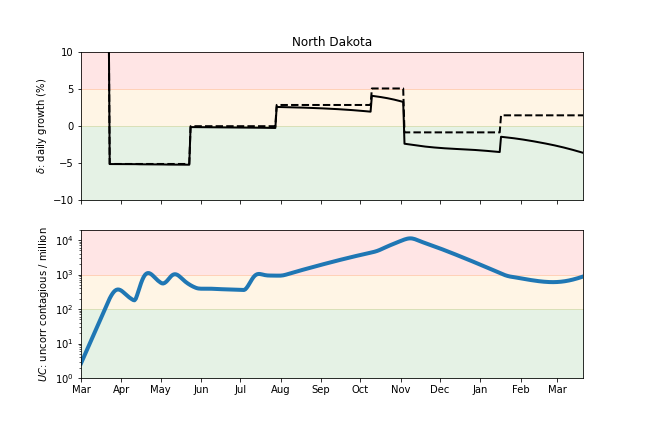
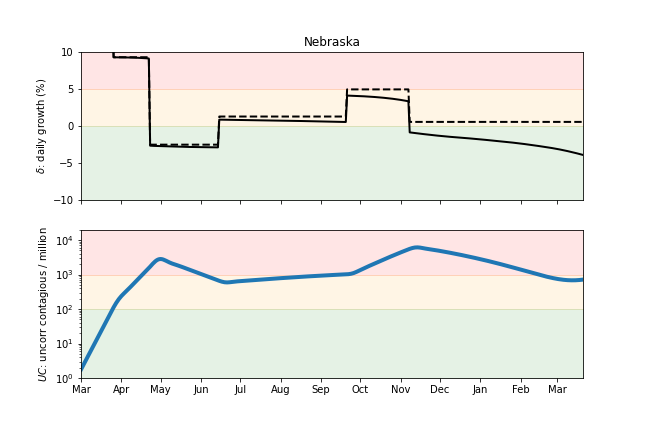
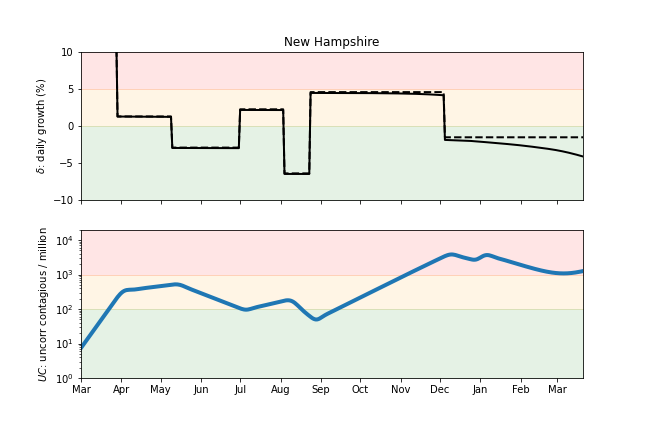
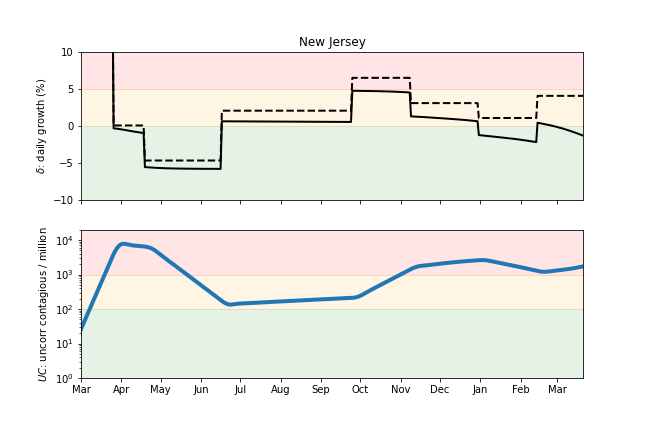
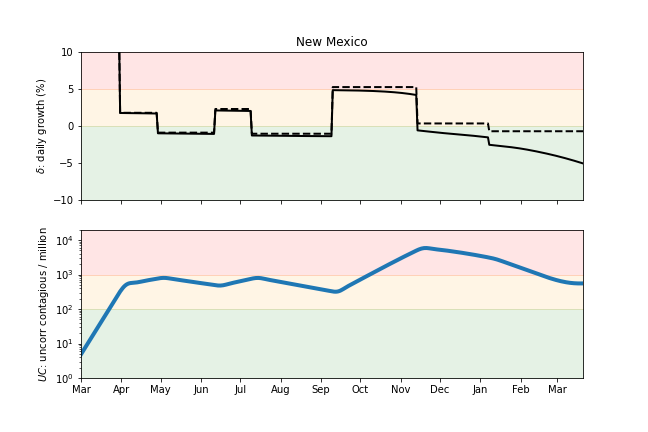
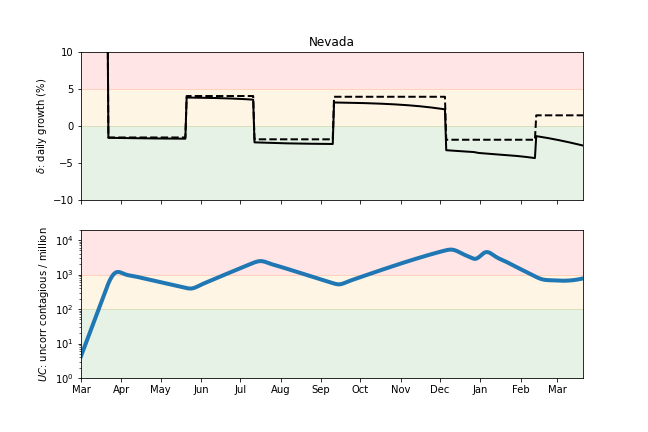
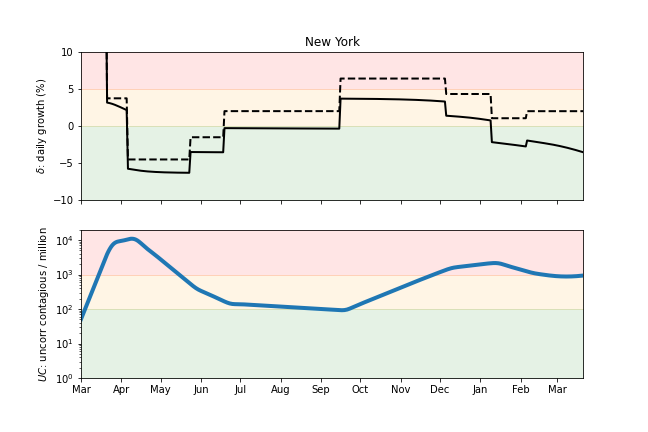
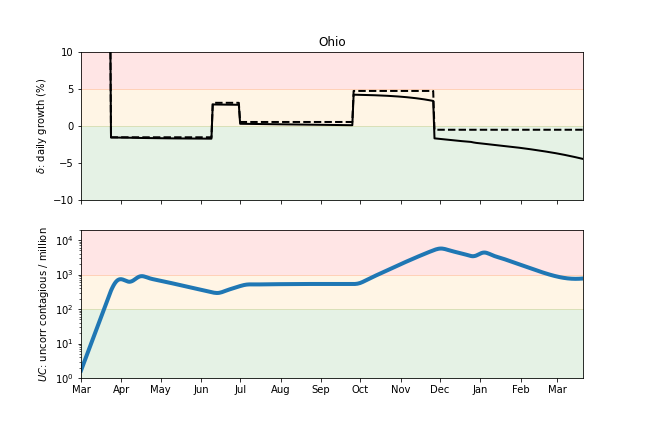
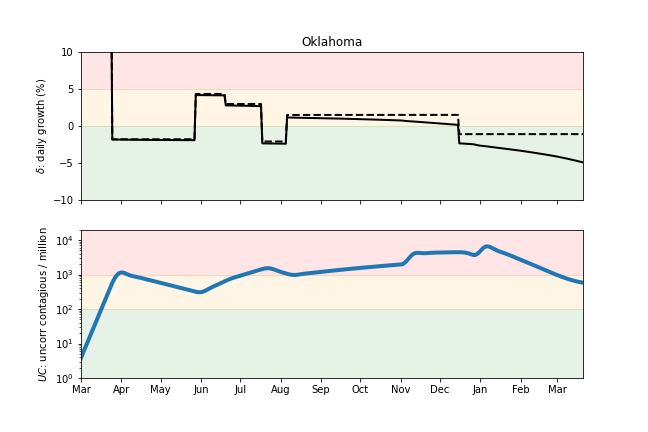
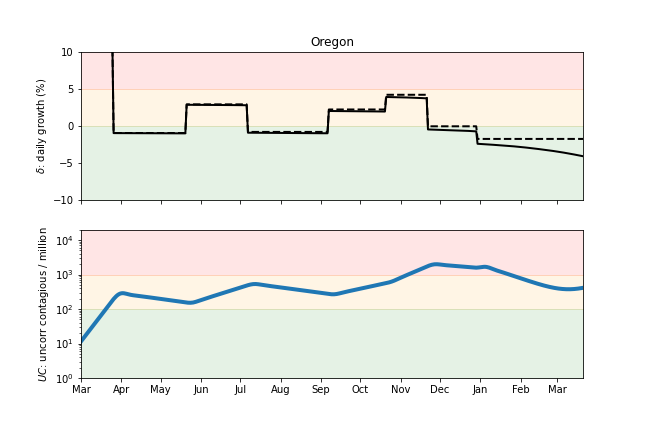
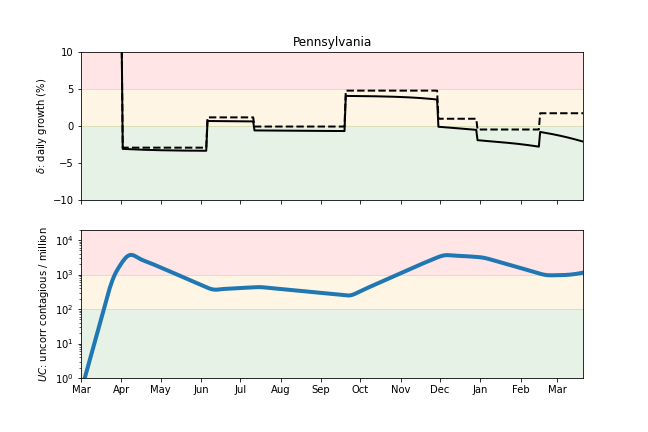
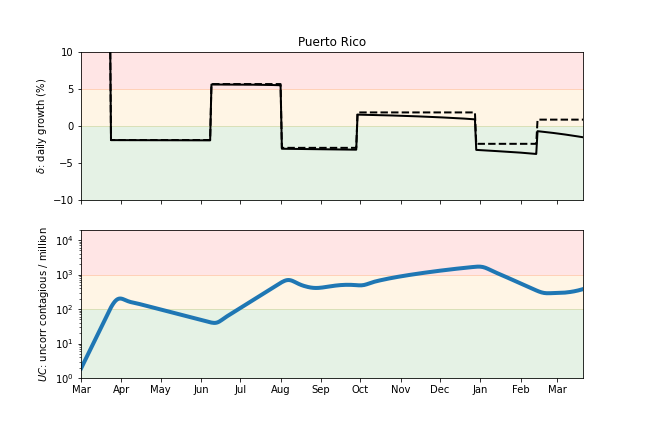
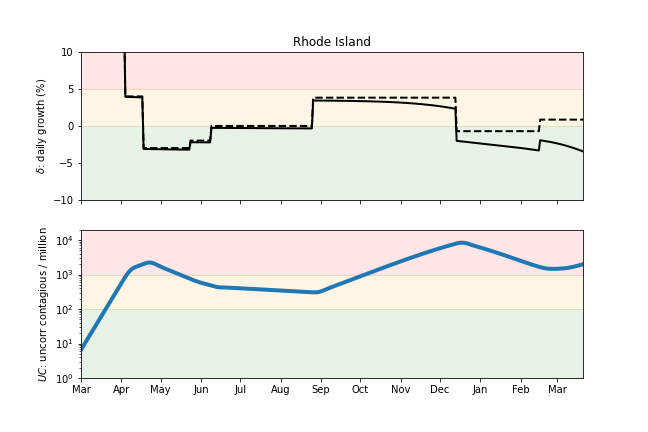
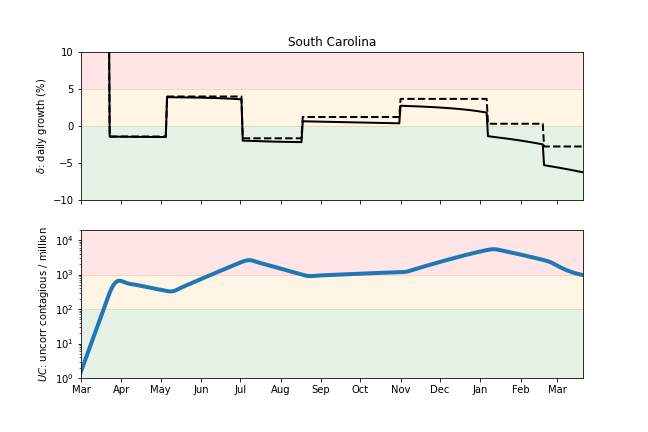
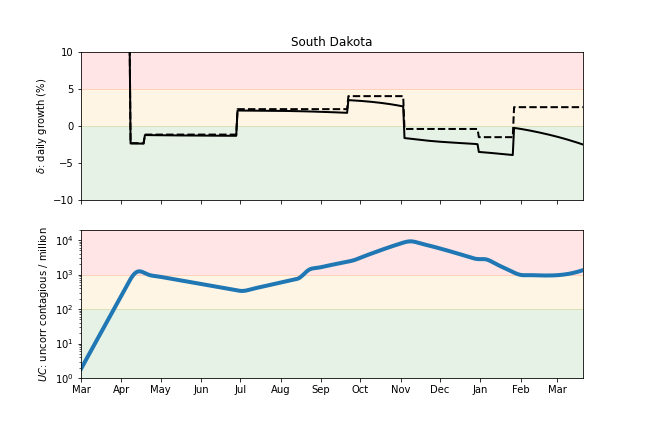
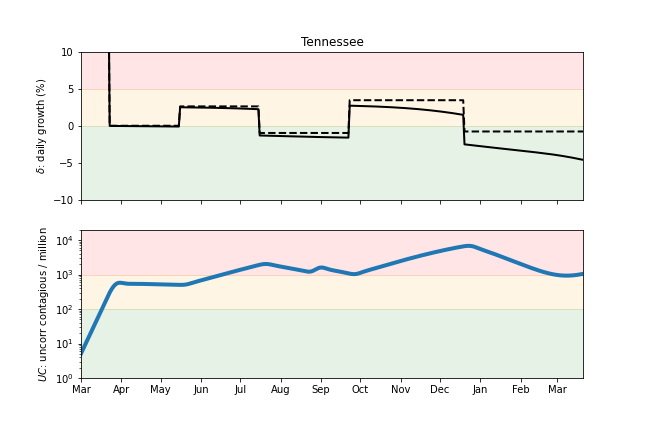
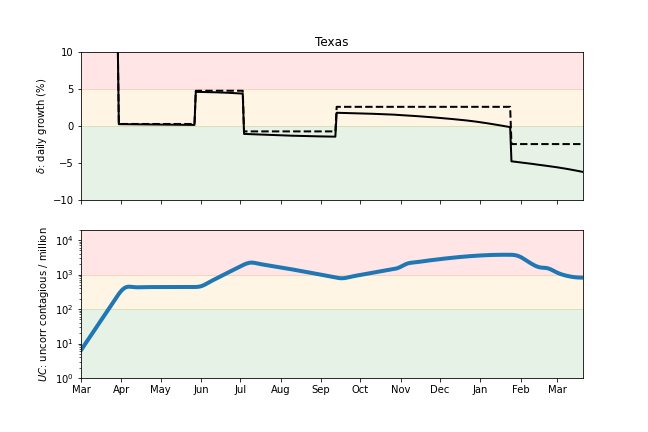
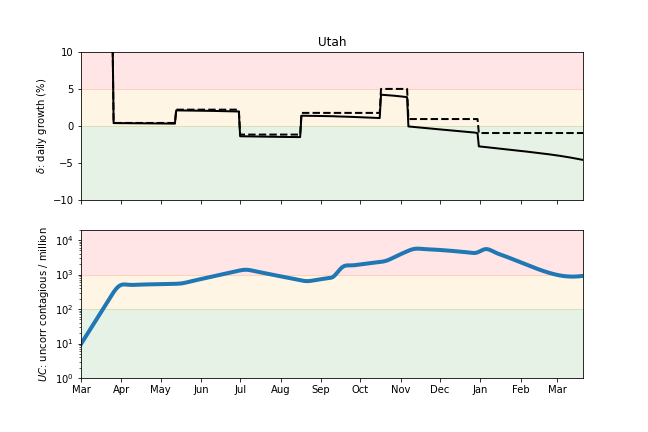
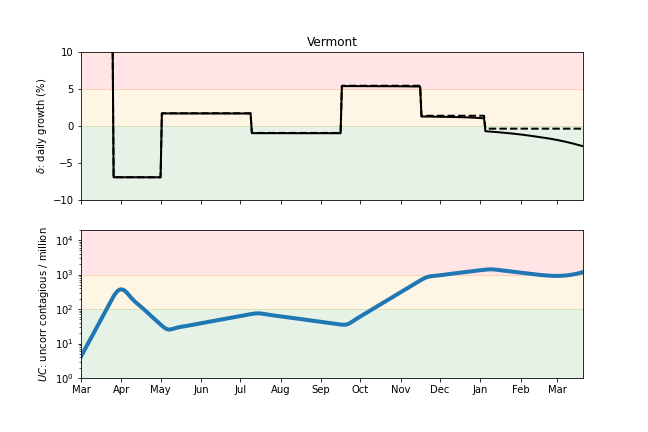
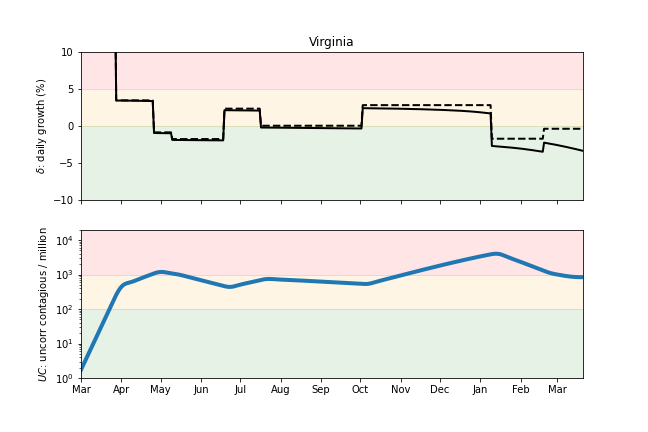
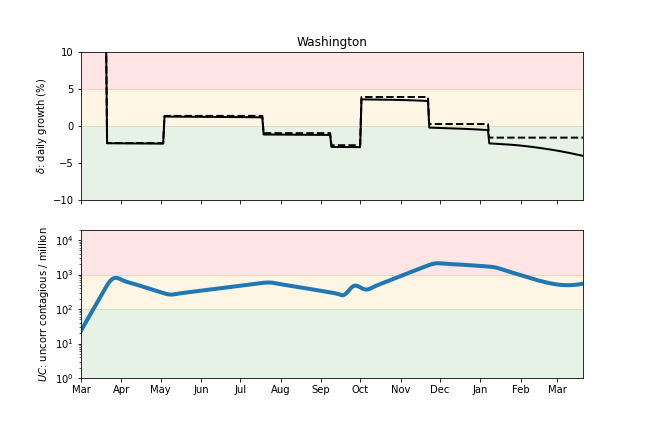
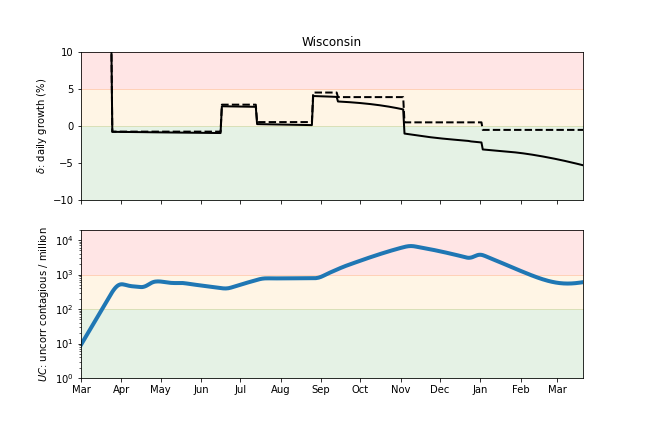
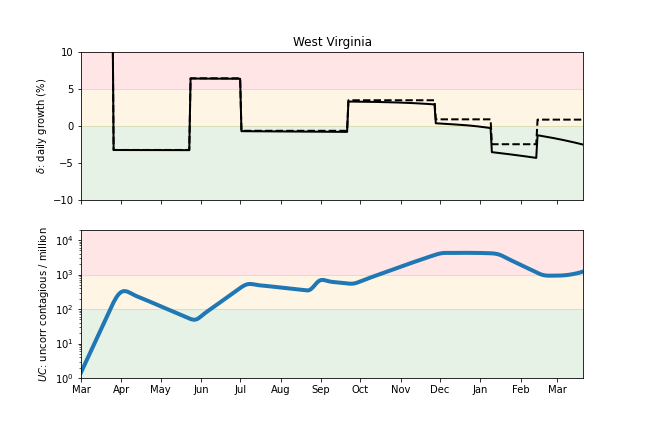
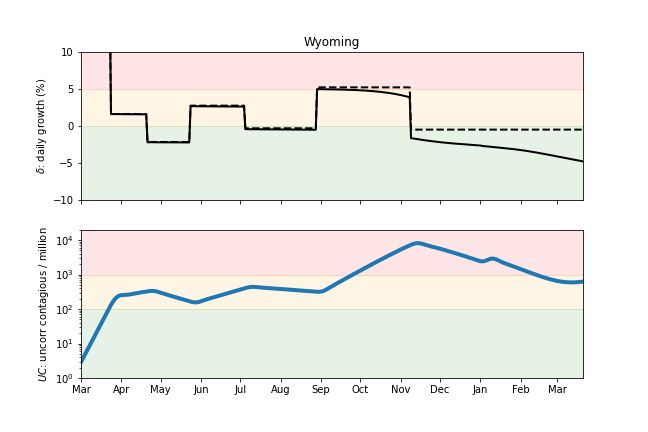
Summary of growth rates (with and without immunity)
The following plots summarize the infection history. The upper plot shows the daily growth/decline of infections (% per day) for the orginal strain. The dashed curve are the growths that would have been experienced in absense of immunity. Natural immunity built up during the course of the epidemic has helped reduce infections and this is now being overtaken by vaccine immunity in many of the states. Note that the daily growth rate for the B117 variant is typically 8% more than that of the original strain.
The lower plot shows an estimate of the contagious fraction of the population as a function of time.
Alabama
Alaska
Arkansas
Arizona
California
Colorado
Connecticut
District Of Columbia
Delaware
Florida
Georgia
Hawaii
Iowa
Idaho
Illinois
Indiana
Kansas
Kentucky
Louisiana
Massachusetts
Maryland
Maine
Michigan
Minnesota
Missouri
Mississippi
Montana
North Carolina
North Dakota
Nebraska
New Hampshire
New Jersey
New Mexico
Nevada
New York
Ohio
Oklahoma
Oregon
Pennsylvania
Puerto Rico
Rhode Island
South Carolina
South Dakota
Tennessee
Texas
Utah
Vermont
Virginia
Washington
Wisconsin
West Virginia
Wyoming
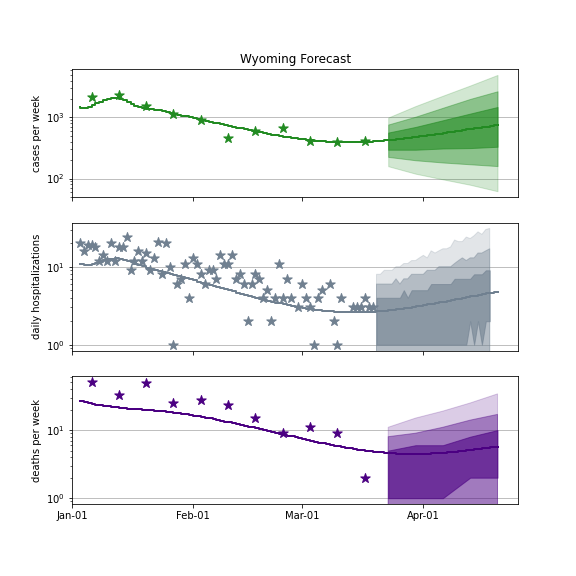
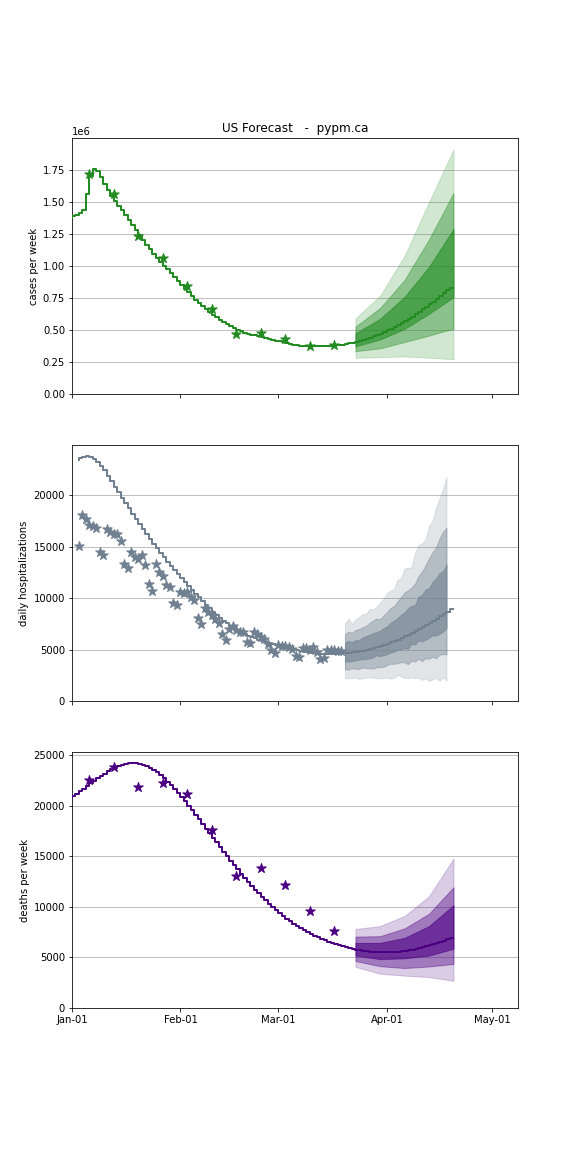
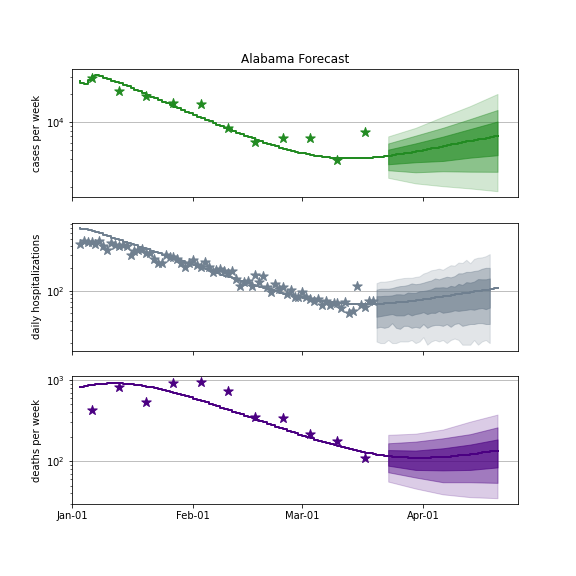
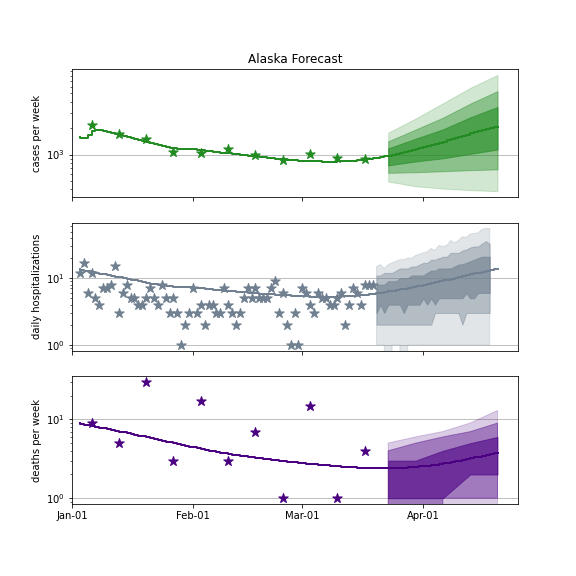
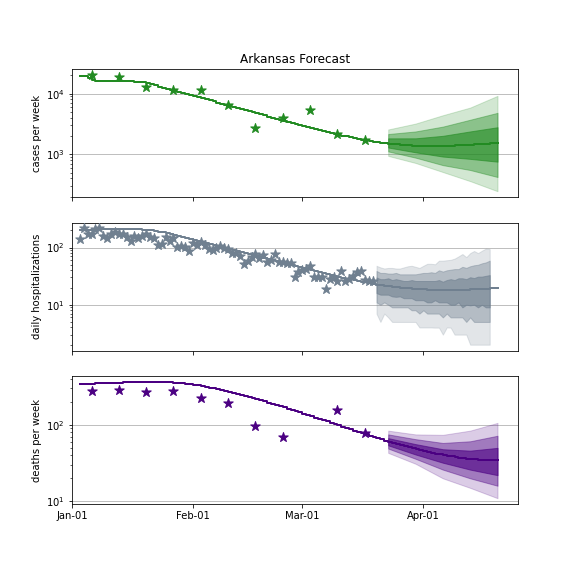
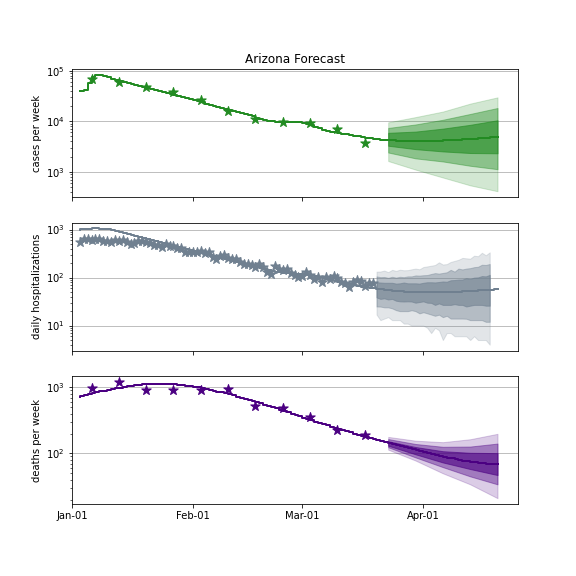
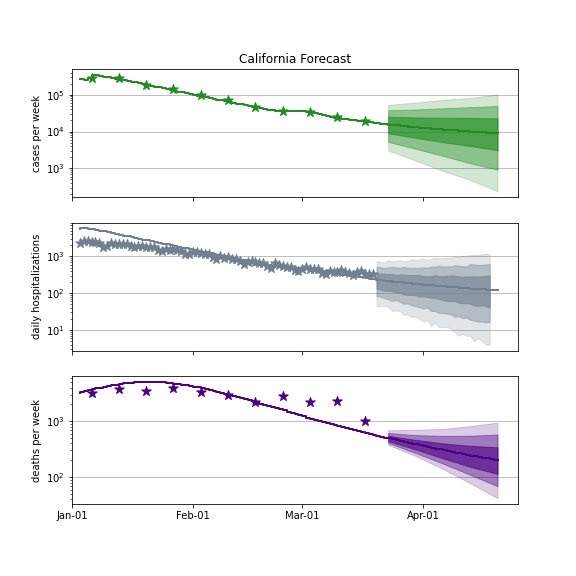
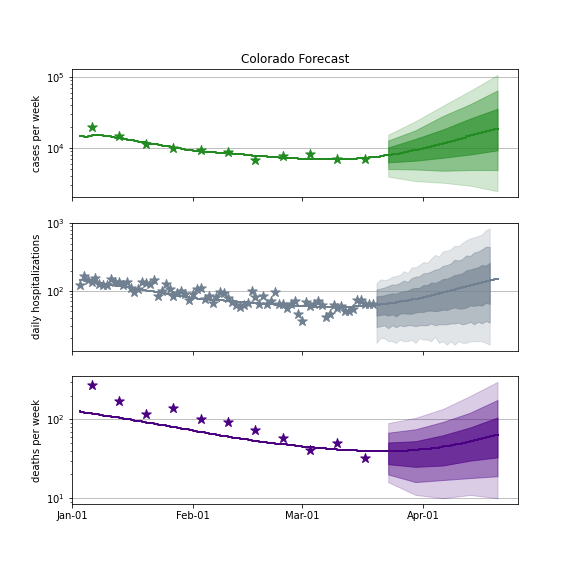
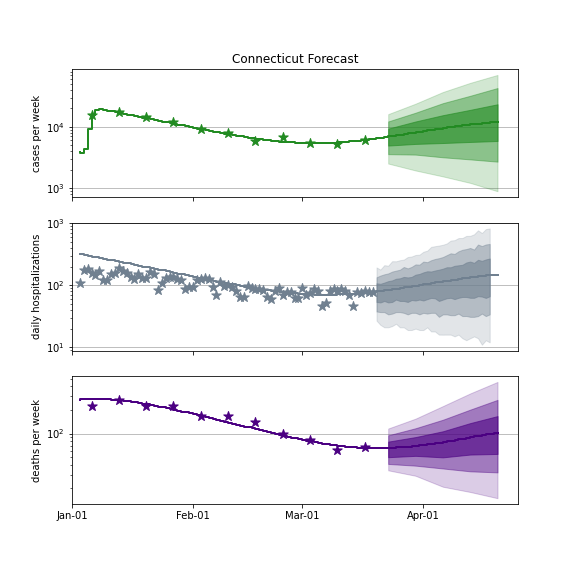
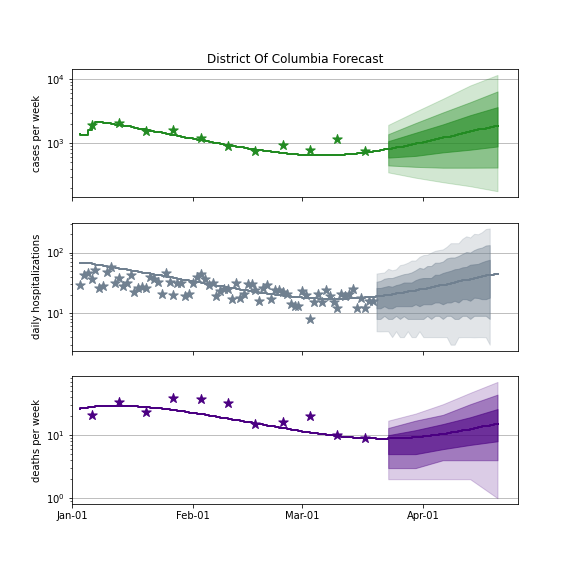
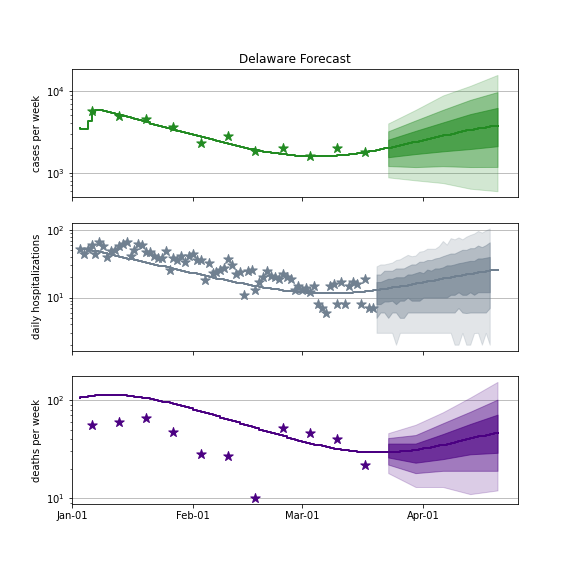
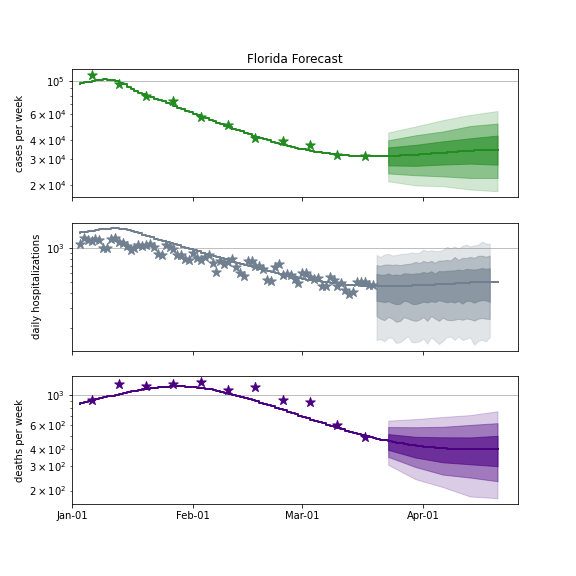
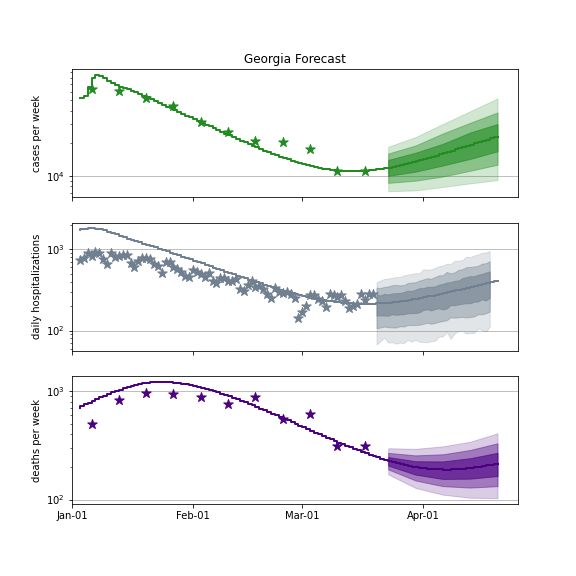
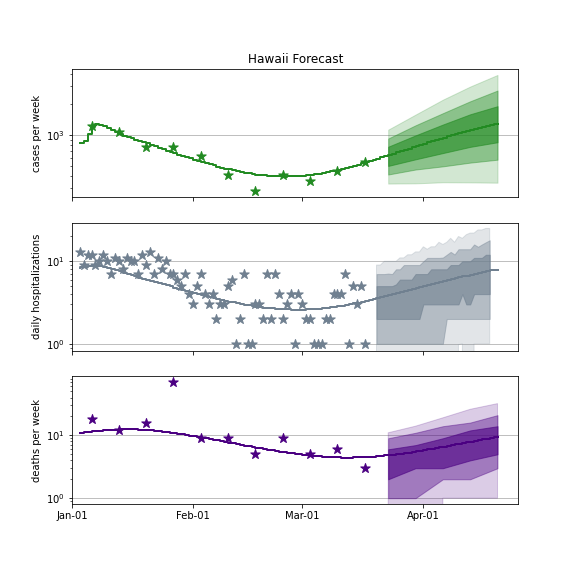
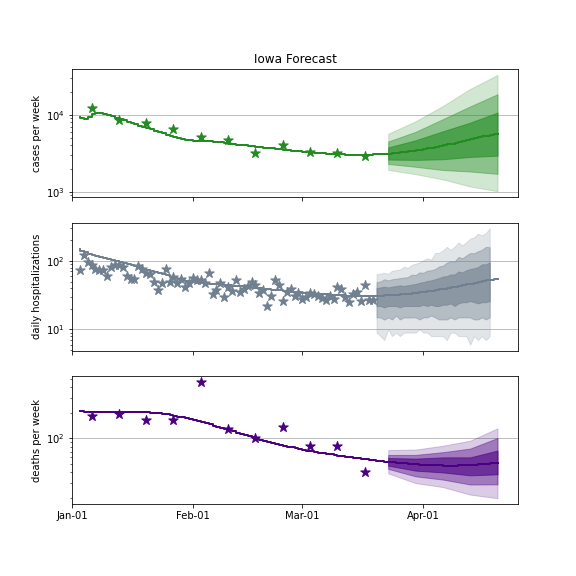
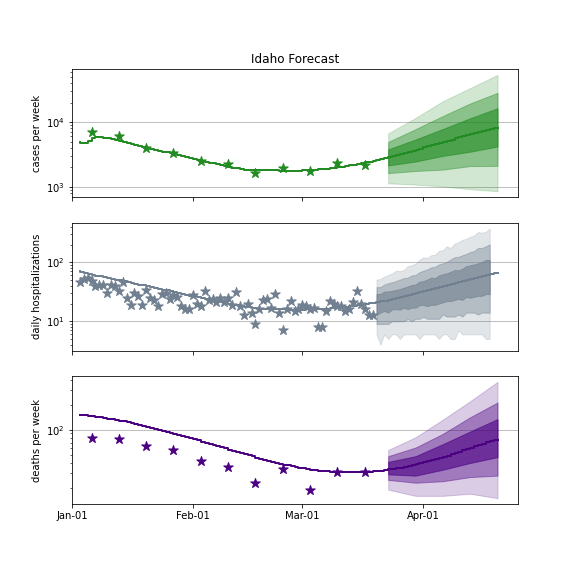
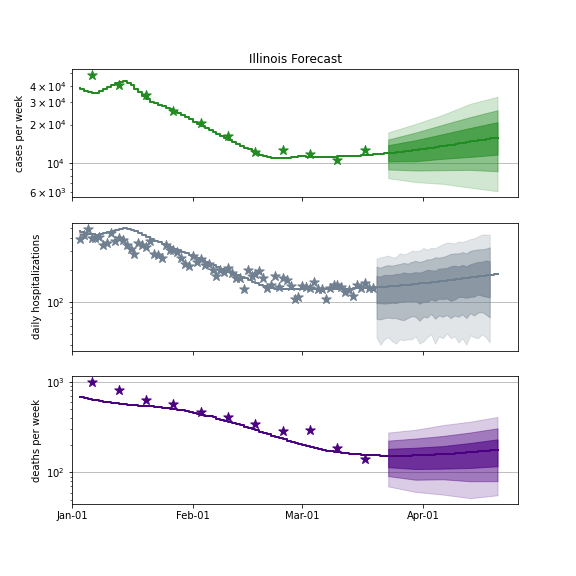
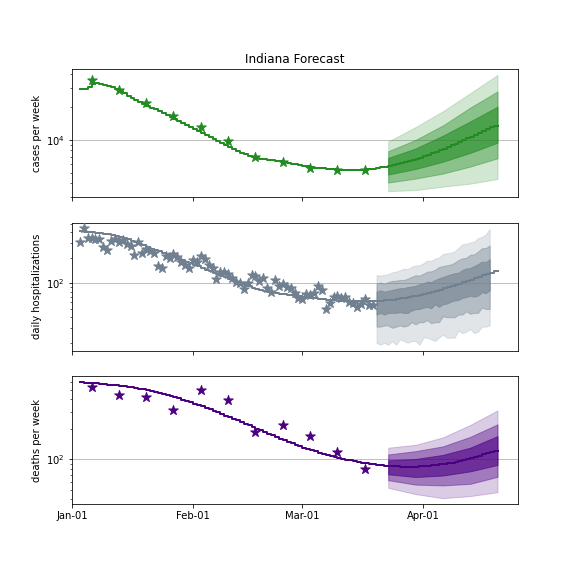
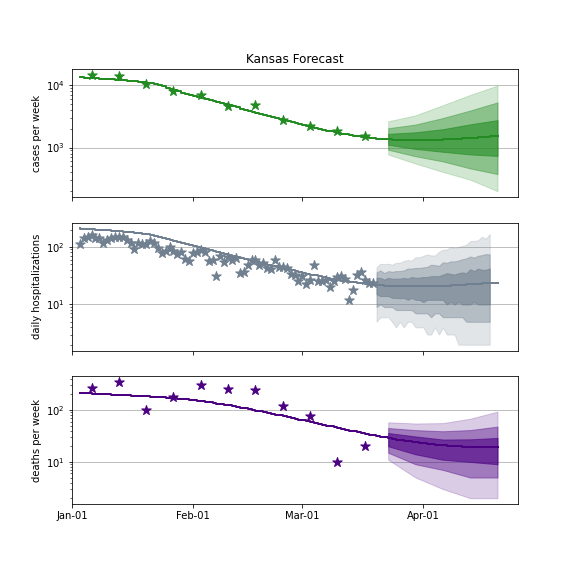
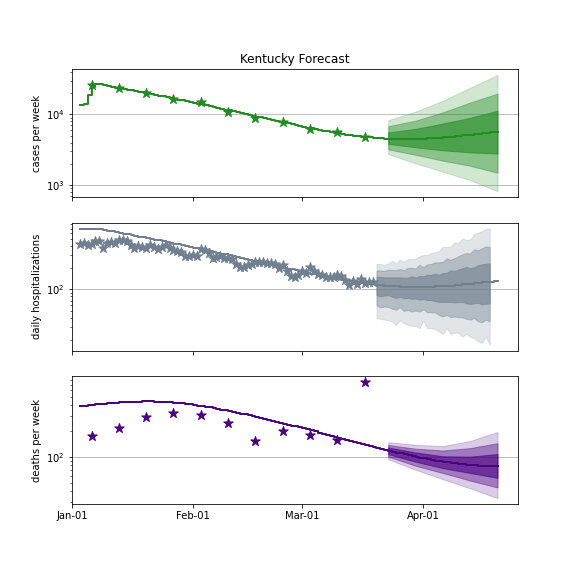
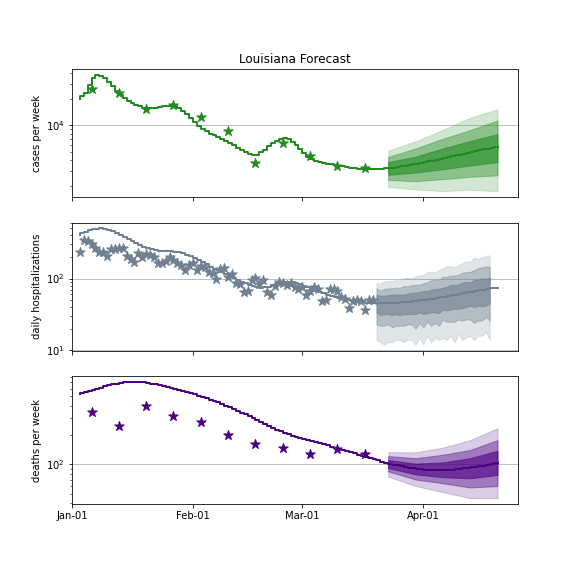
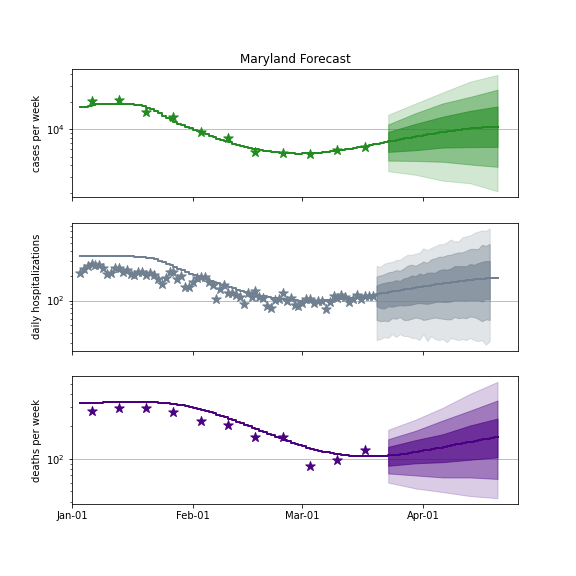
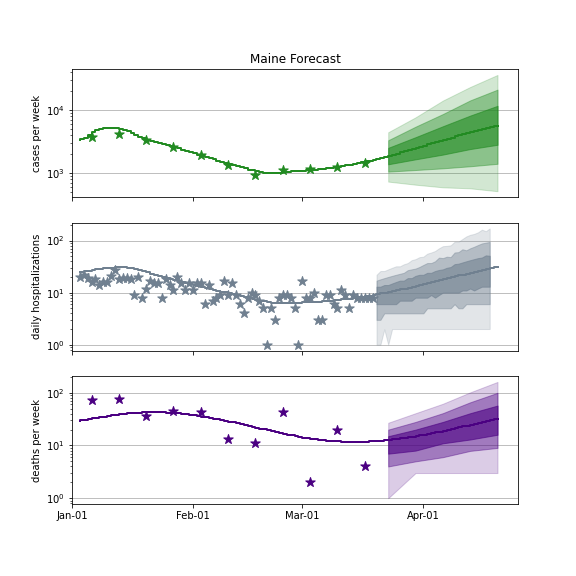
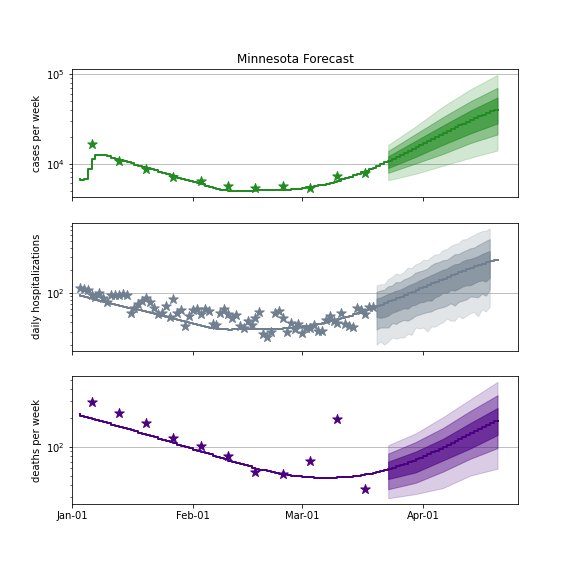
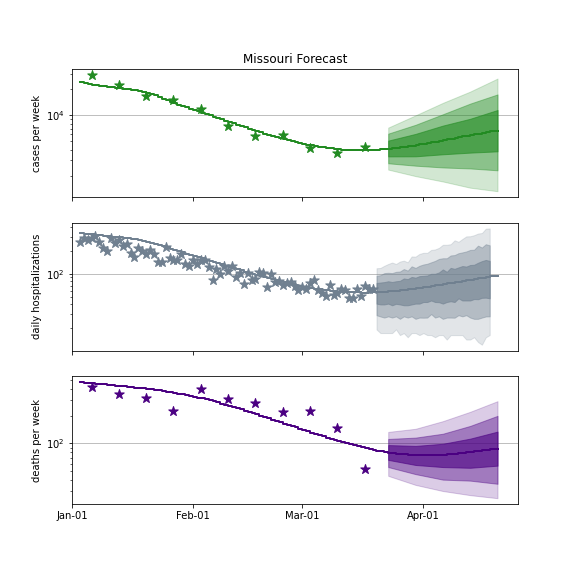
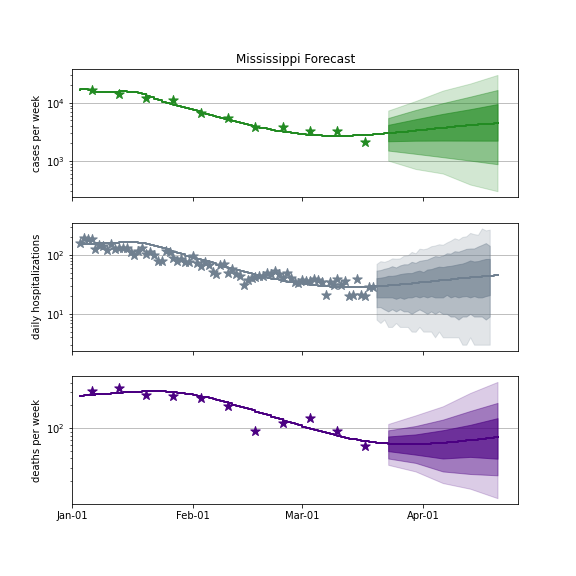
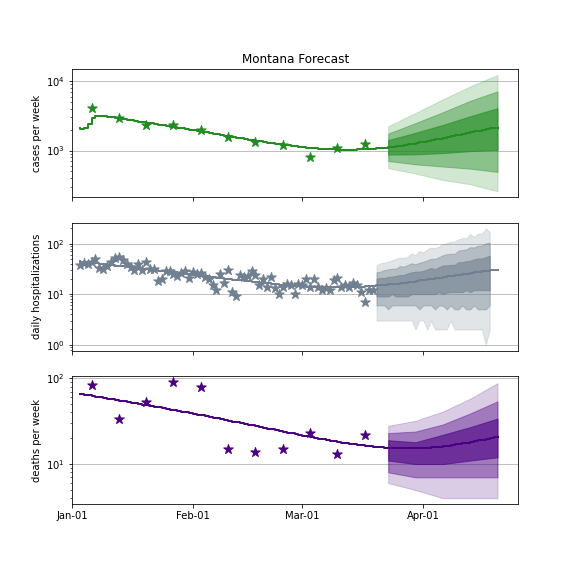
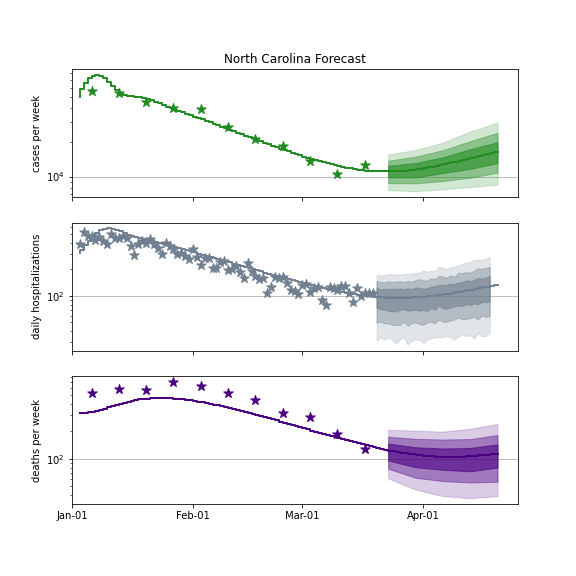
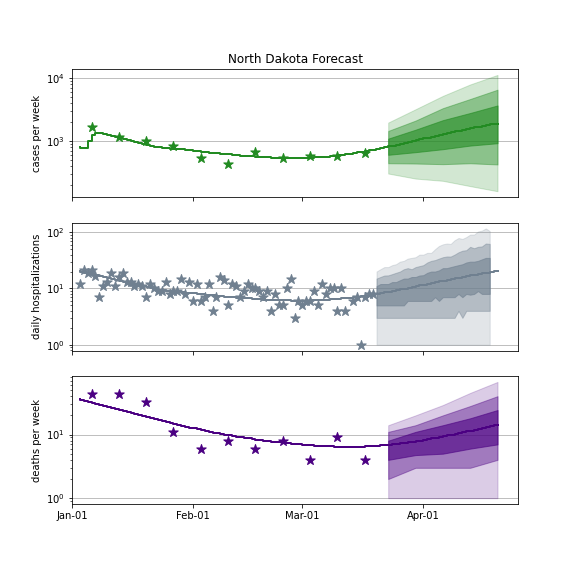
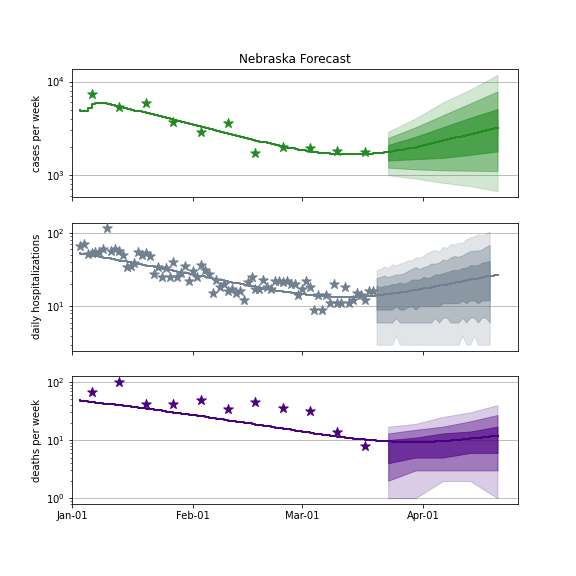
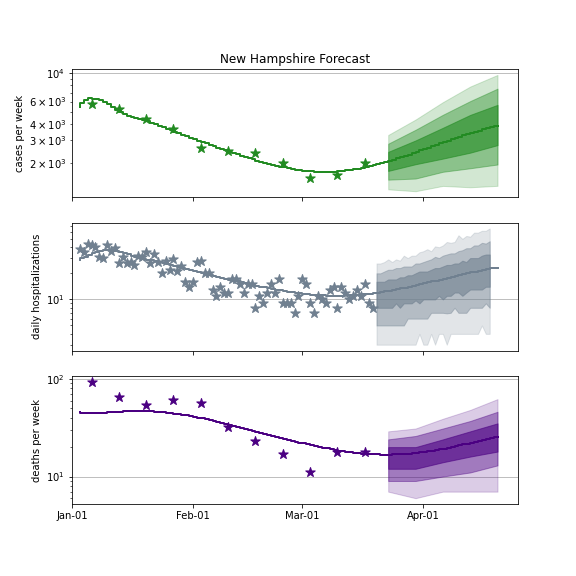
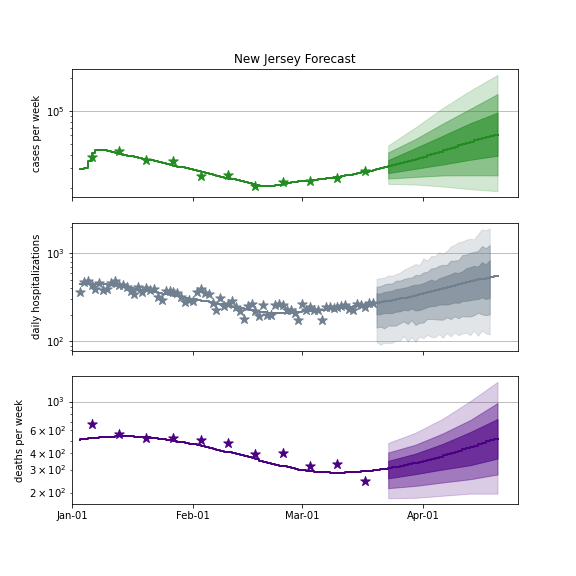
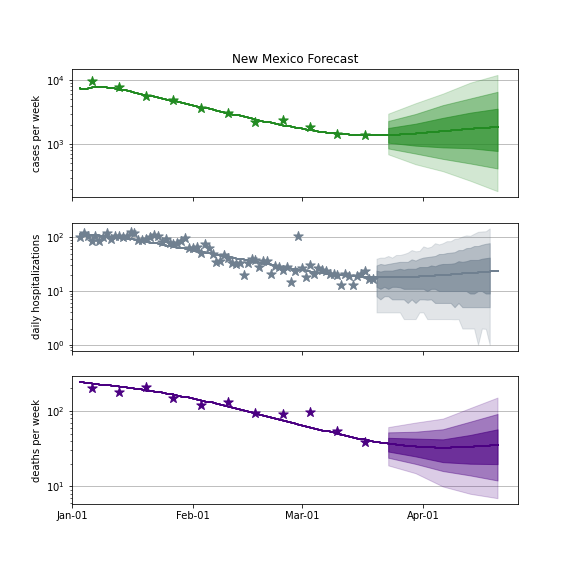
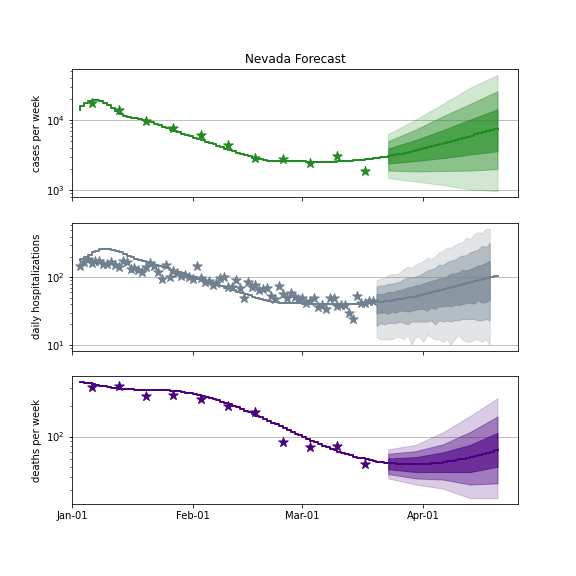
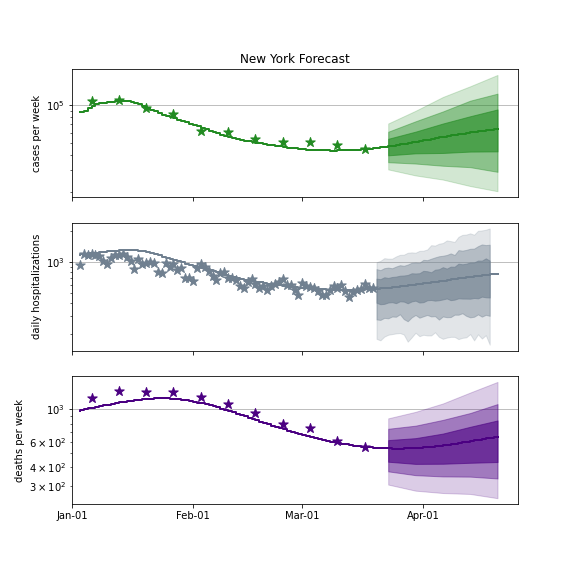
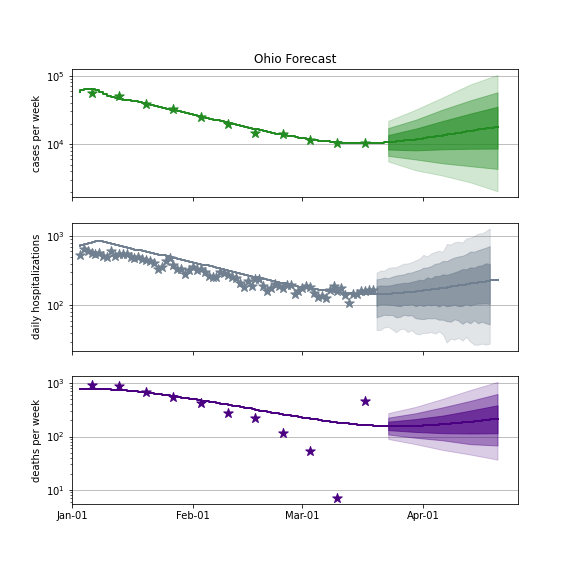
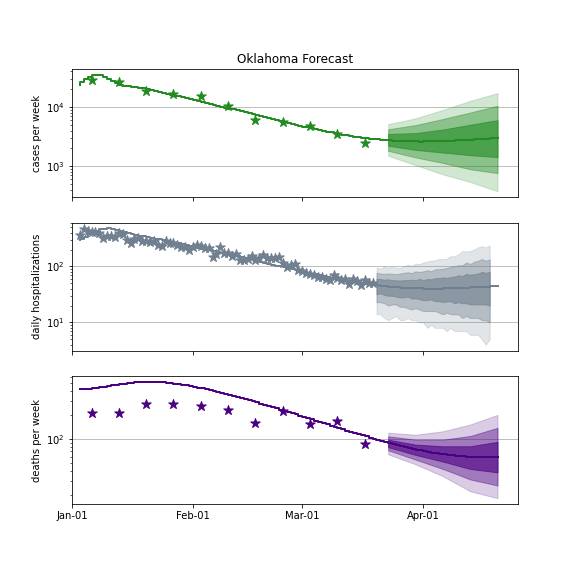
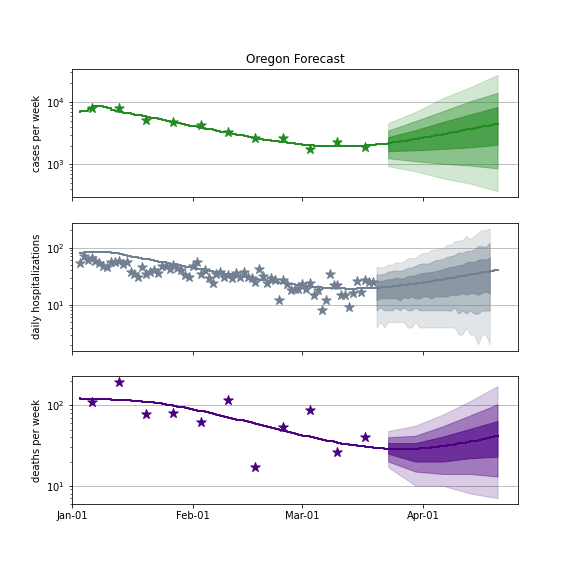
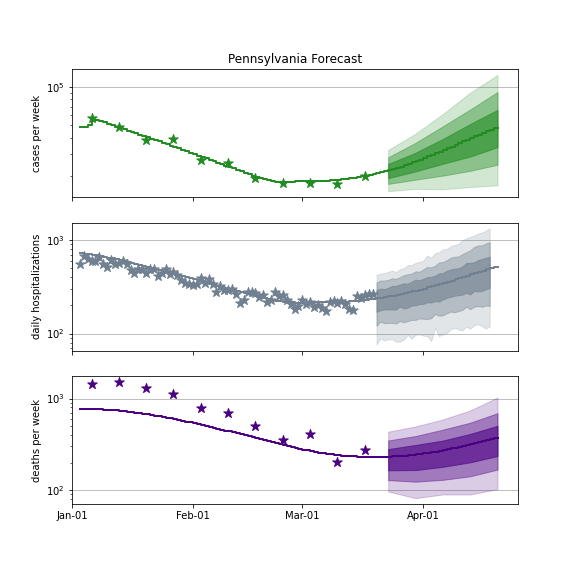
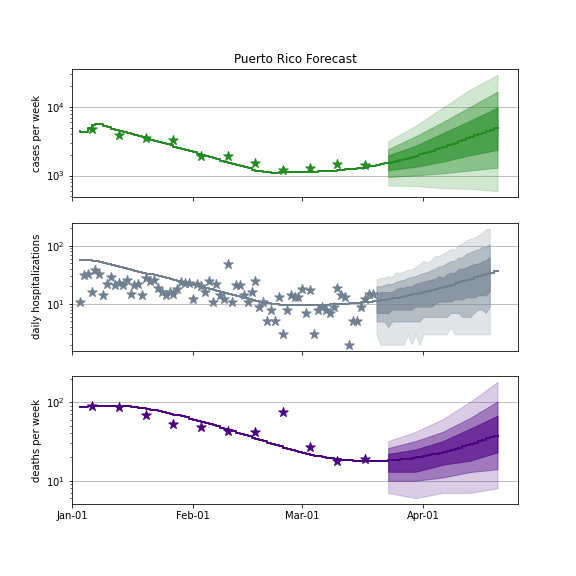
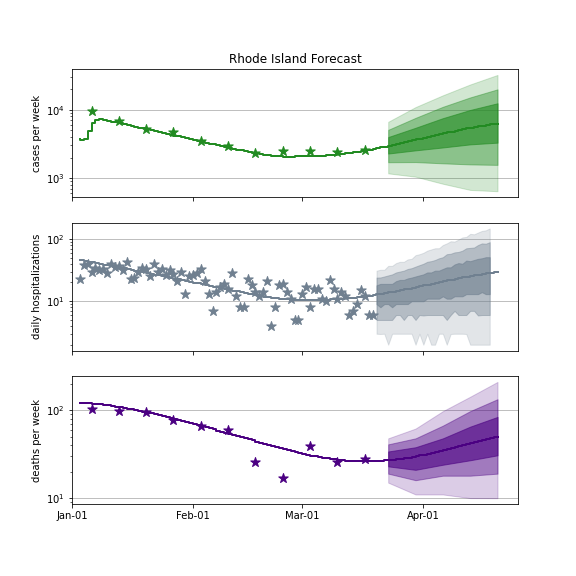
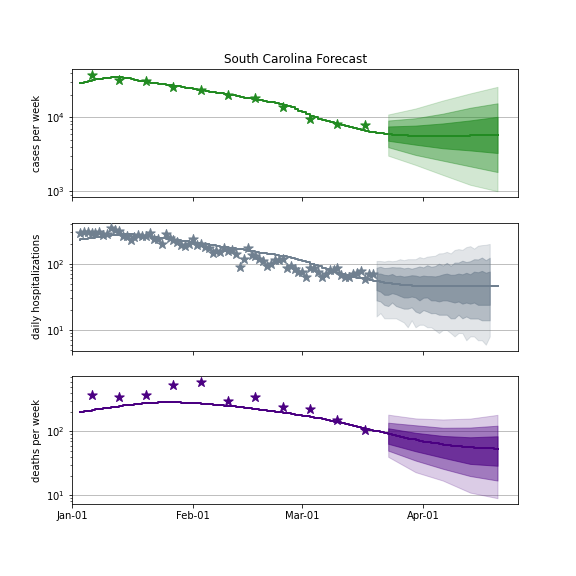
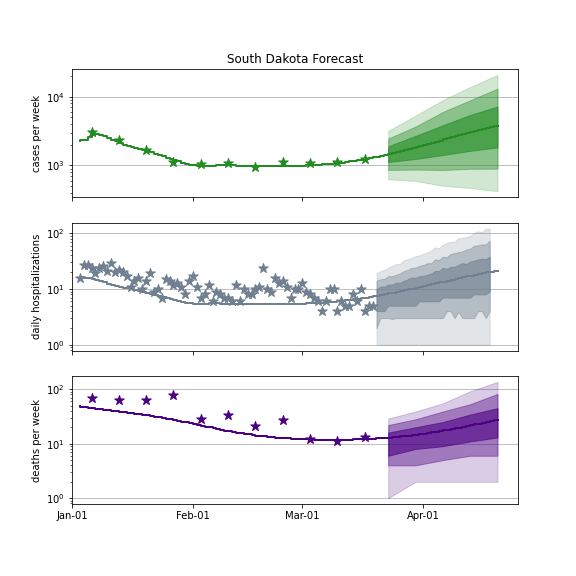
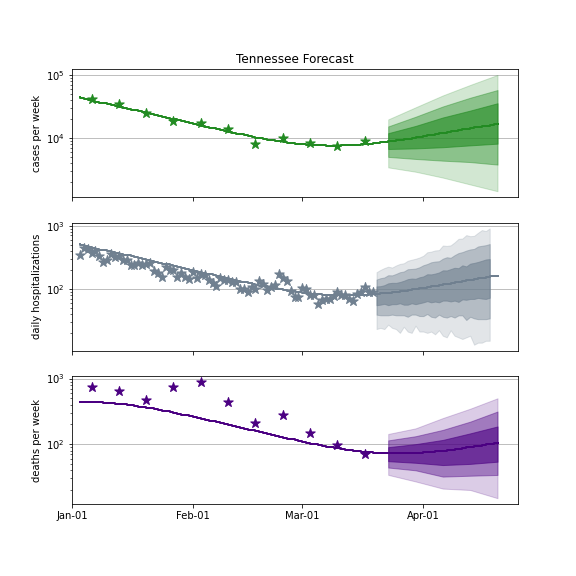
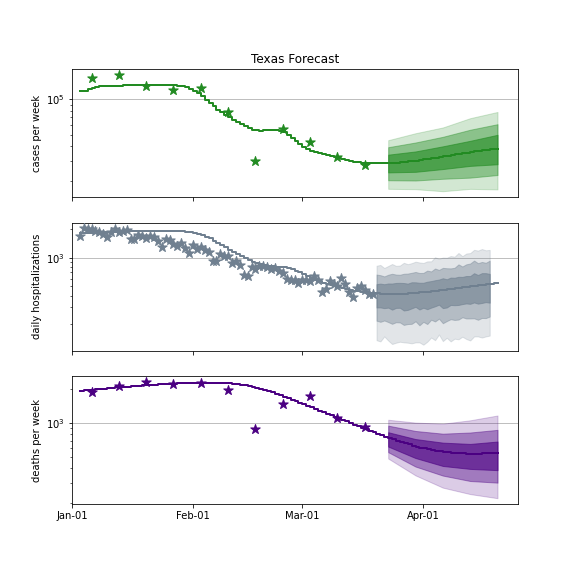
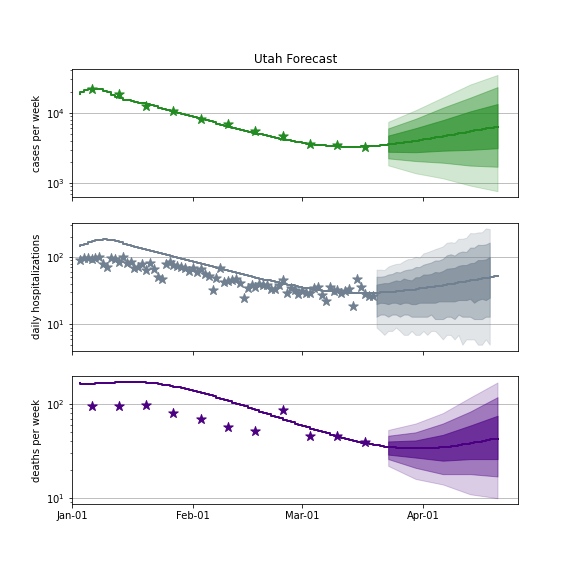
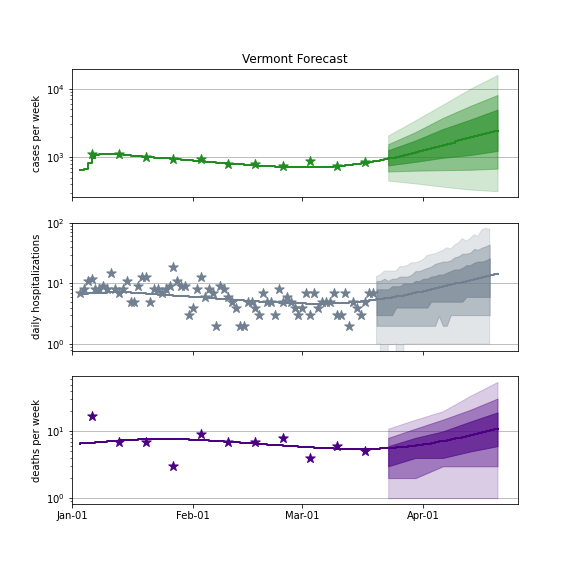
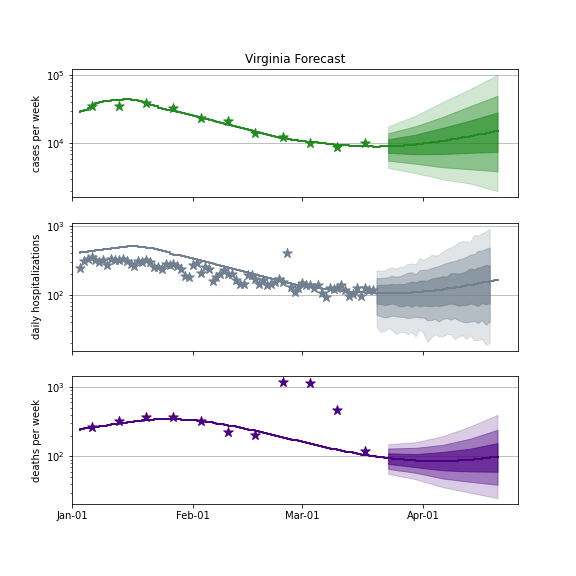
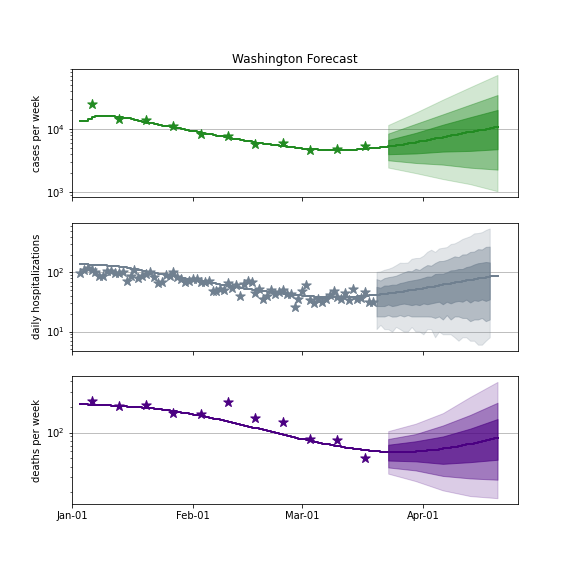
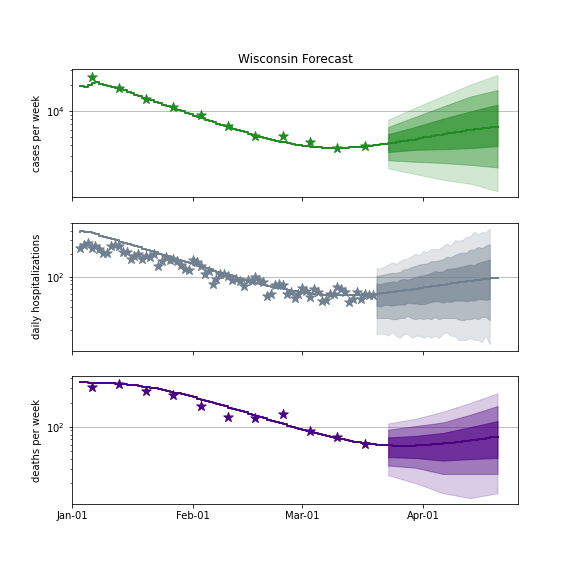
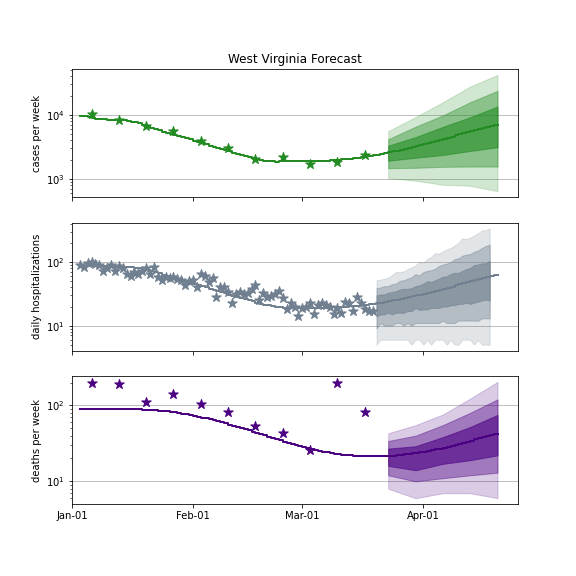
Forecasts
The following plots show 4 week forecasts. The shaded areas are 50%, 80%, and 95% intervals.
USA
Alabama
Alaska
Arkansas
Arizona
California
Colorado
Connecticut
District Of Columbia
Delaware
Florida
Georgia
Hawaii
Iowa
Idaho
Illinois
Indiana
Kansas
Kentucky
Louisiana
Massachusetts

Maryland
Maine
Michigan

Minnesota
Missouri
Mississippi
Montana
North Carolina
North Dakota
Nebraska
New Hampshire
New Jersey
New Mexico
Nevada
New York
Ohio
Oklahoma
Oregon
Pennsylvania
Puerto Rico
Rhode Island
South Carolina
South Dakota
Tennessee
Texas
Utah
Vermont
Virginia
Washington
Wisconsin
West Virginia
Wyoming