December 16, 2021 Analysis of BC regional data: omicron projections
This page shows results of analyses reported in our regular BC COVID-19 Modelling Group reports.
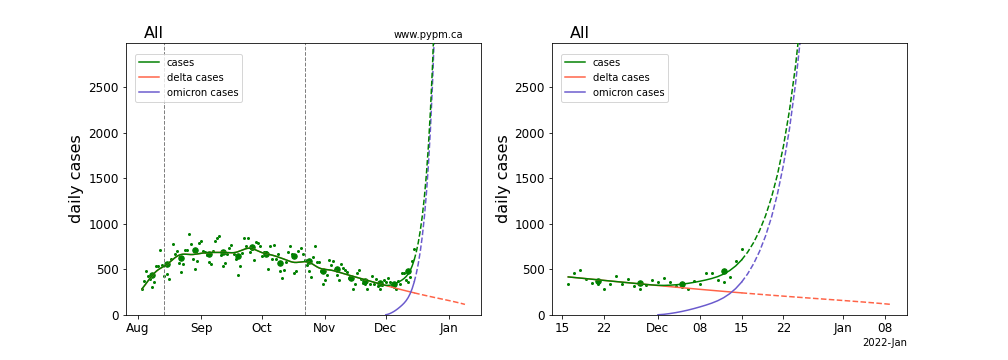
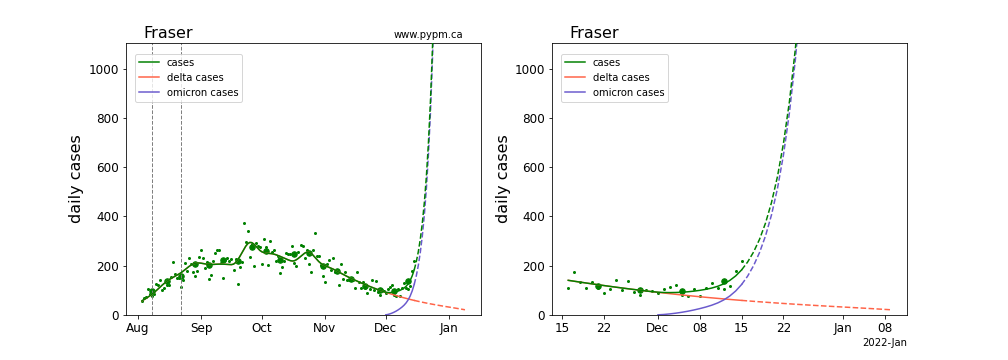
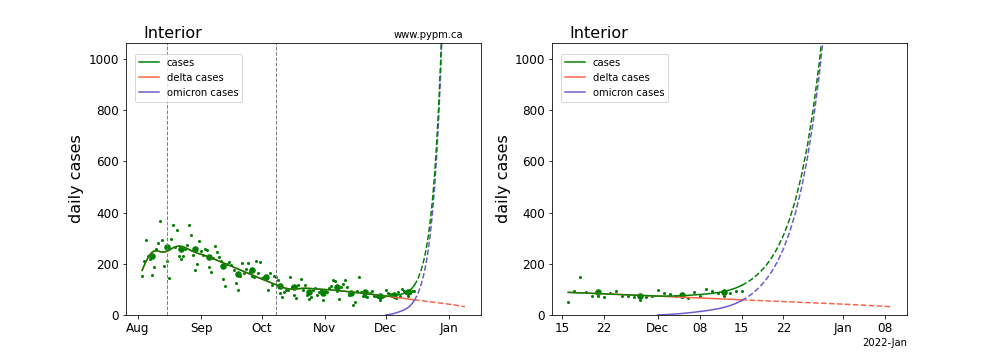
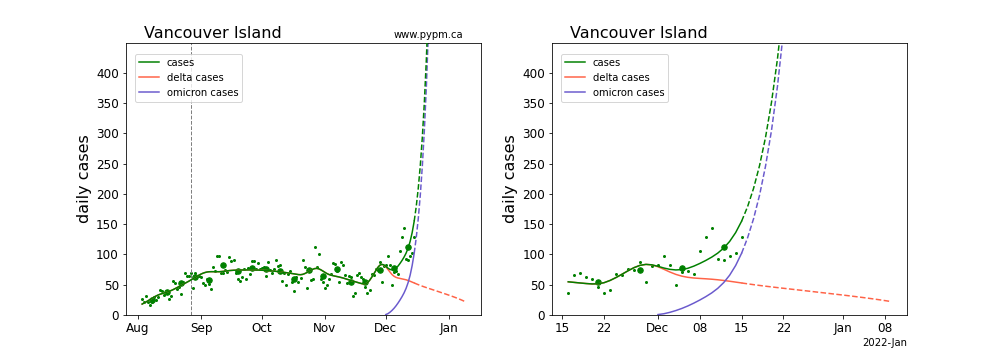
Projections for each health authority case data
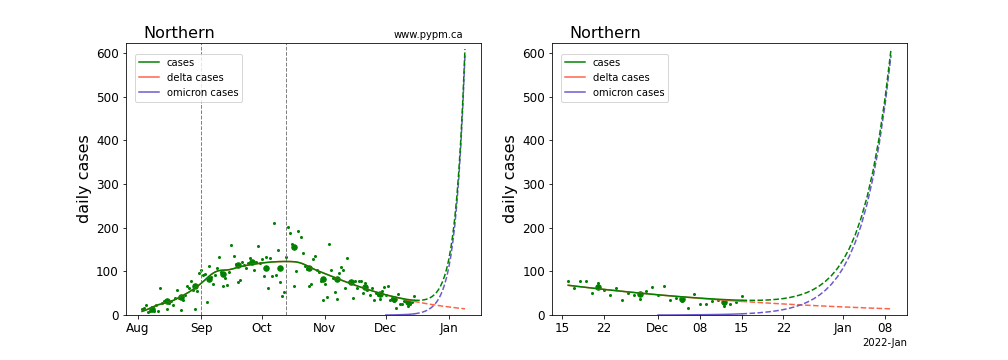
Omicron parameters are estimated by fitting models to case data for each health authority. For the larger authorities, both the omicron growth rate and its current fraction of cases can be fit. For the others, a fixed growth rate of 25%/day is assumed, and the current fraction is fit. The Northern HA does not yet show evidence for omicron in the case data, so its current fraction is set to 10%.
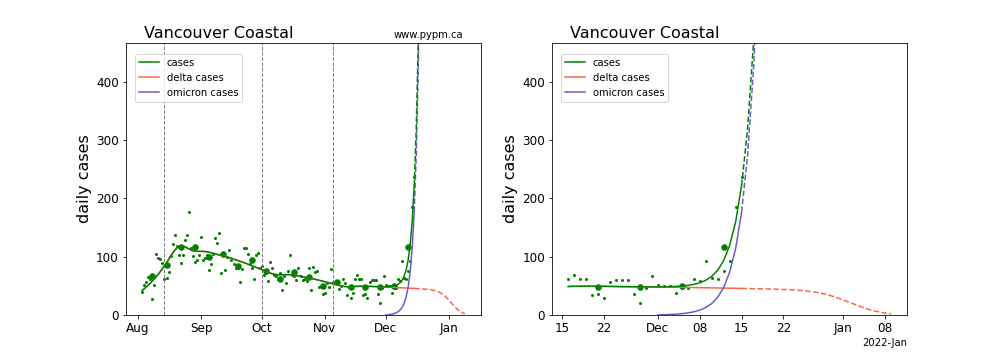
The Coastal HA best fit has a very large growth rate (55%/day). Since there are very few data points and there are large fluctuations from reporting issues, more data is required to confirm such a large growth rate.
For more information, please refer to the introductory material in the report on provincial analyses.
BC total
Fraser
Interior
Island
Coastal
Northern
Comparison of omicron parameters for the health authorities
The table below indicates the omicron growth rates (shown as percent per day) and the current fraction of cases omicron is producing (percent). Values in parenthesis are not estimated from data, but instead indicate the assumed values. Uncertainties in these estimates are relatively large - no attempt to assess them, given the rapidly changing situation.
| Region | growth (%/day), fraction (%) |
|---|---|
| BC | 25, 66 |
| Fraser | 27, 73 |
| Interior | (25), 55 |
| Coastal | 55, 86 |
| Island | (25), 71 |
| Northern | (25), (10) |