March 24, 2021 Analysis of BC regional data
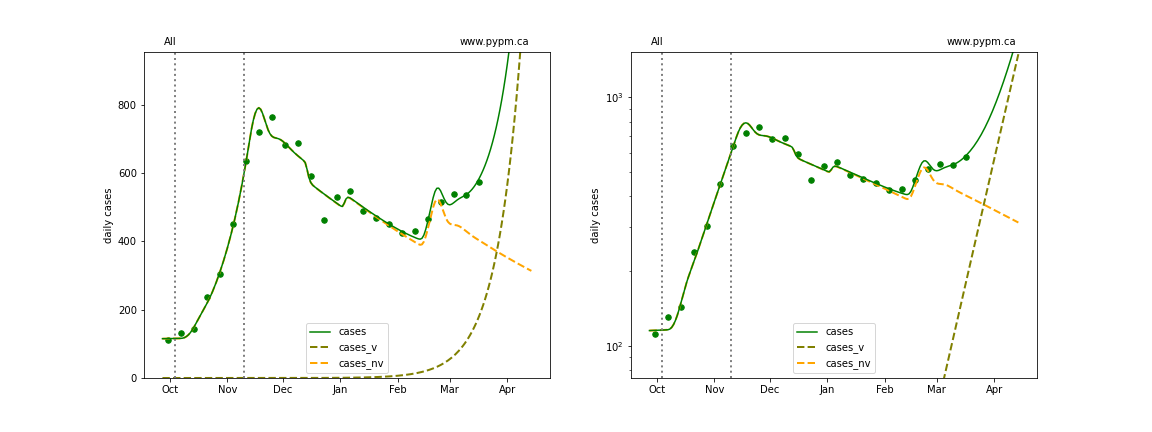
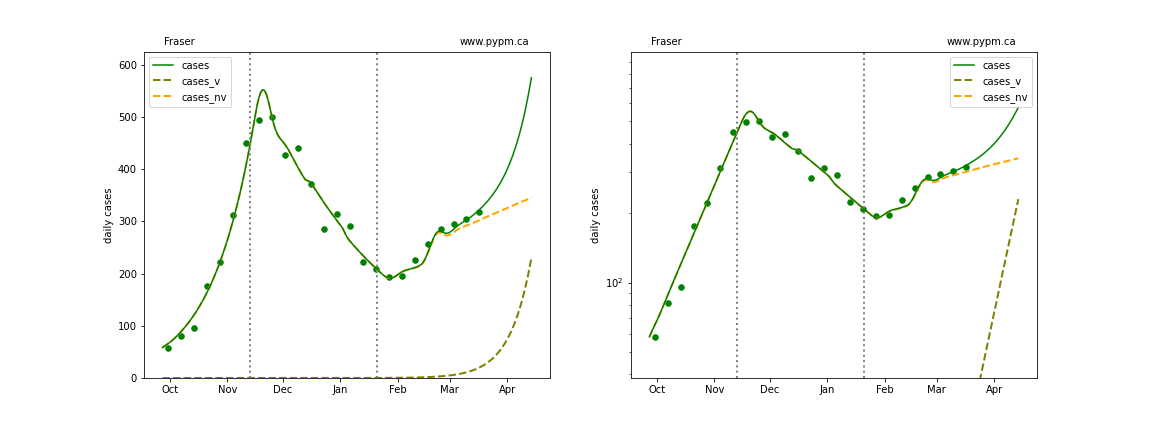
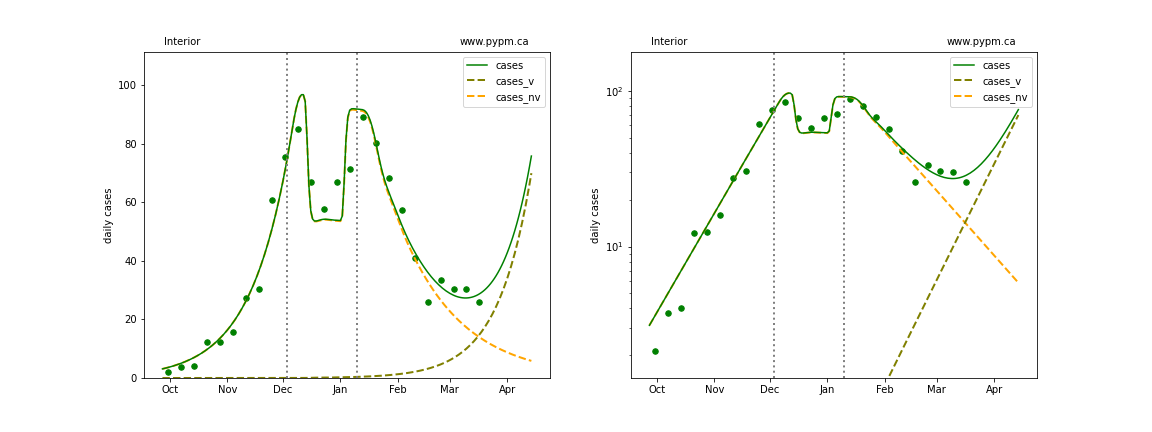
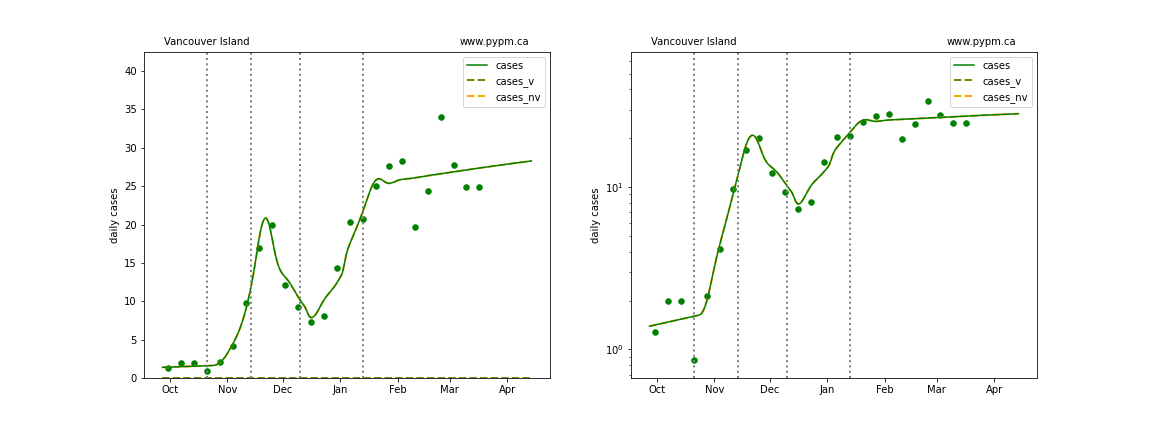
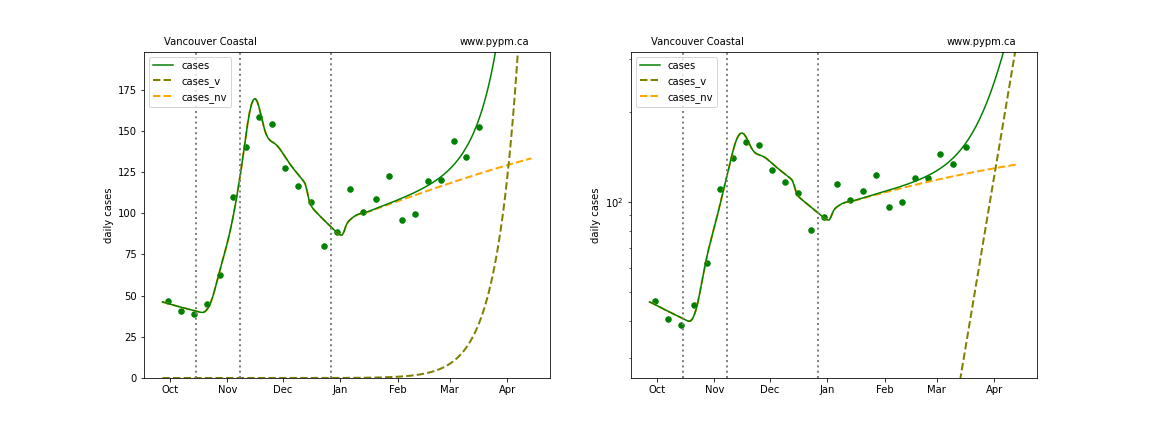
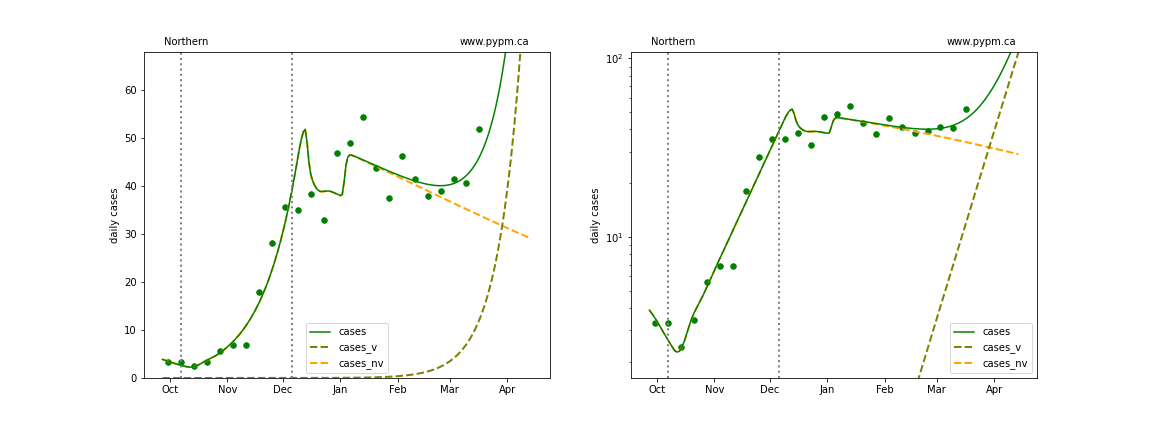
The following shows graphs of daily cases on linear and log scale. Data through March 23 are used, with the plots starting on October 1.
The variant B.1.1.7 will become the dominant source of cases in the coming weeks. Unfortunately the BC Government does not make publicly available their data necessary to estimate the current fraction of cases from B.1.1.7 and the growth rate advantage that it has over the other strains. Time series data on number of samples screened and number of samples identified as B.1.1.7, such as from US states yield precise estimates with which good forecasts can be made.
In absense of genomic data, the curves below illustrate model fits assuming growth advantage of 8.5% per day. The current fraction of cases due to B.1.1.7 is left as a fit parameter, and values between 10% to 60% are found for the diferent regions. As such, these are not forecasts, since the BC government does not provide data to allow us to estimate the critical parameters for B.1.1.7 in the province, nor do they report these critical parameters.
The dashed curves illustrate how cases from the variant (B.1.1.7) overtake the cases from the original strains.
For Vancouver Island, no variant has been included, since there is no indication of recent change to growth in cases.
An outbreak in cases for Fraser and overall BC in February is included to model the “Trivia Night” event that caused a large number of infections in Vancouver.
BC total
Fraser
Interior
Island
Coastal
Northern
Forecasts from Feb 23
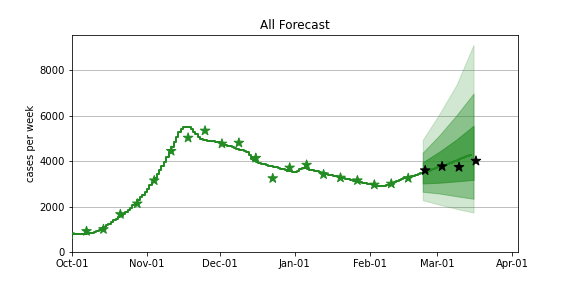
The procedure previously used to produce the BC forecast intervals has been used in US forecasts for the past several months and coverage of those intervals have been reasonable. The forecasts assume that no dramtic changes in policy or behaviour occur over the next several weeks.
It is no longer possible to produce useful forecasts for BC, because the province does not release data necessary to estimate the critical parameters for the B.1.1.7 variant, and that variant will be determining the course of cases in the coming weeks.
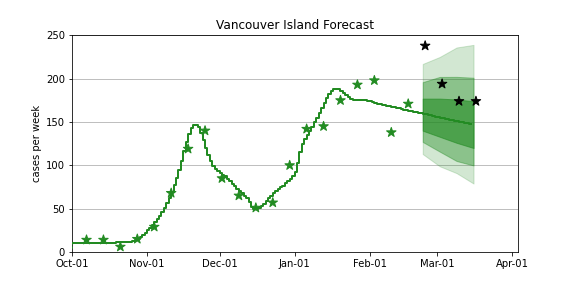
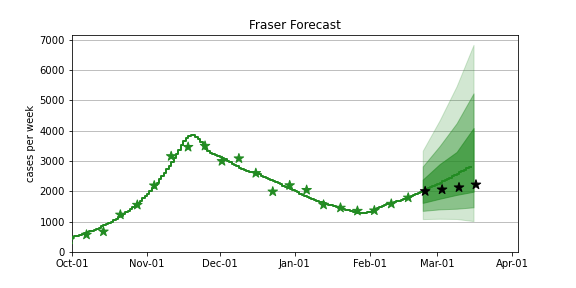
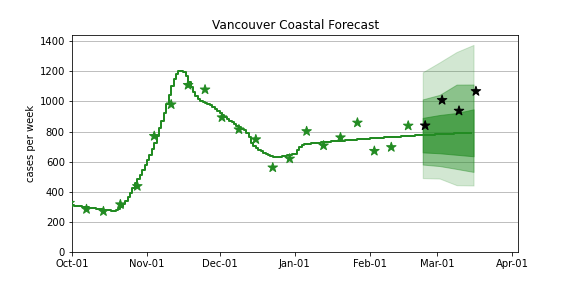
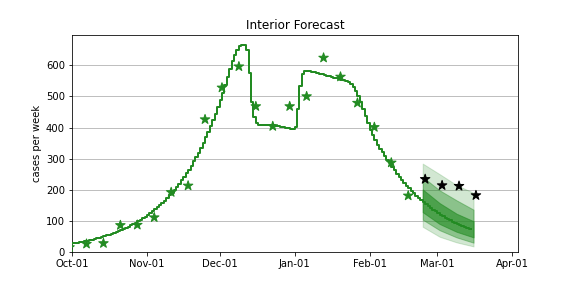
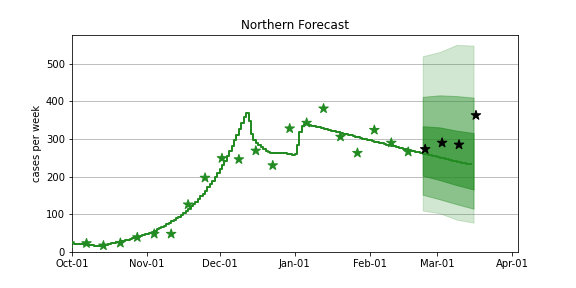
The figures below show forecats made on Feb 23, 2021. The stars represent the weekly data, the curves represent the model summary and forecast, with the bands showing the 50%, 80%, and 95% intervals. The recent data (not available at the time of the forecast) are overlayed as black stars.
BC total
Feb 23 forecast
Fraser
Feb 23 forecast
Coastal
Feb 23 forecast
Interior
Feb 23 forecast
Northern
Feb 23 forecast
Vancouver Island
Feb 23 forecast