January 2, 2022 Omicron projections for US states
Omicron infections are spreading rapidly around the globe. Doubling times of 2-3 days are found in many jurisdictions.
For several US states, omicron has been dominant for weeks, resulting in significant increases in case growth rates. For these states, projections for omicron can be made from population level data.
Using hospital data, model fits are performed to estimate severity of omicron infections, an omicron scaling parameter is fit. The hospitalization probability for omicron infections is given by the product of tha parameter and the probability for hospitalization for delta infections. The reduction in duration of hospital stays is not estimated from data, instead the value is fixed to be 0.4 times the duration for delta infections, which yields reasonable agreement with data, as shown below.
The mean severity is 0.30 and the standard deviation is 0.21, giving an estimated severity of 0.30 +/- 0.05 (one standard deviation error in the mean). It appears that omicron infections that lead to cases are significantly less severe than delta infections that lead to cases.
Individual state projections
For this analysis, the case and death data source is the New York Times, since it has has more regular updates and fewer irregularities than the JHU data.
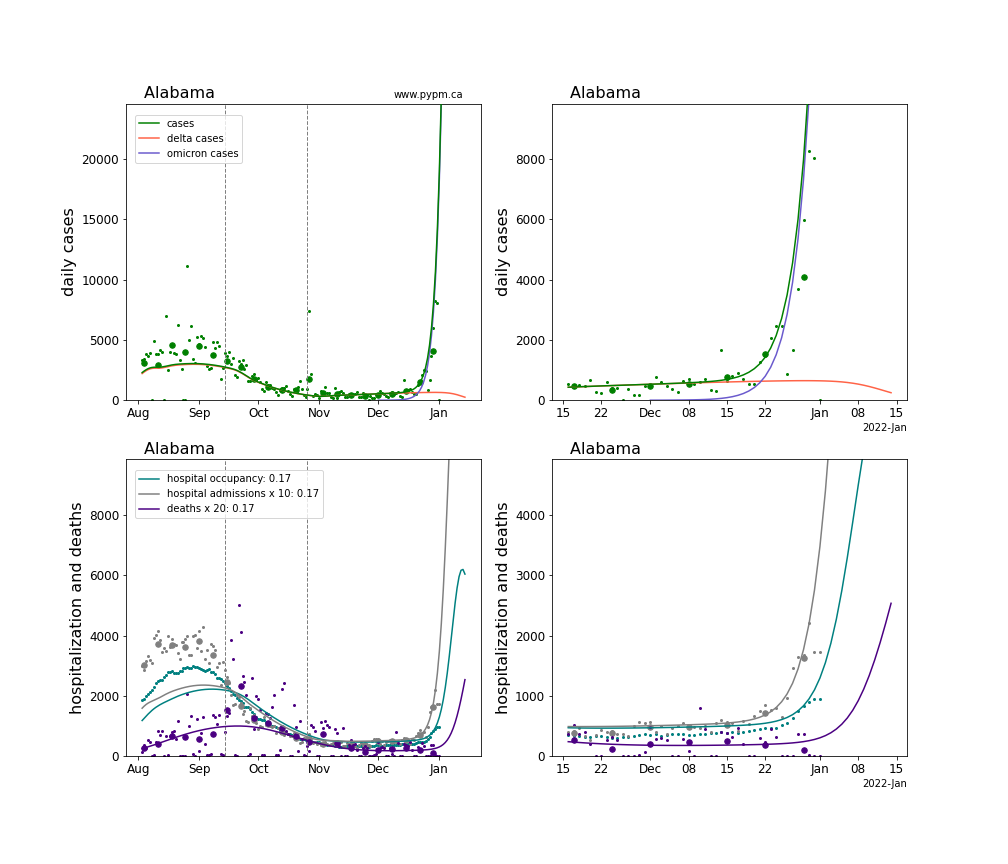
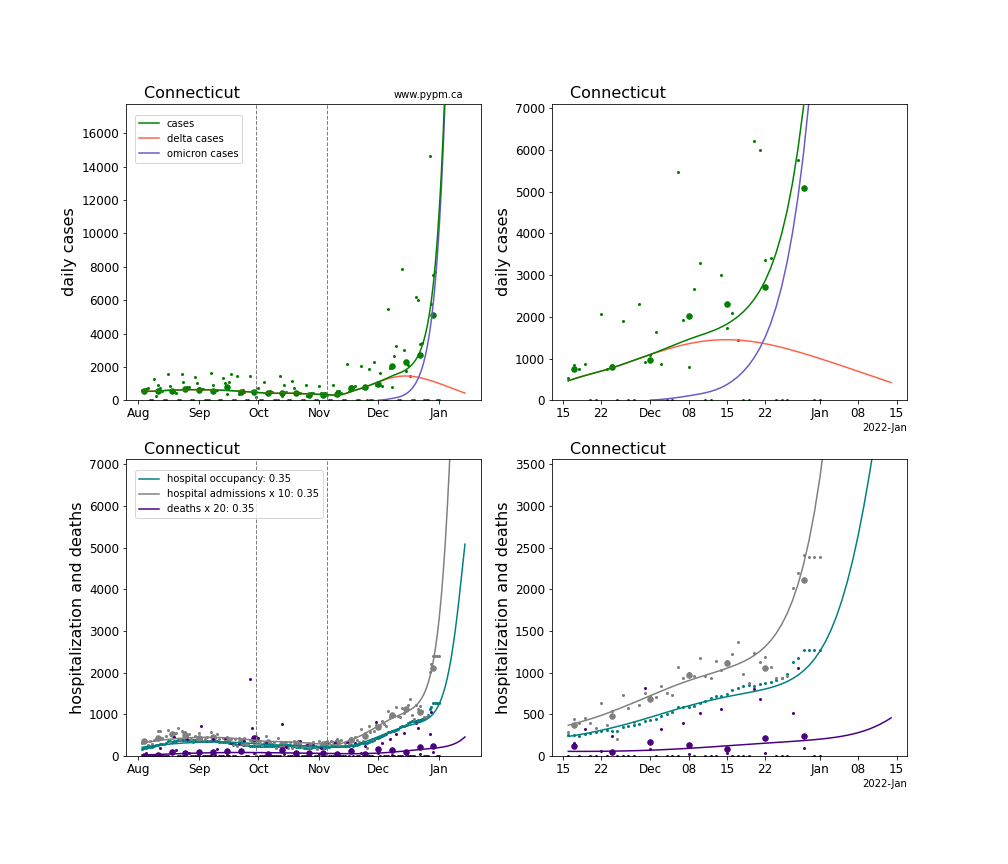
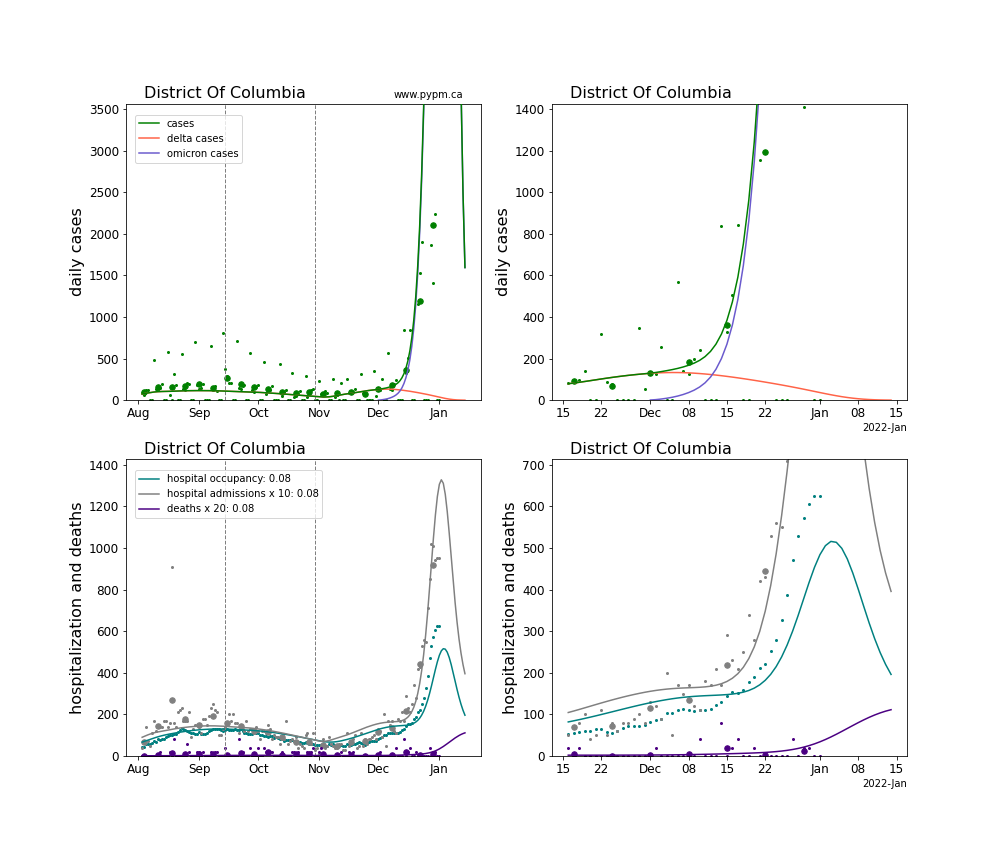
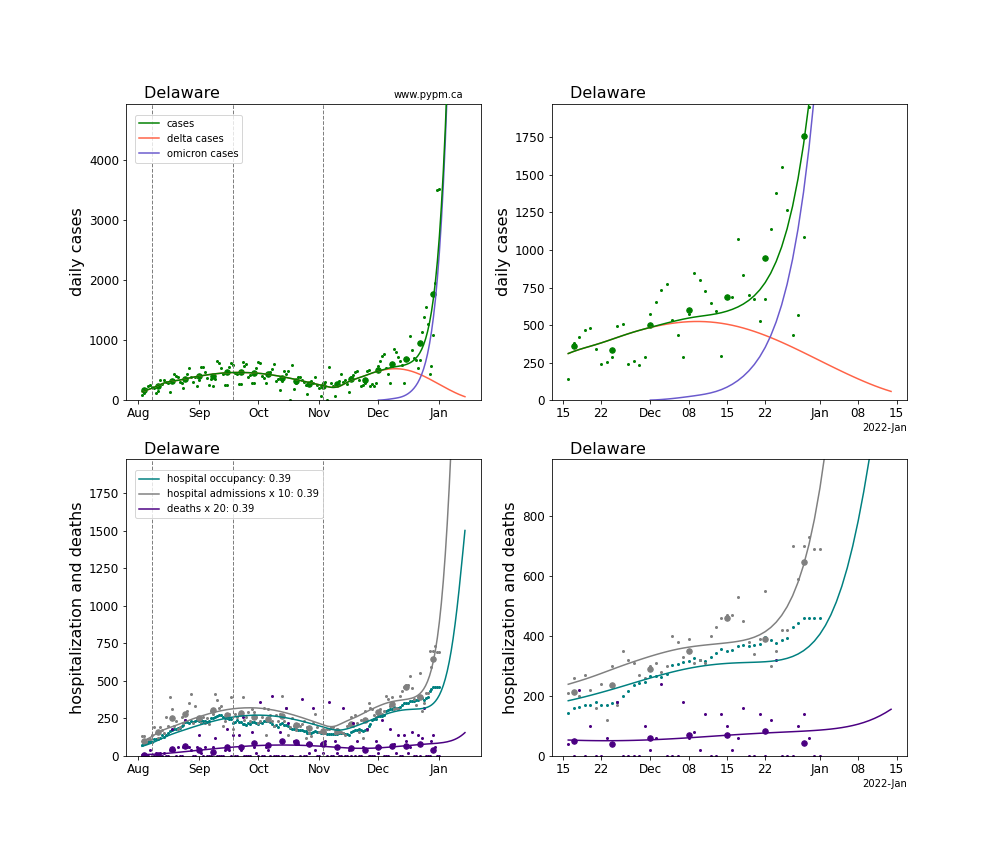
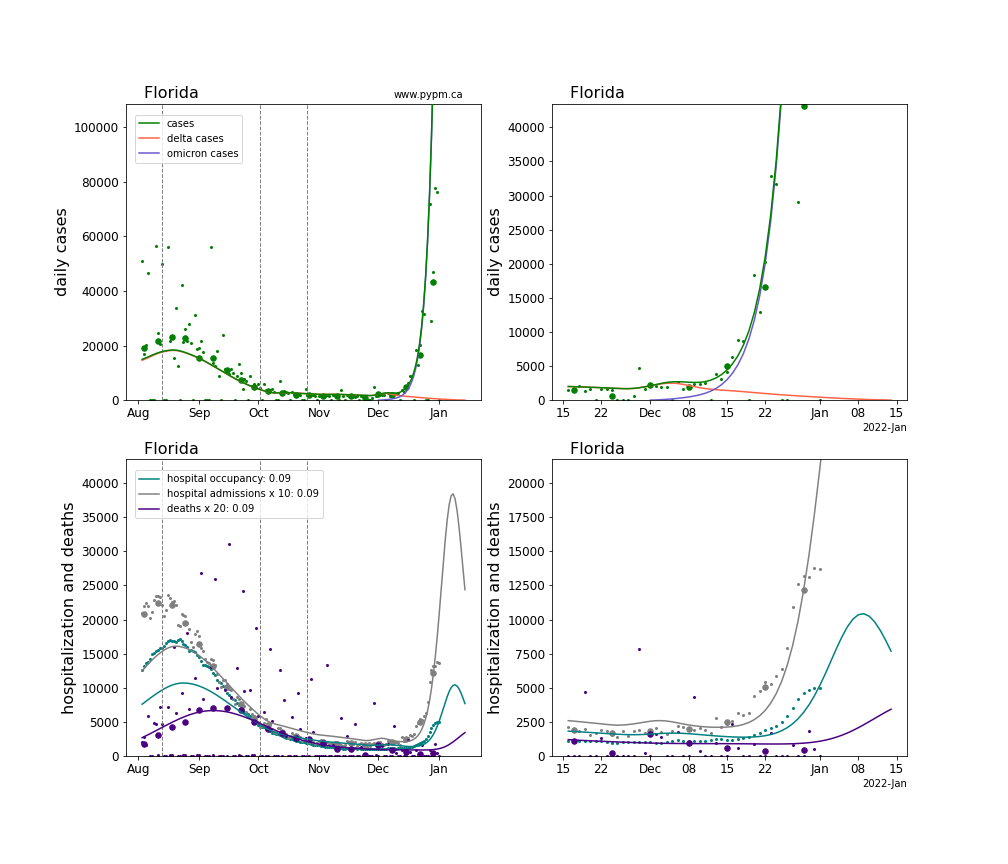
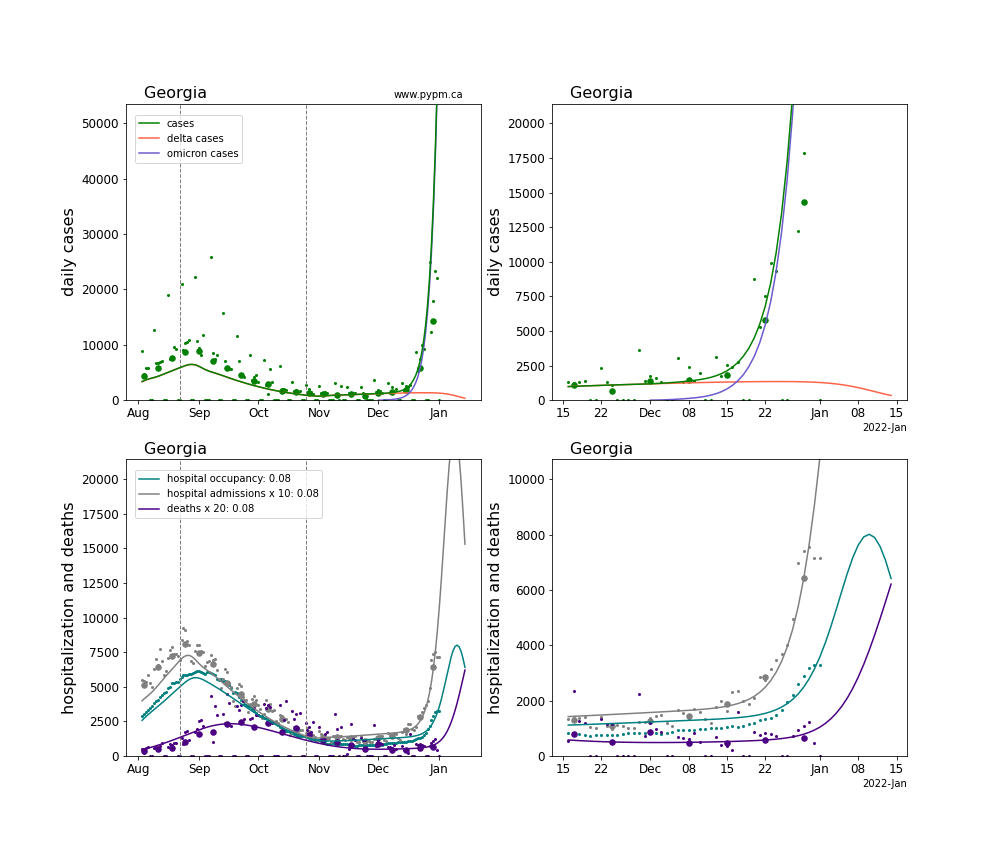
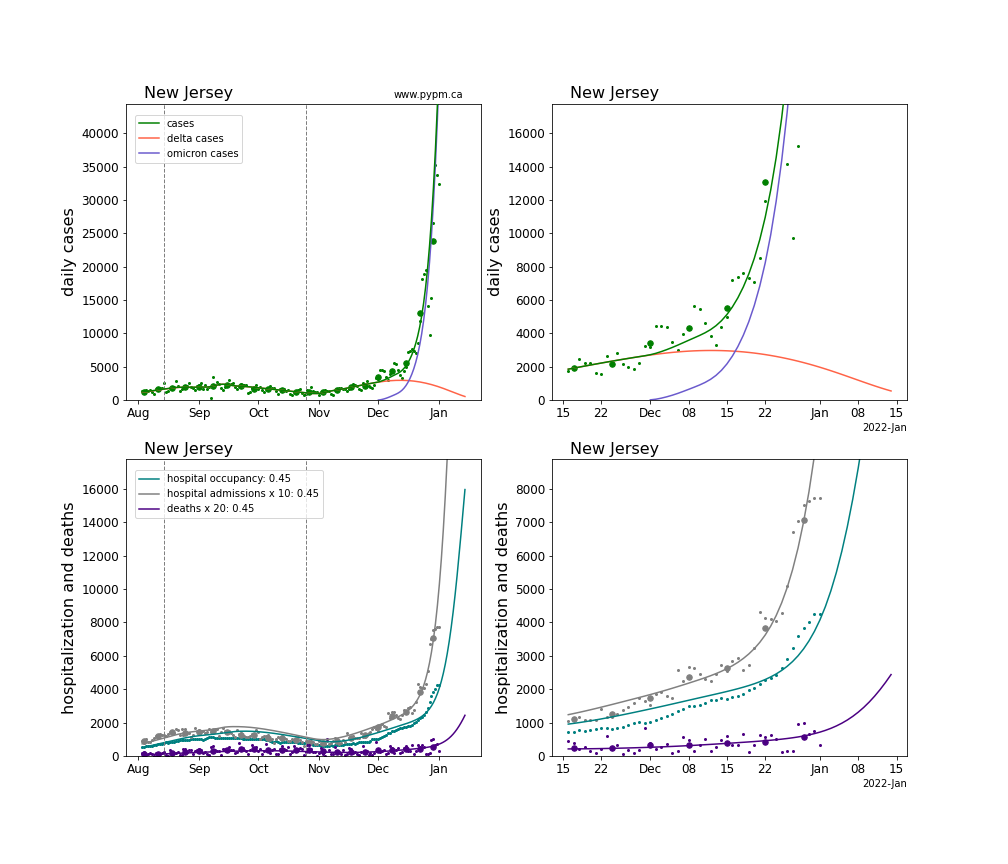
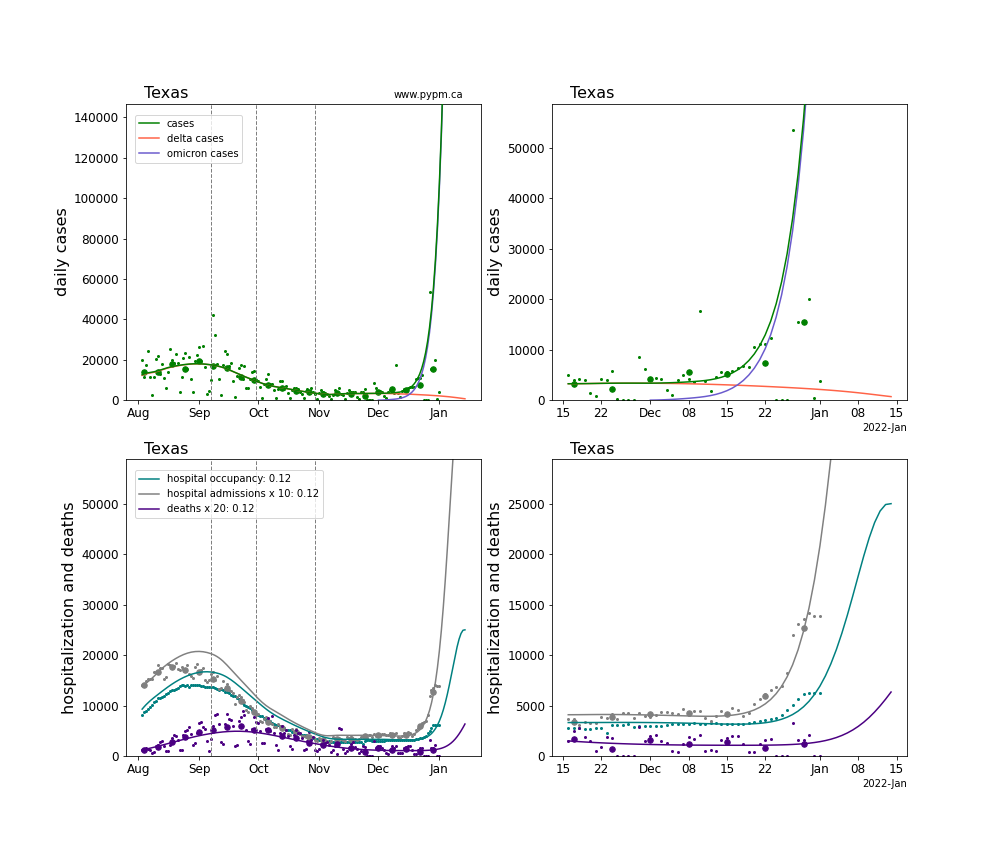
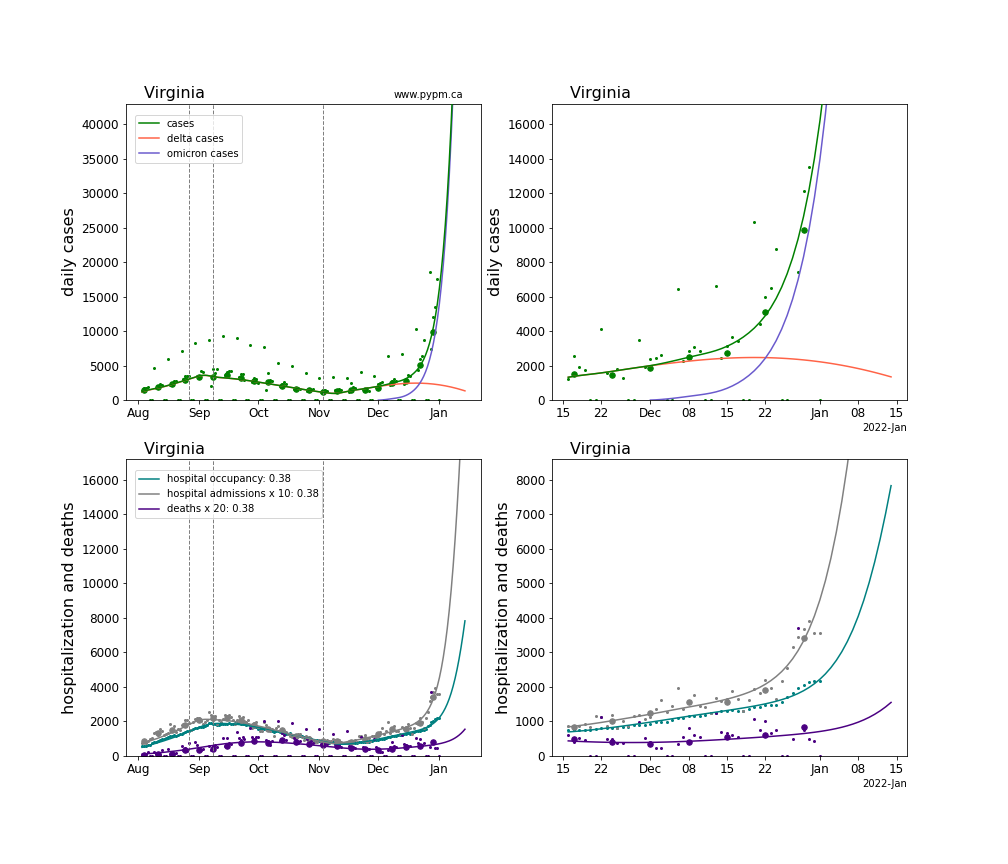
The plots for each state below show the case, hospitalization, and deaths data since August 2021 (left) and since November 15 2021 (right). The maximum vertical axis values for cases are 500/100k (left) and 200/100k (right), and for the hospital occupancy are 200/100k (left) and 100/100k (right). Daily hospital admissions and deaths are scaled up by 10 and 20 respectively.
The infection model is defined by fitting the model to the case data, and the hospitalization and deaths models are derived from the infection model.
The omicron variant is assumed to have a much larger susceptible population, due to its ability to evade immunity (natural and vaccination immunity). For this study, those immunized against earlier strains only have 20% effective immunity against omicron.
The green points are the daily cases, the grey points the daily hospitalizations, the teal points are hospital occupancy, and the indigo points are the daily deaths. The larger circles are weekly averages to help guide the eye.
The case data are used to define the periods for which transmission rate appears to be constant. The vertical lines show where the transmission rate is changed. If the susceptibe fraction is constant (immunity not changing quickly), constant transmission rates lead to steady exponential growth or decline. With immunity growing, the curves bend downwards due to the herd effect. Interpretting the growth of omicron with changing delta rates growth rates leads to additional uncertainty in the interpretations.
The curves are the model expectations for cases, hospitalizations, and deaths, and all three are determined from the case data.
There are several challenges arising from data issues, in particular Thanksgiving closures and possible infection outbreaks, and Christmas closures. The fits to case data do not include data collected after December 23, since data after that date may be affected by the holidays and by testing capacity limits. All hospitalization data are used to estimate omicron severity, since those data may be less affected by holiday and capacity limits.
The numerical value indicate in the plot legend is the fit value for the omicron severity parameter.
Alabama
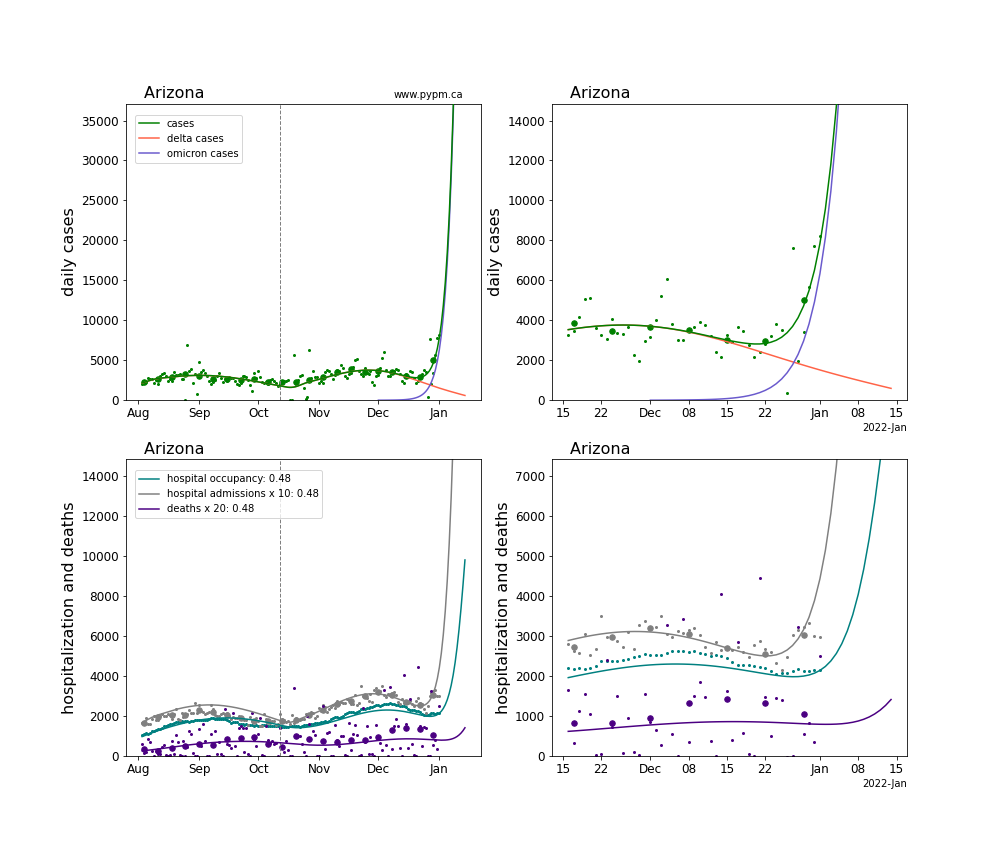
Arizona
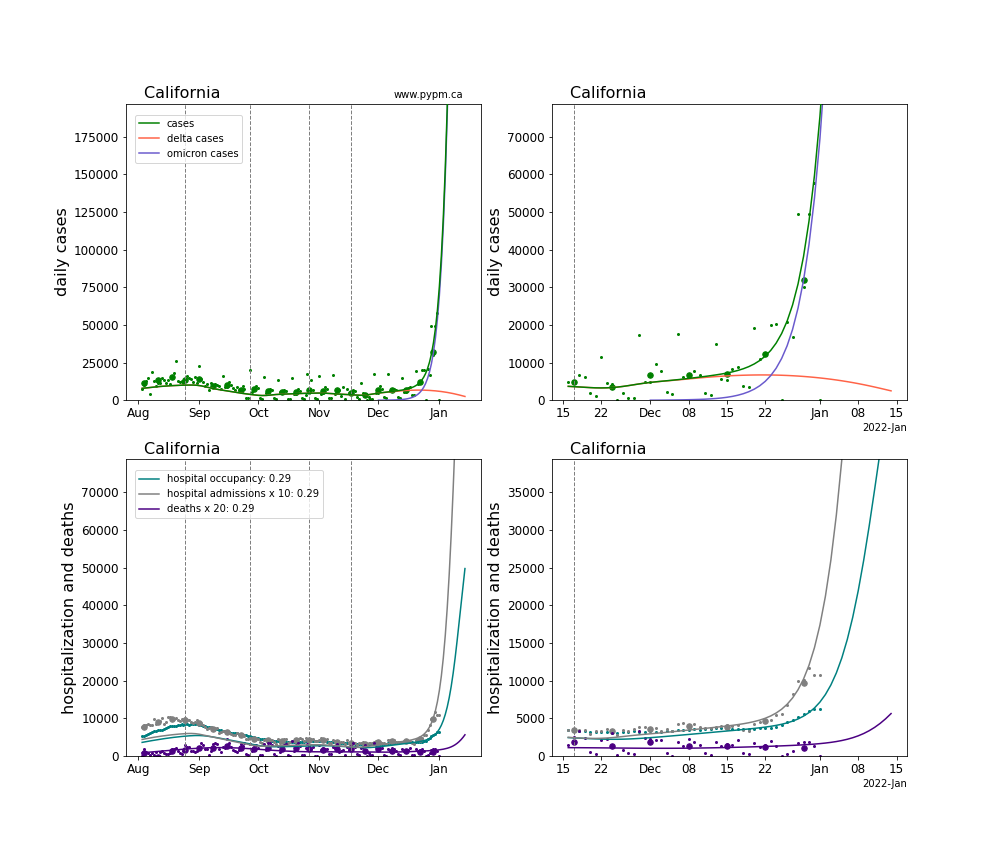
California
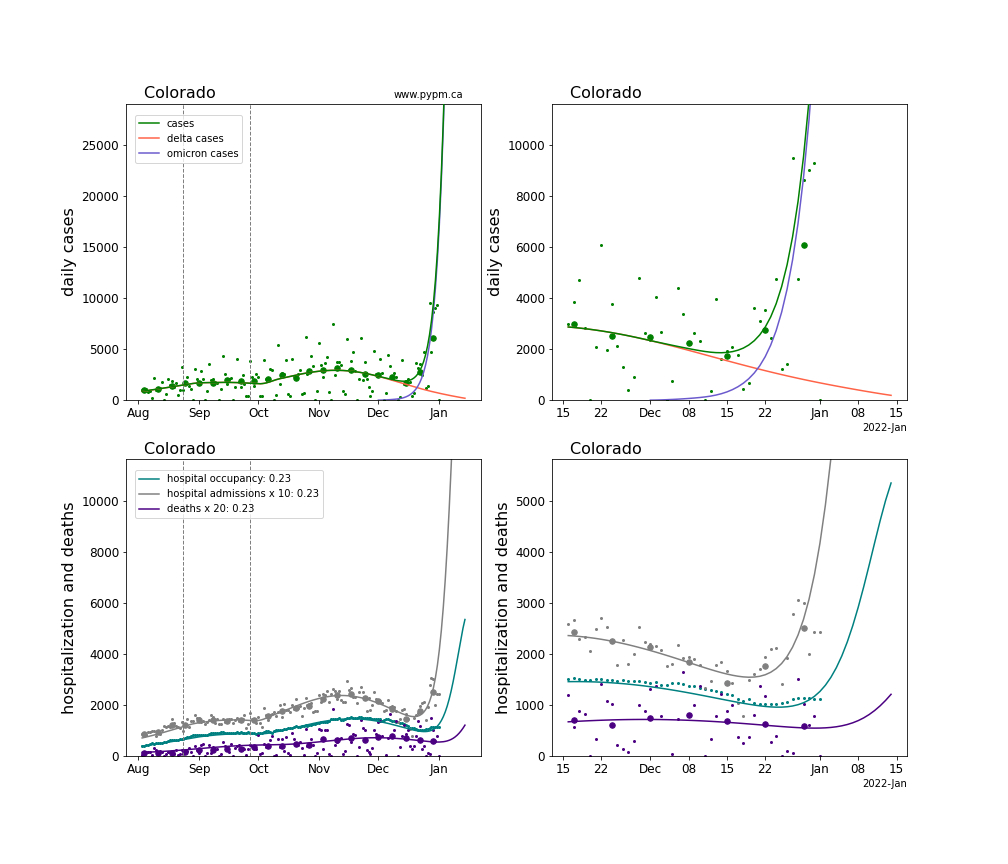
Colorado
Connecticut
District Of Columbia
Delaware
Florida
Georgia
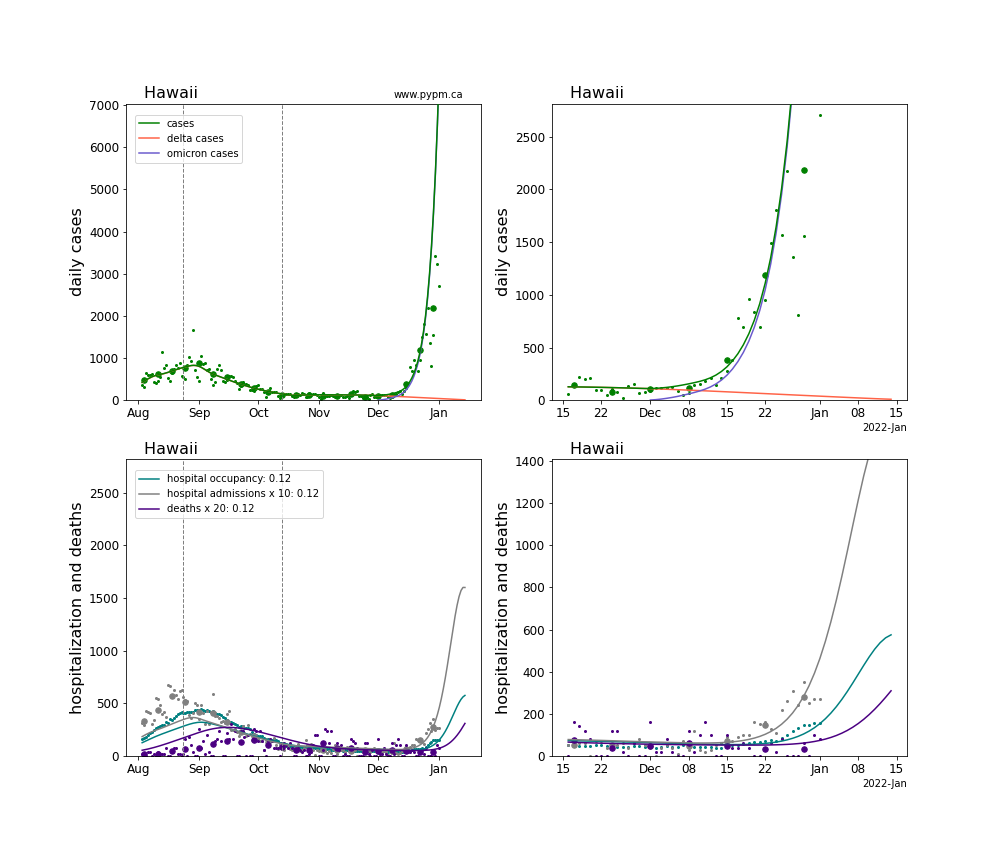
Hawaii
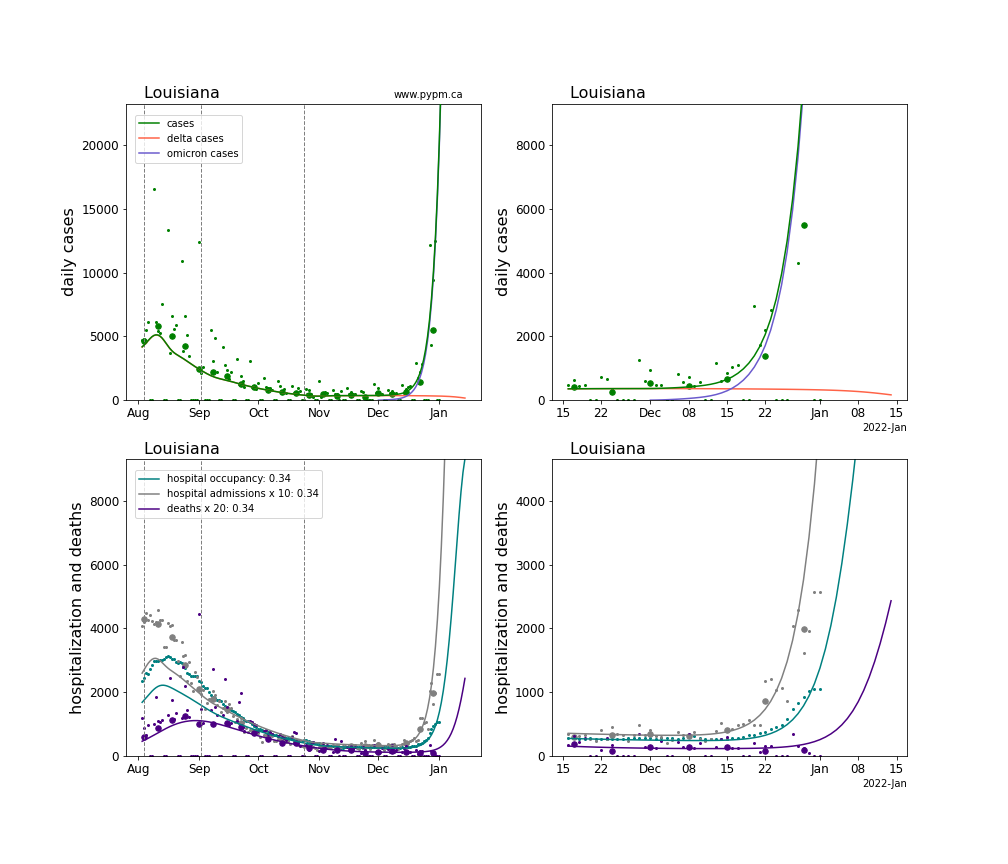
Louisiana
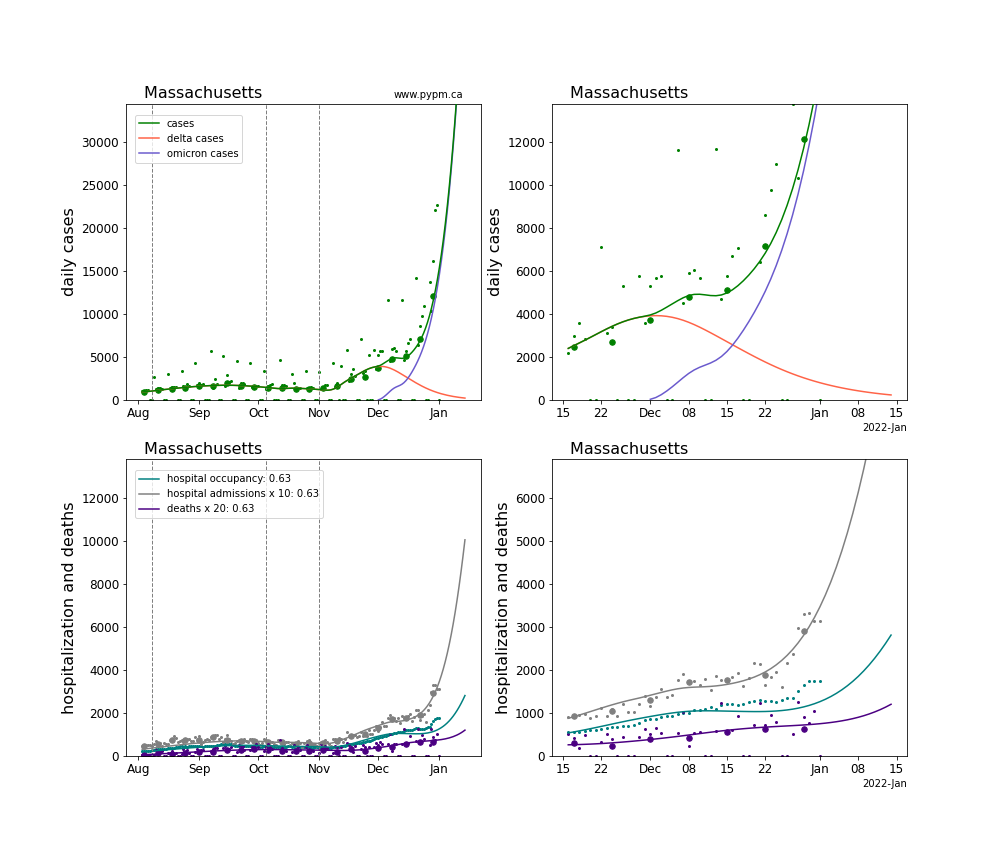
Massachusetts
New Jersey
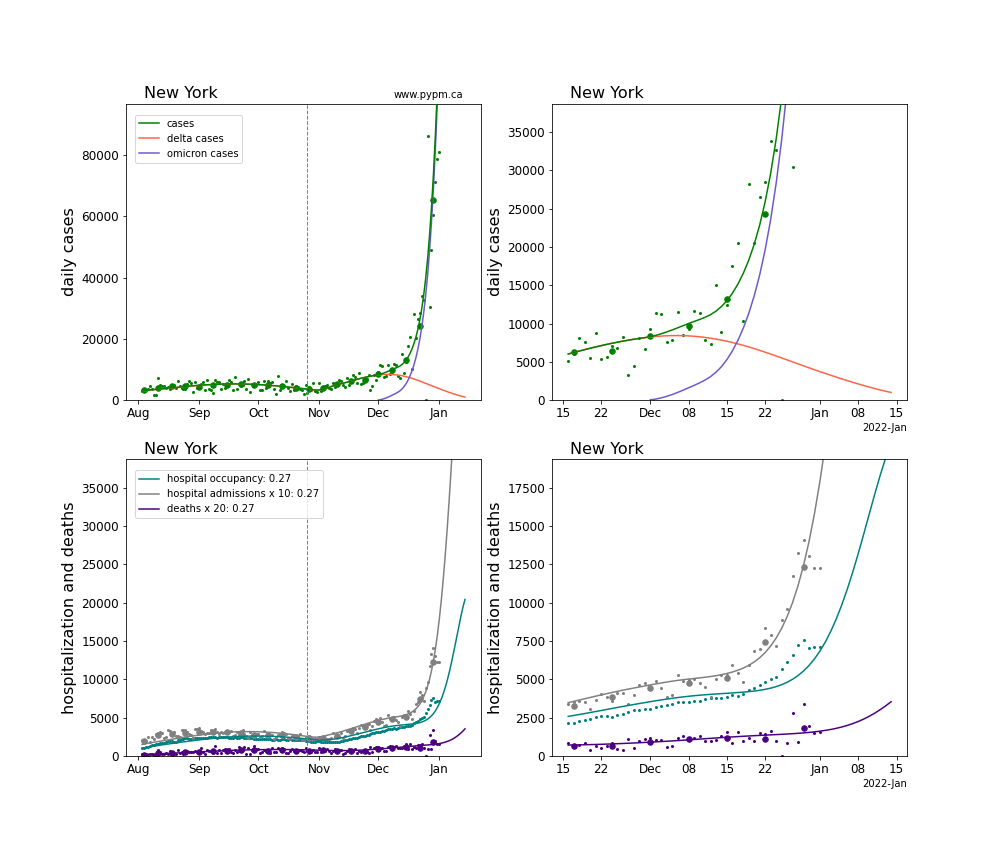
New York
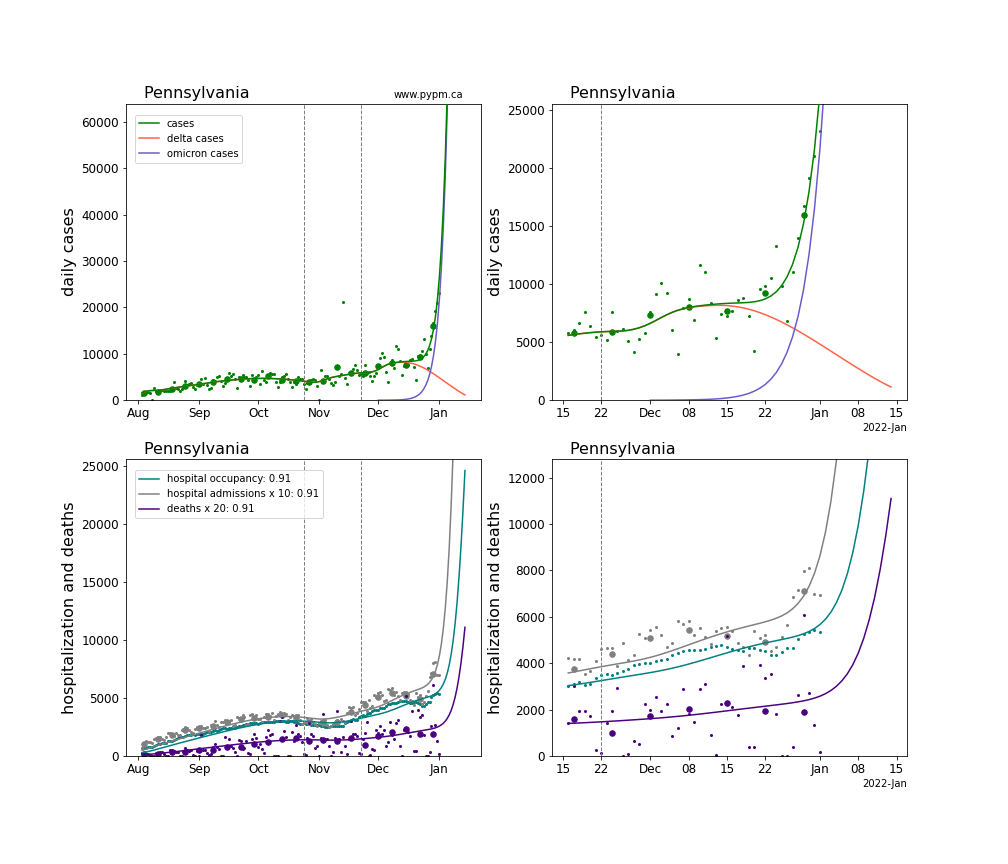
Pennsylvania
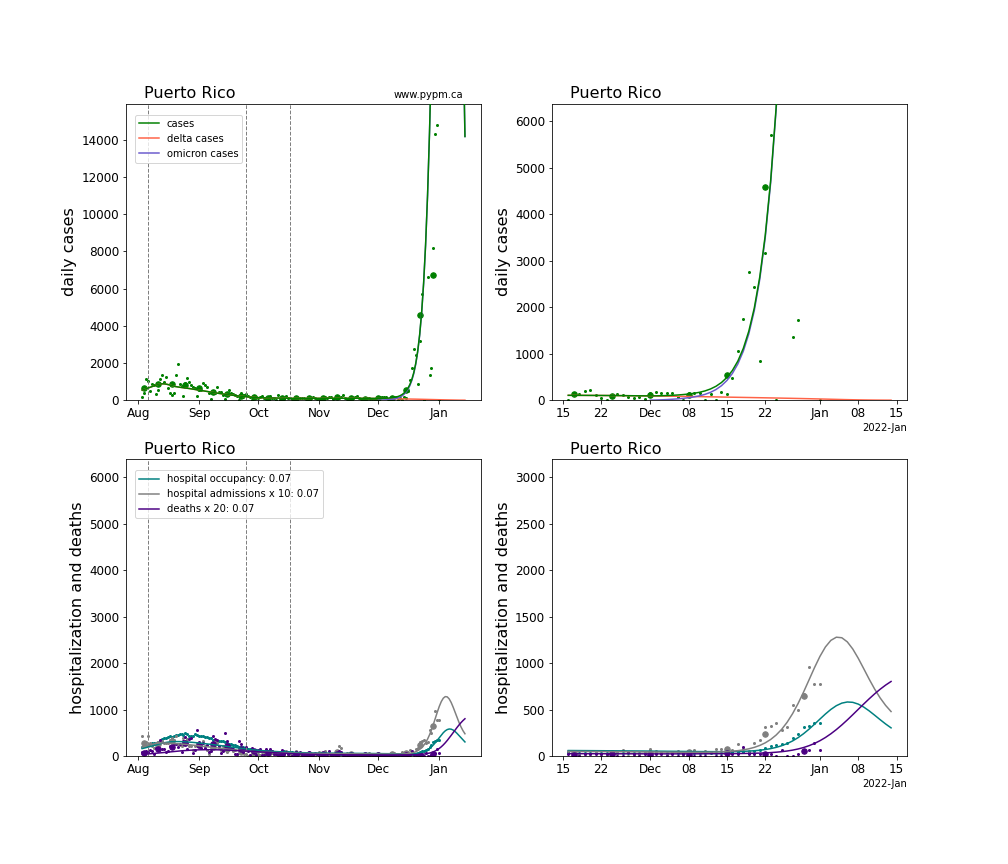
Puerto Rico
Texas
Virginia
Alternative analysis
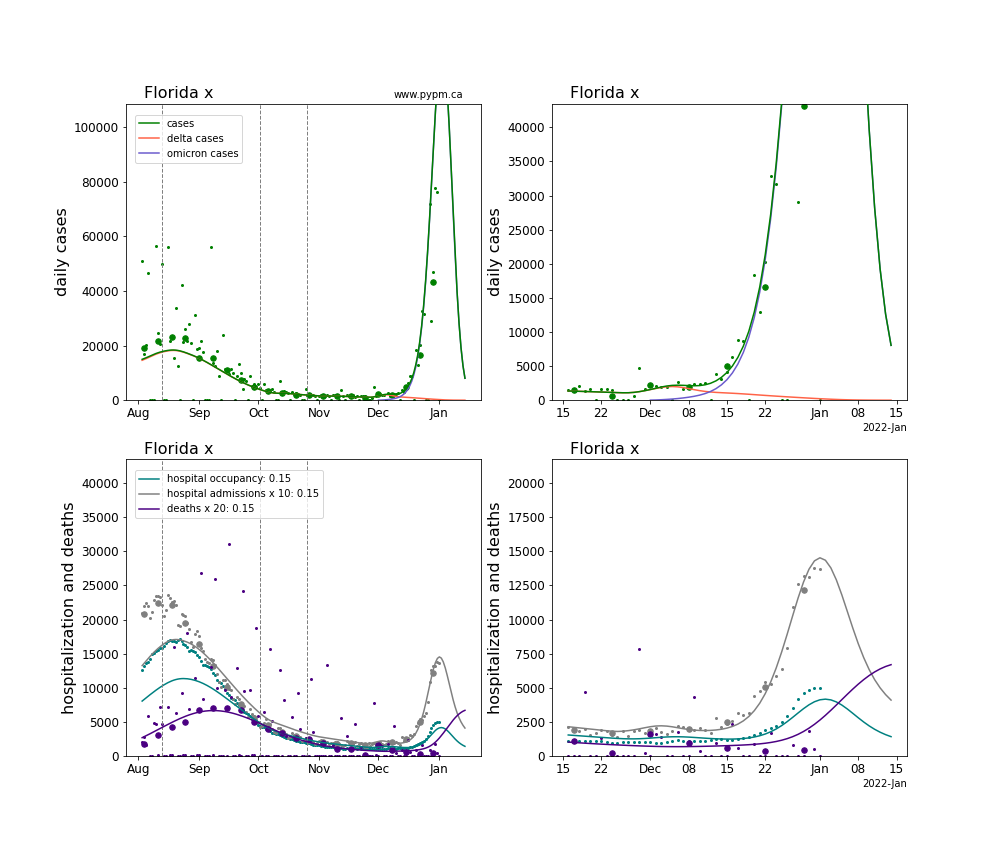
Case data will be difficult to interpret as testing capacity limits may have been reached in many jurisdictions. Hospital admission data can be used in place of case data to monitor the growth rate of omicron infections. It does not suffer a significant lag time compared to cases, but may soon be affected by capacity limits and possible changes to hospital admission criteria. The onset of herd immunity would be indicated by a slowing of the growth rate in infections, and therefore a slowing in the growth rate in hospital admissions. Slowing of hospital admission growth rates can be cause by other factors, so interpretation of hospitalization data will also be difficult.
For two states in which omicron has been dominant for some period (Florida and Hawaii), the hospital admission rates appear to have slowed in the past weeks. While this could be related to the holiday season, an alternative analysis is performed, that assumes that herd immunity is being reached sooner than the nominal model prediction. A possible reason for early herd immunity include spatial heterogeneity playing a larger role due to the rapid transmission of omicron. The alternative analysis implements more rapid herd immunity by scaling the fraction of cases leading to severe symptoms (leading to testing) by the factor of 0.2. In other words, the rate of infections is 5 times higher than assumed in the nominal model.
With another week of data, one (or both) of these models may be ruled out.
Florida nominal
Florida alternative
Hawaii nominal
Hawaii alternative
