September 21, 2021 Analysis of Canadian provincial data
This summarizes analyses of data from the Canadian provinces with substantial cases. The model includes additional infection cycles to represent the alpha and delta variants of concern. Past vaccination rates are included in the models.
Current fits to data
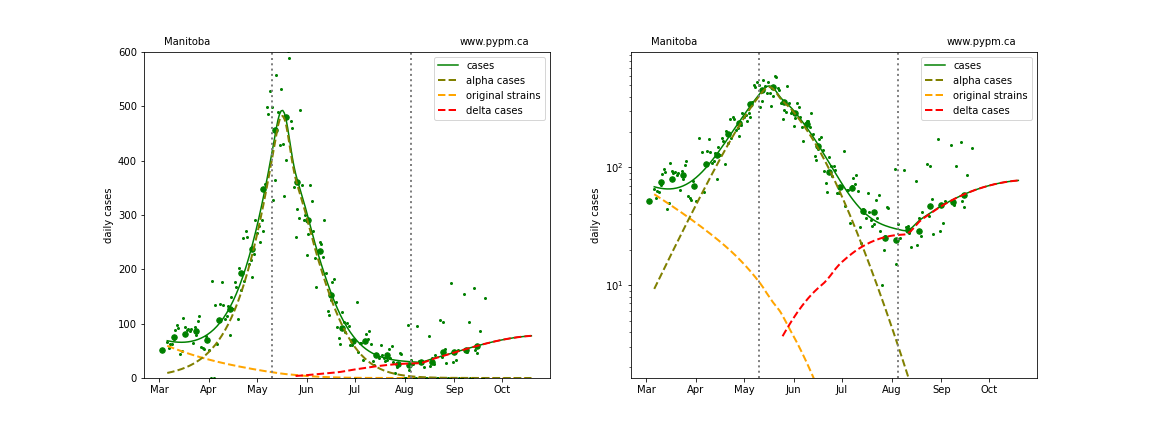
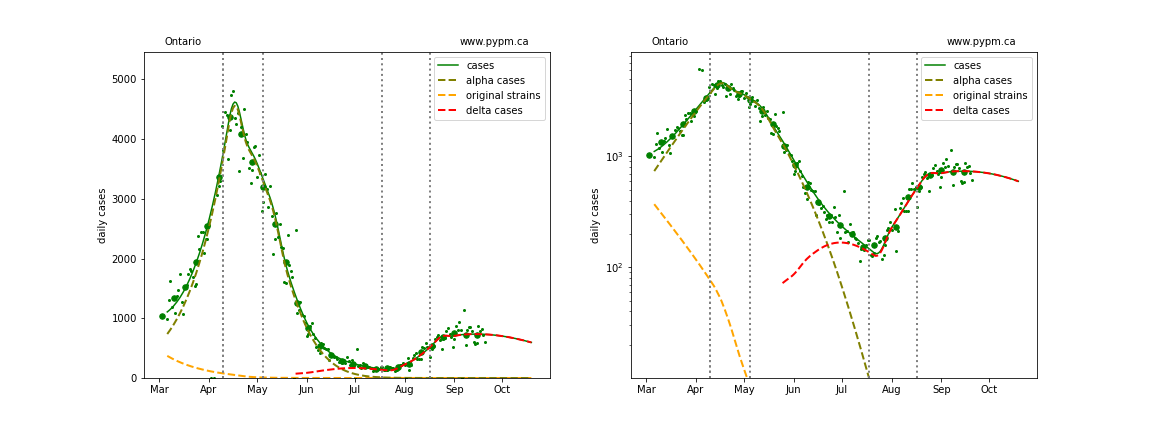
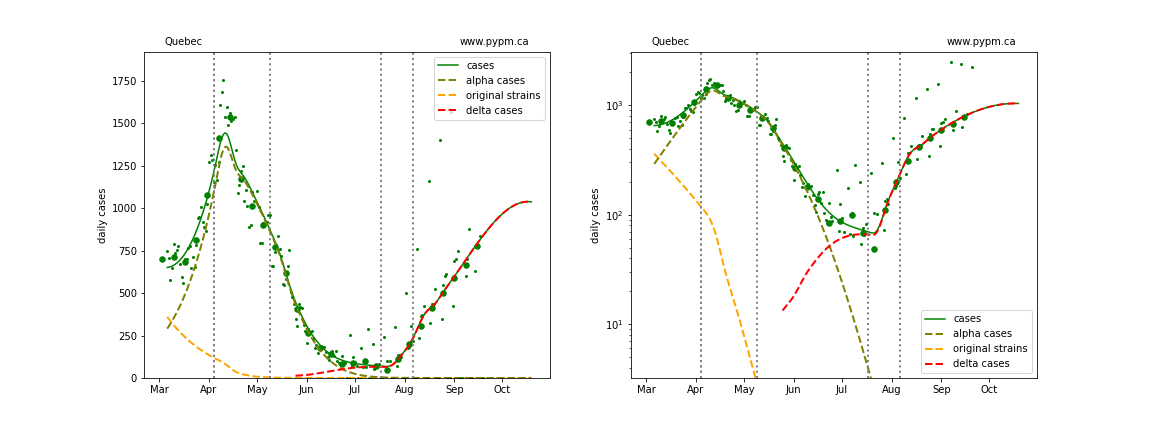
Apart from BC and Manitoba, the other large provinces were recently experiencing rapid growth in cases. Growth rates (measured in % per day) are slowly declining in all provinces.
European nations have experienced similar transitions to rapid growth due to delta and several have been able to reduce or turn the growth around. The rapid growth was also seen in all US states, and the growth continued for a long period of time, before recently subsiding. Model fits to EU and US states can be found here.
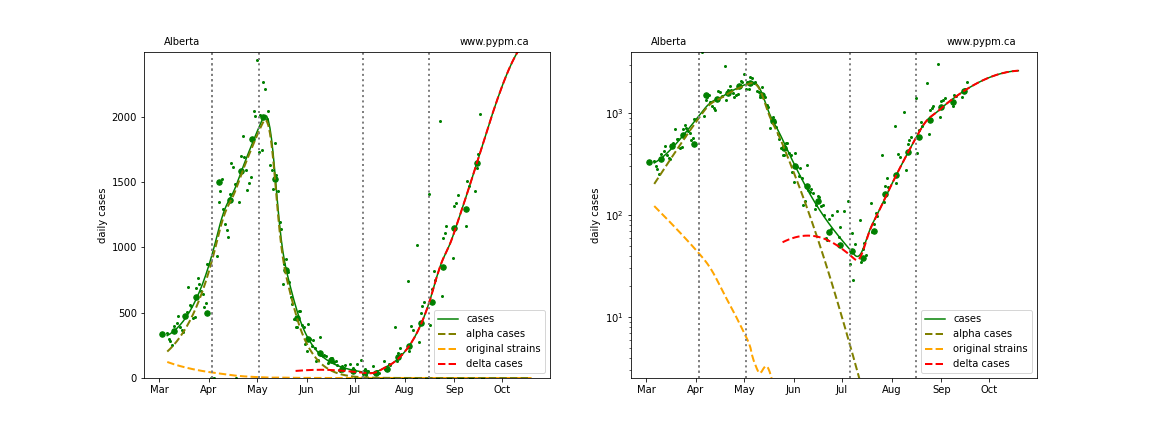
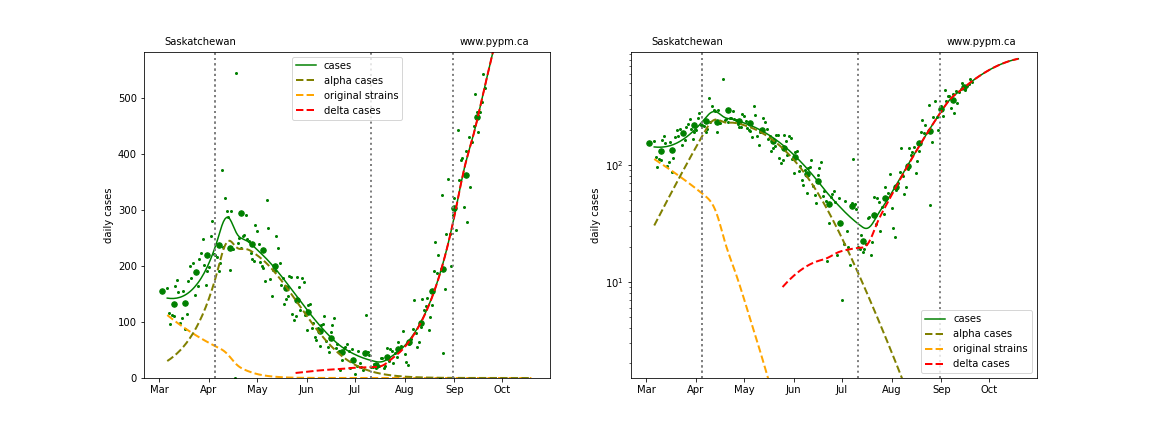
Updated model fits to provincial data are shown below on linear and log-scale:
BC
Detailed BC analyses are reported in the BC analysis page.
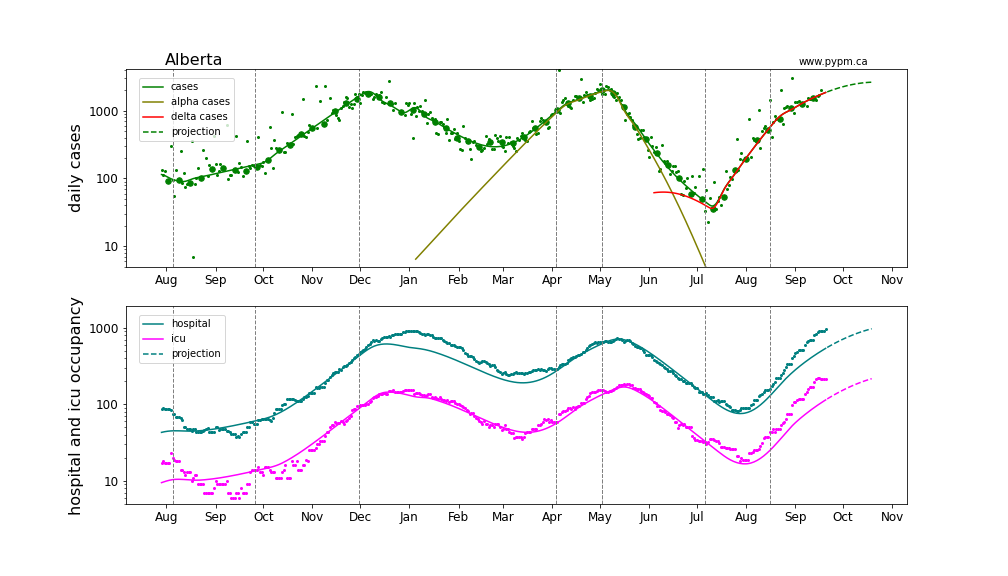
Alberta
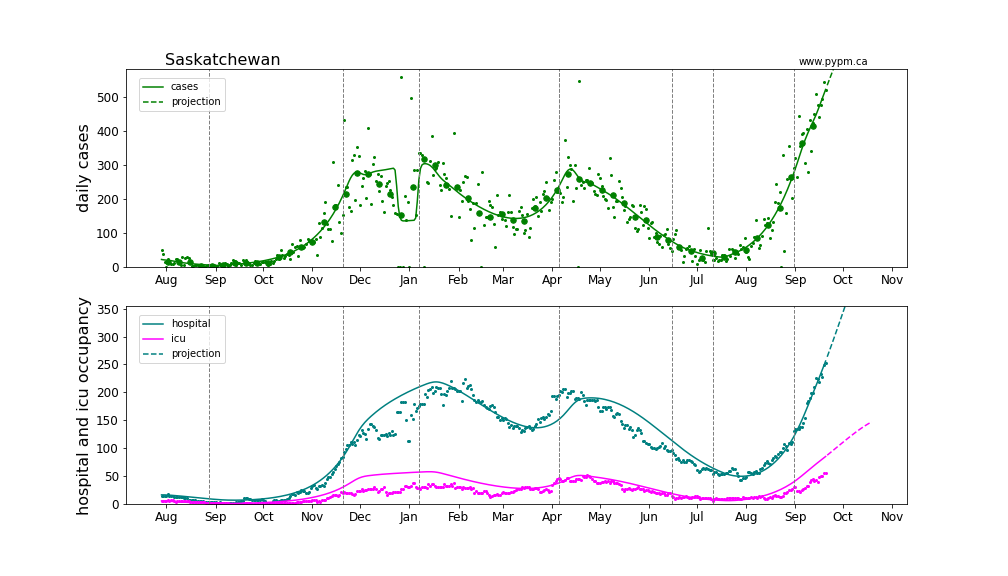
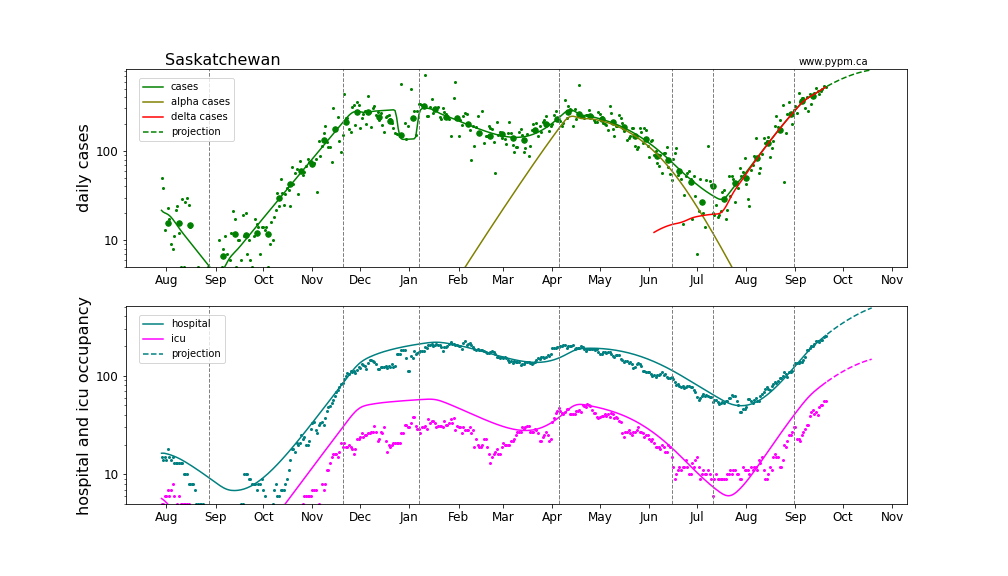
Saskatchewan
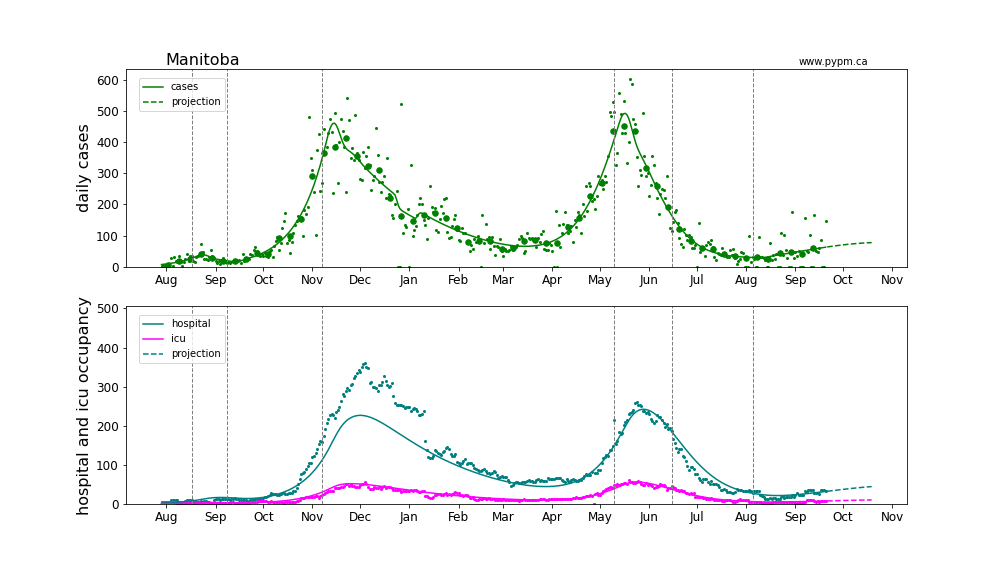
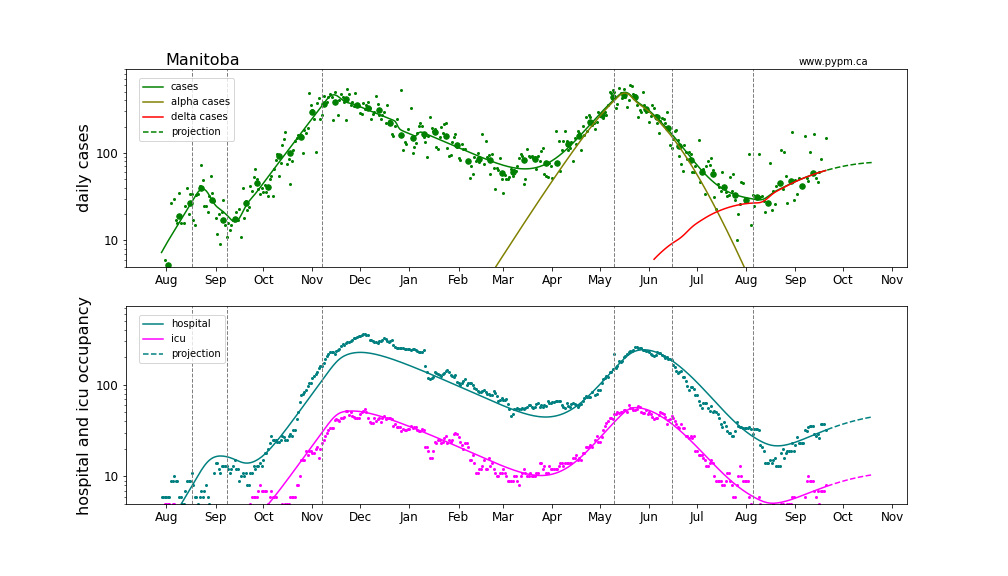
Manitoba
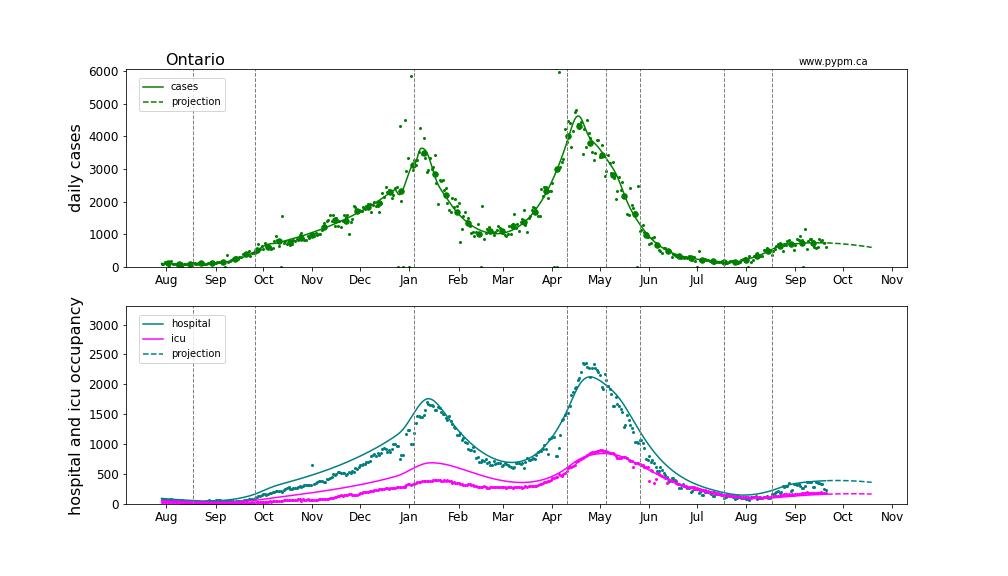
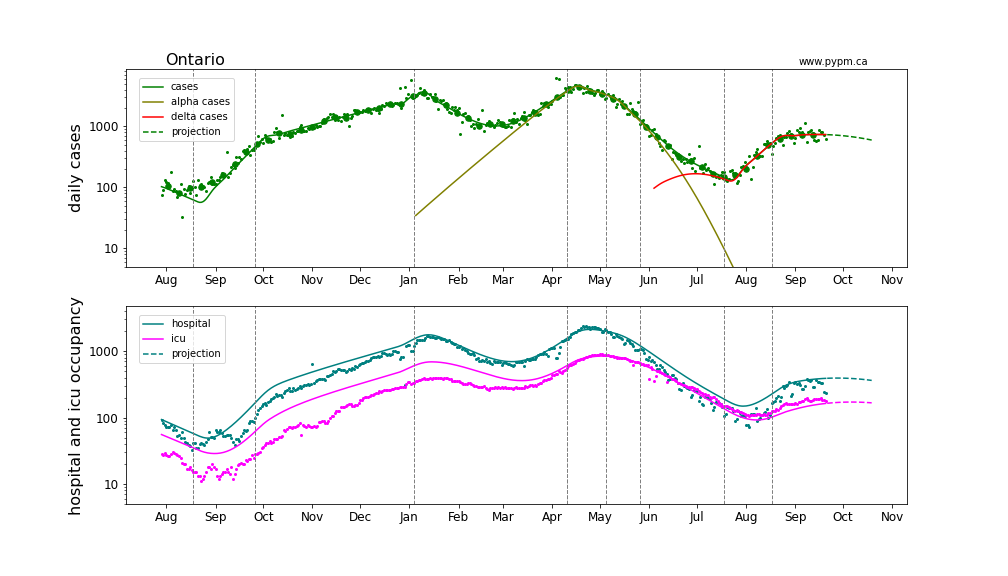
Ontario
Quebec
Current growth rate
The table below indicates the growth rates (% per day) for each province for recent analyses
| Rpovince | Aug 30 | Sep 7 | Sep 13 | Sep 21 |
|---|---|---|---|---|
| BC | +2% | +1% | +1% | 0% |
| Alberta | +6% | +4% | +2% | +2% |
| Saskatchewan | +5% | +5% | +4% | +2% |
| Manitoba | - | - | +2% | +1% |
| Ontario | +4% | +3% | +1% | 0% |
| Quebec | +4% | +4% | +2% | +1% |
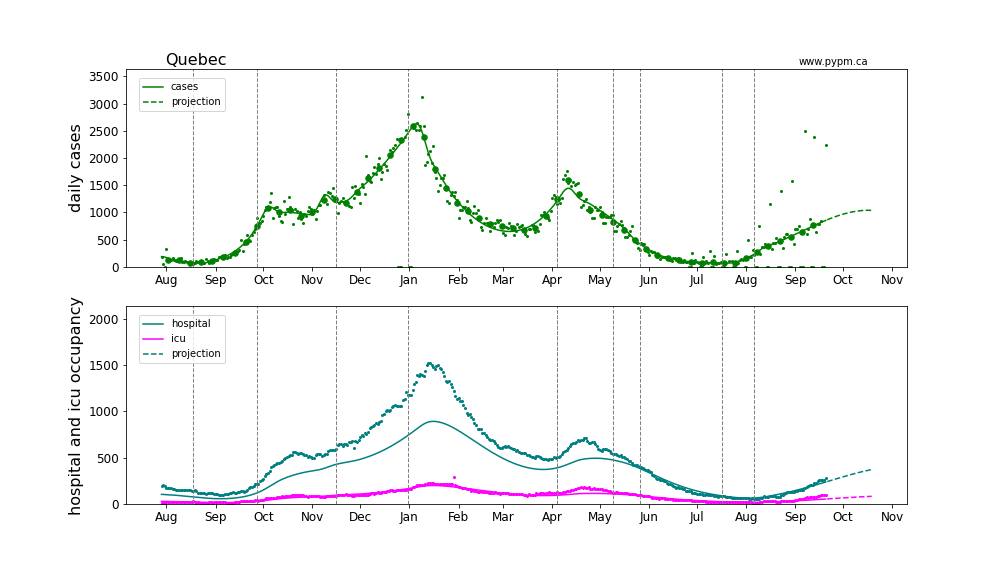
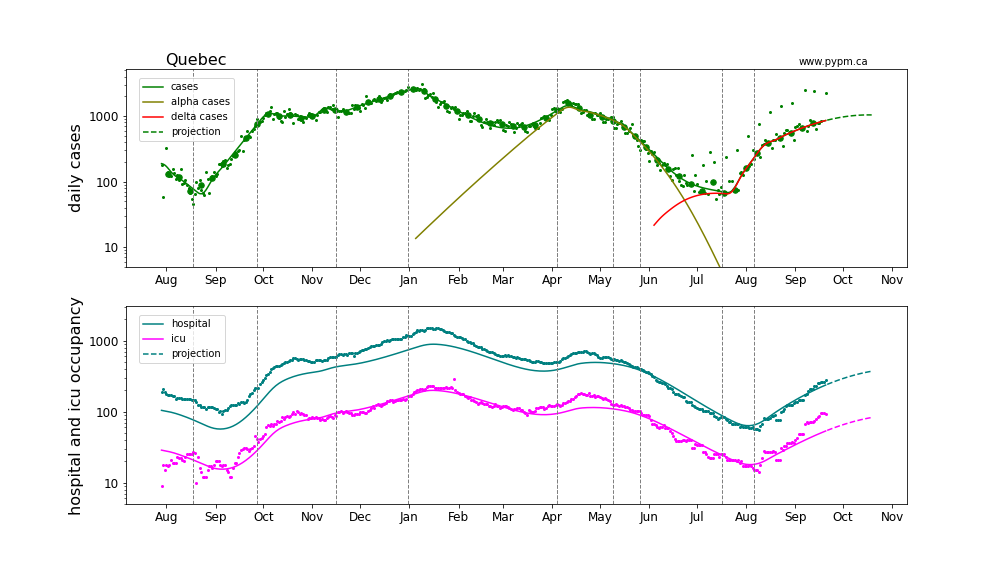
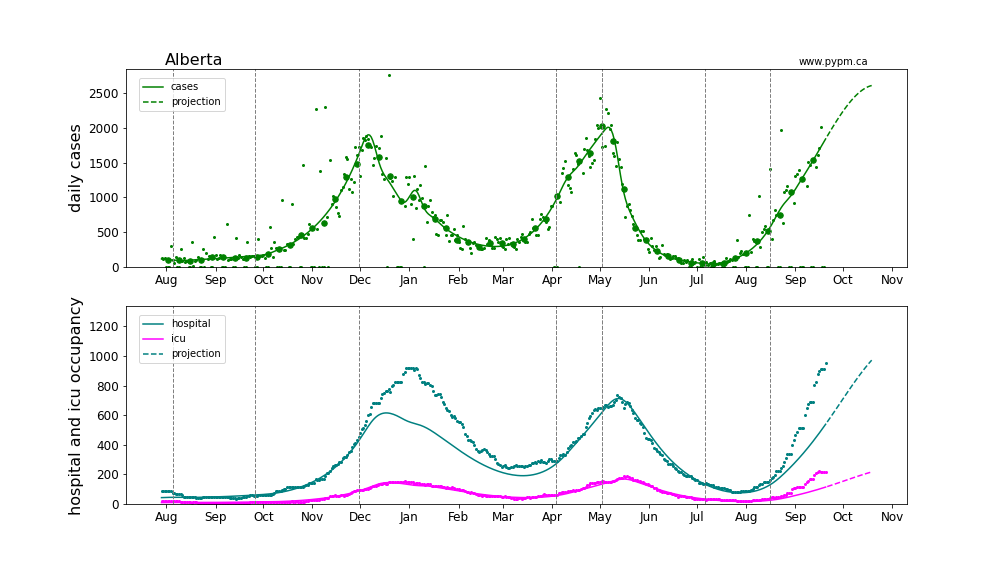
Provincial histories and projections with hospital occupancy
Linear and log scale are shown to see details. Generally, hospitalization is rising in accord with the model projection that assumes the fraction of cases that lead to hospitalization is constant throughout the year.
Alberta
Saskatchewan
Manitoba
Ontario
Quebec