August 24, 2021 Analysis of Canadian provincial data
Reference model 2.9 is fit to data from the Canadian provinces with substantial cases. The model includes additional infection cycles to represent the alpha and delta variants of concern. Past vaccination rates are included in the models.
Current fits to data
All of the large provinces, except Manitoba, are currently experiencing rapid growth in cases. European nations have experienced similar transitions to rapid growth due to delta and several have been able to reduce or turn the growth around. The rapid growth was also seen in all US states, and the growth has continued for a longer period of time, with signs of slowing growth coming only recently in some states. Model fits to EU and US states can be found here.
New model fits to provincial data including transition to rapid growth are shown below on linear and log-scale:
BC
Detailed BC analyses are reported in the BC analysis page.
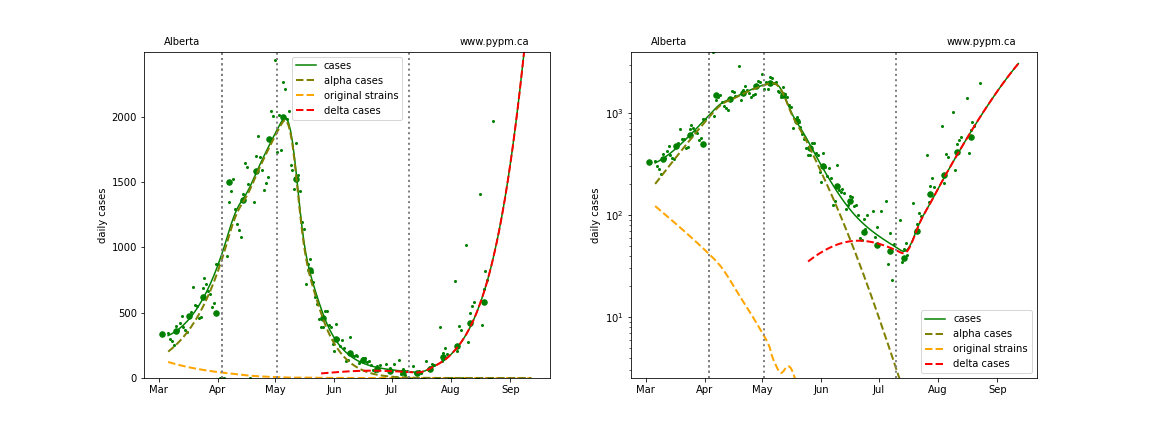
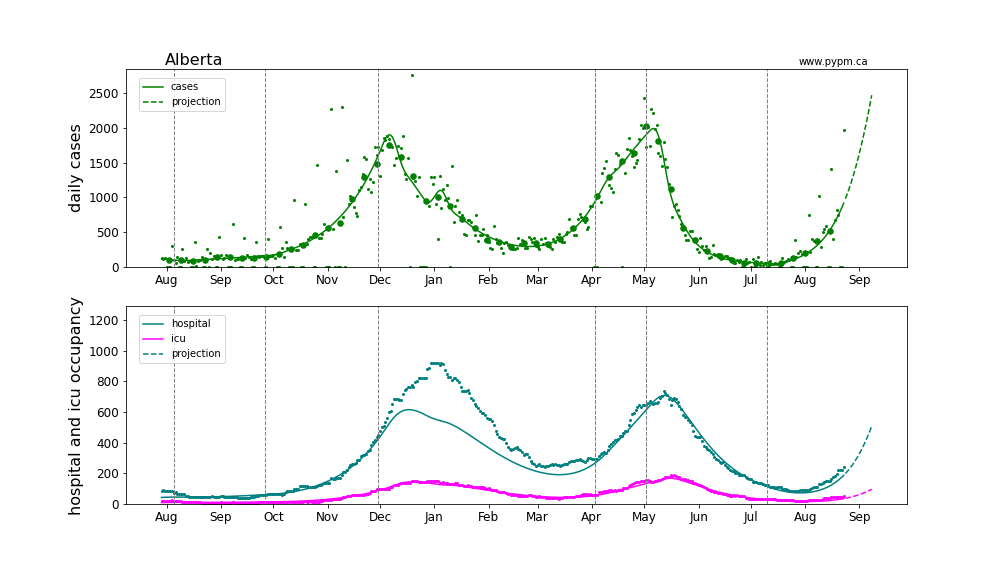
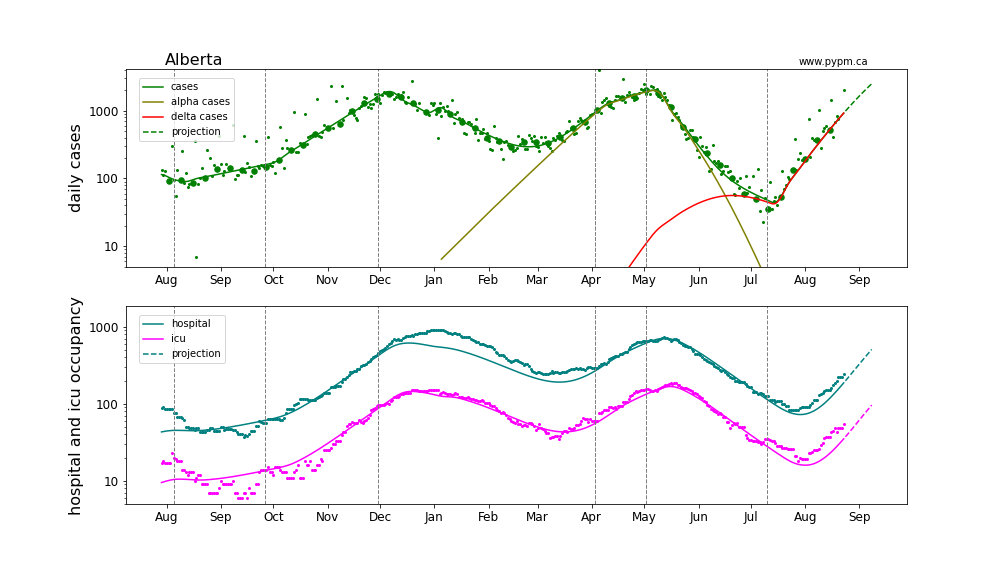
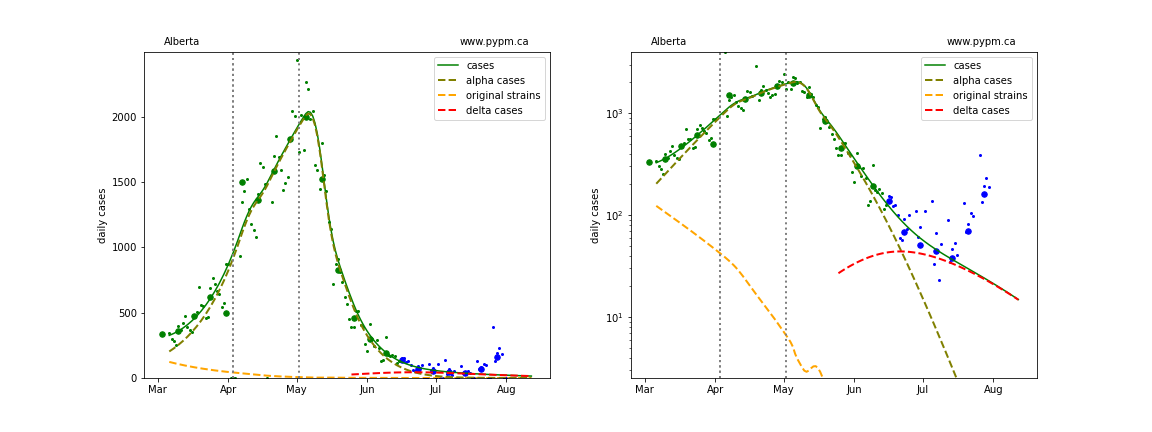
Alberta
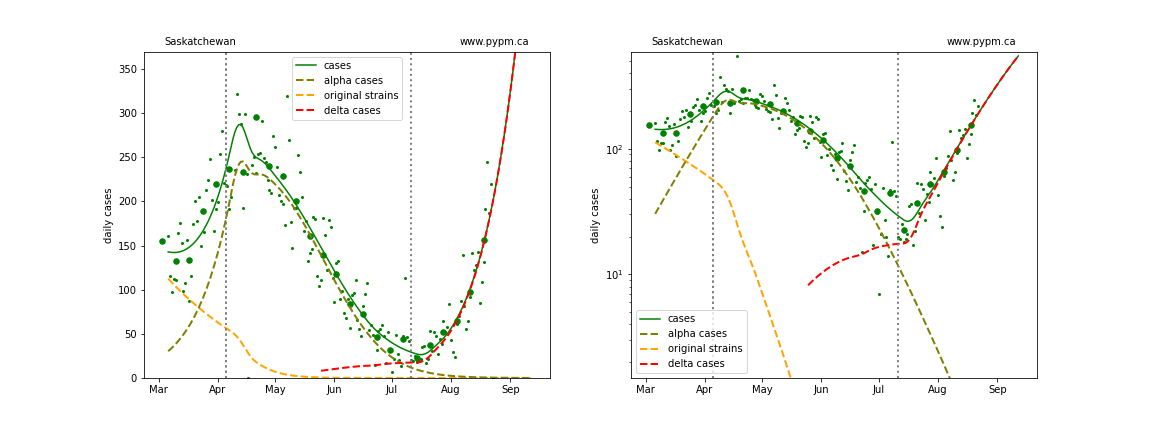
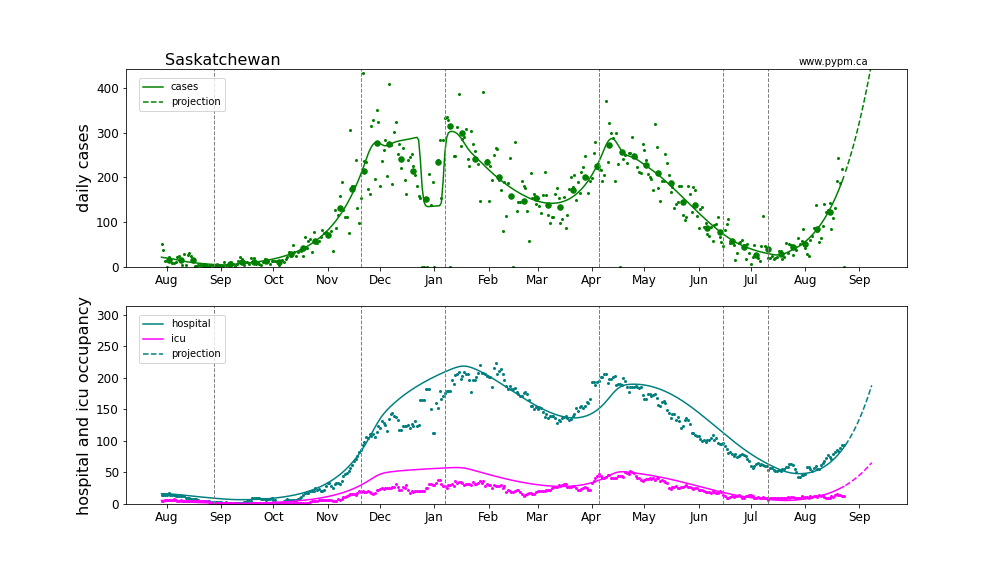
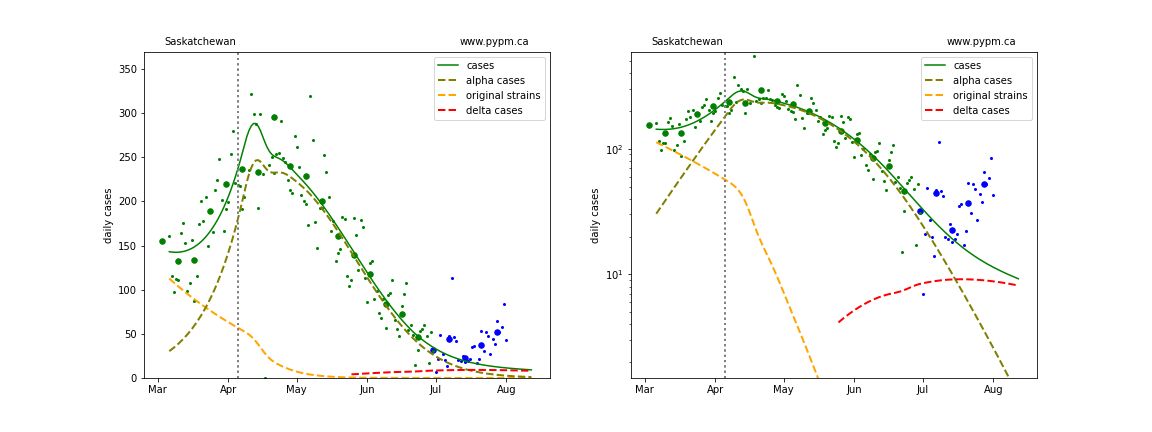
Saskatchewan
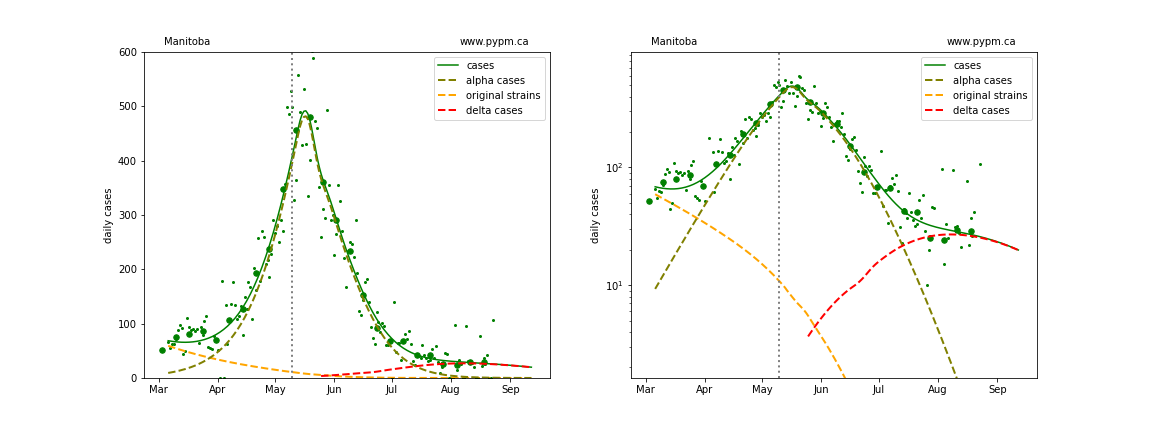
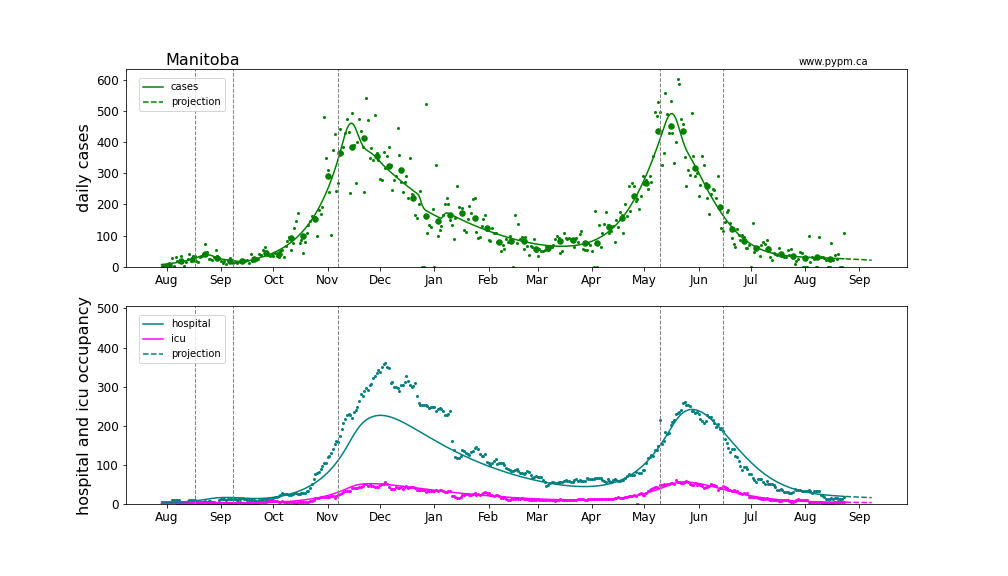
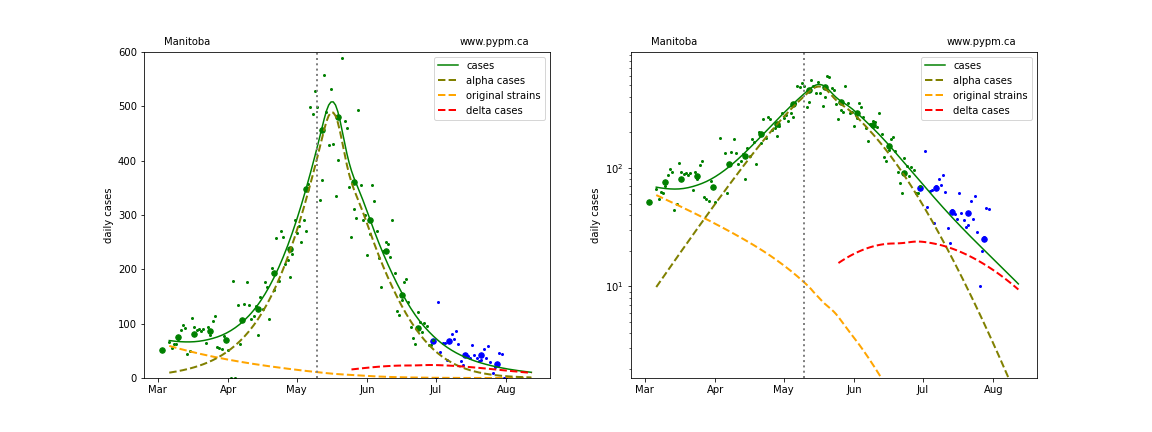
Manitoba
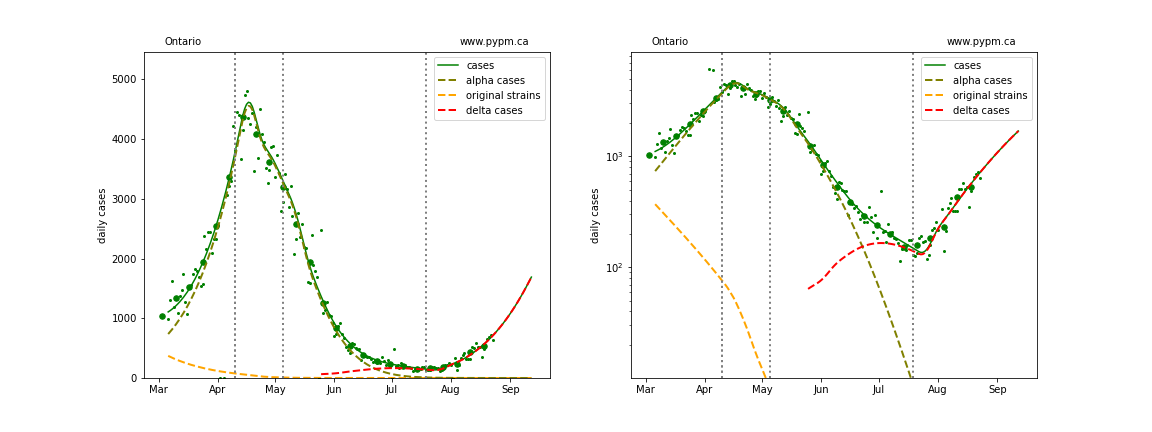
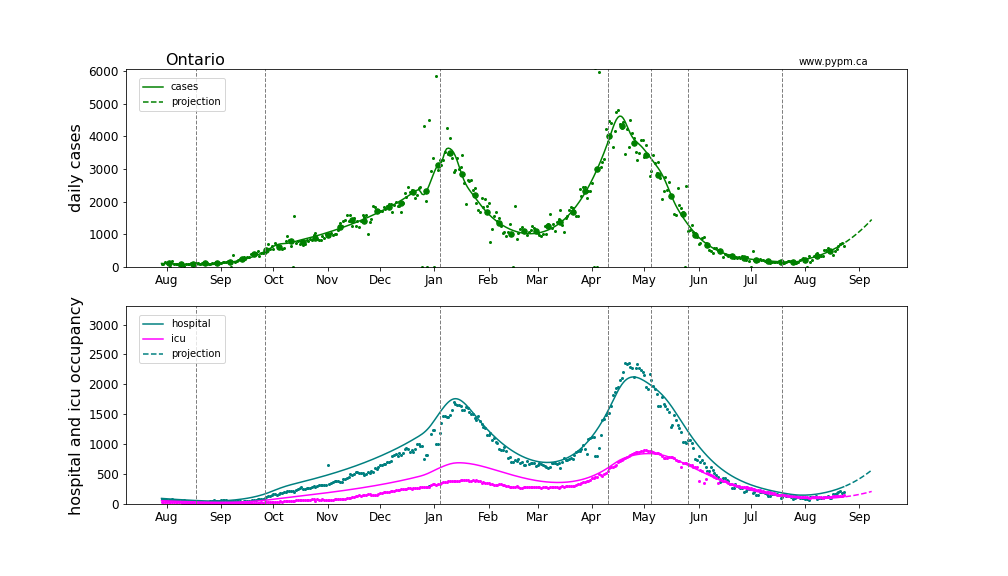
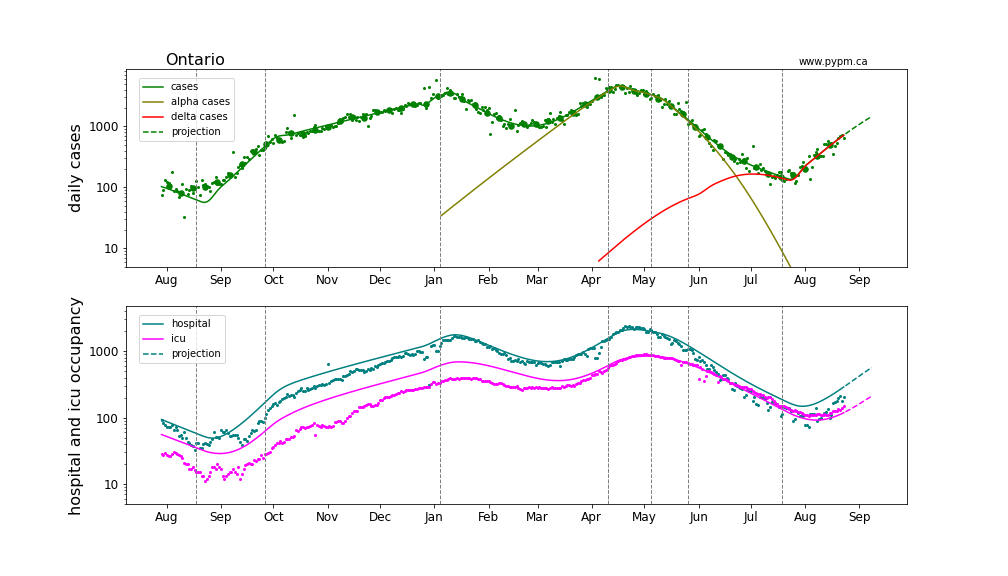
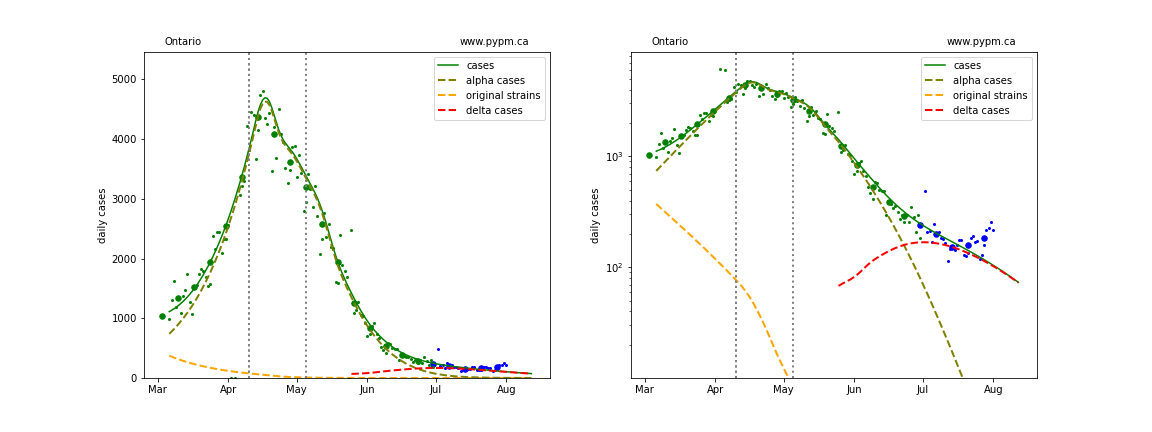
Ontario
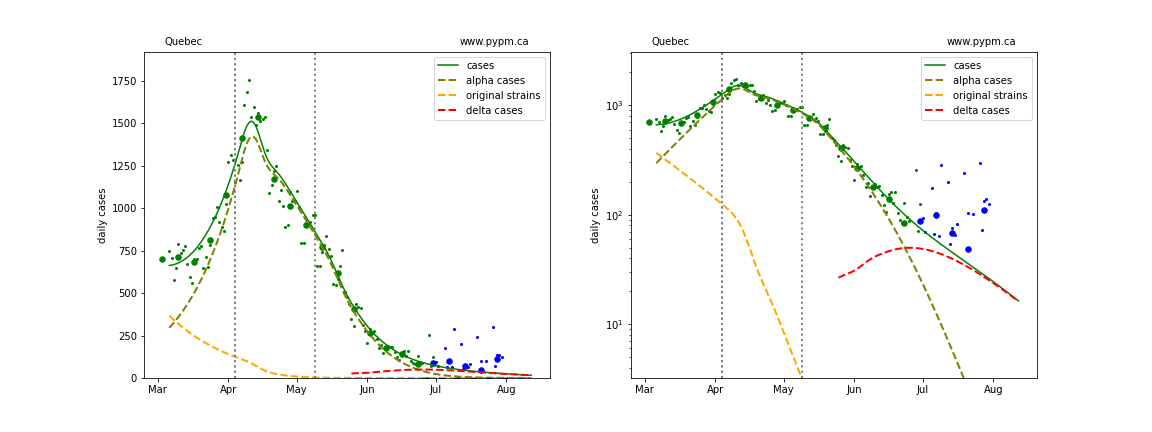
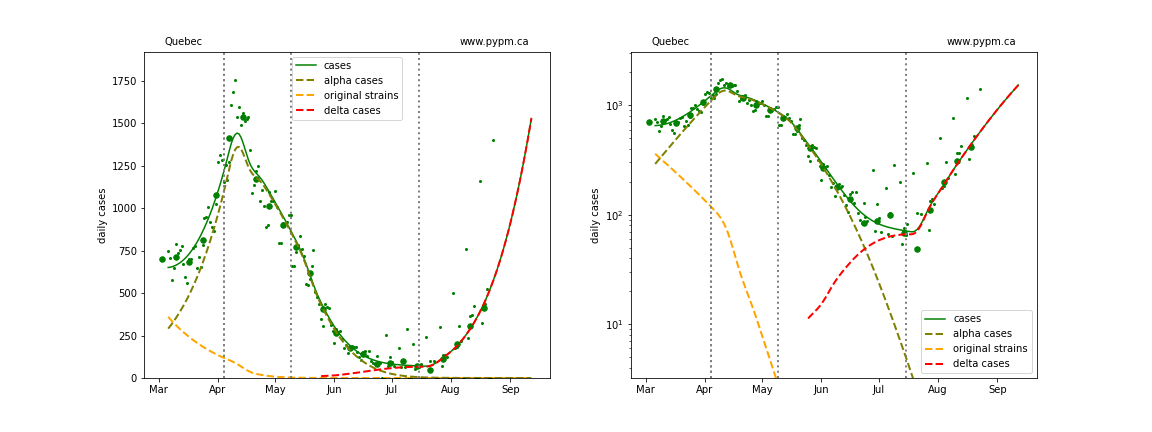
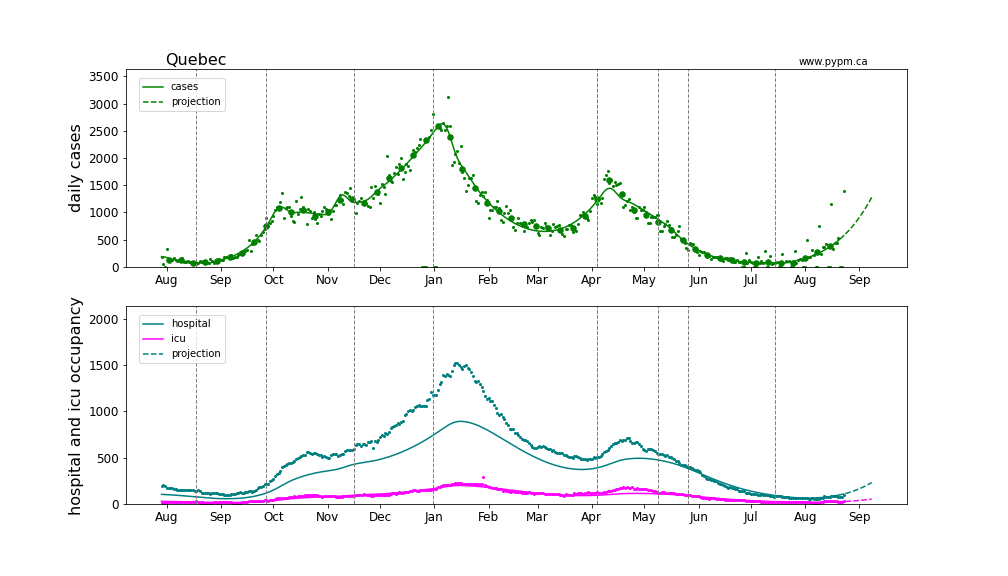
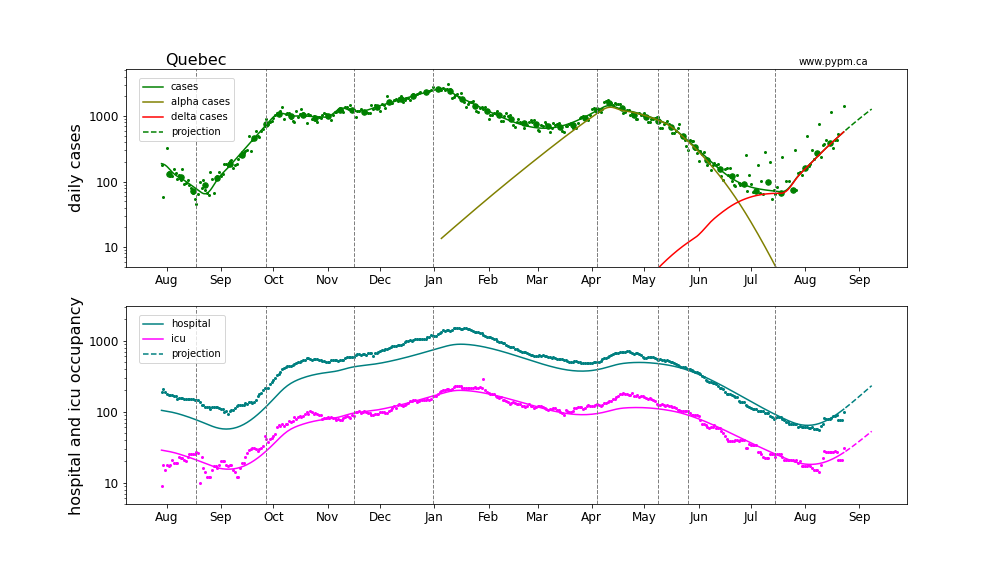
Quebec
Provincial histories and projections with hospital occupancy
Linear and log scale are shown to see details. Generally, hospitalization is rising in accord with the model projection that assumes the fraction of cases that lead to hospitalization is constant throughout the year.
Alberta
Saskatchewan
Manitoba
Ontario
Quebec
Case history compared to June forecasts
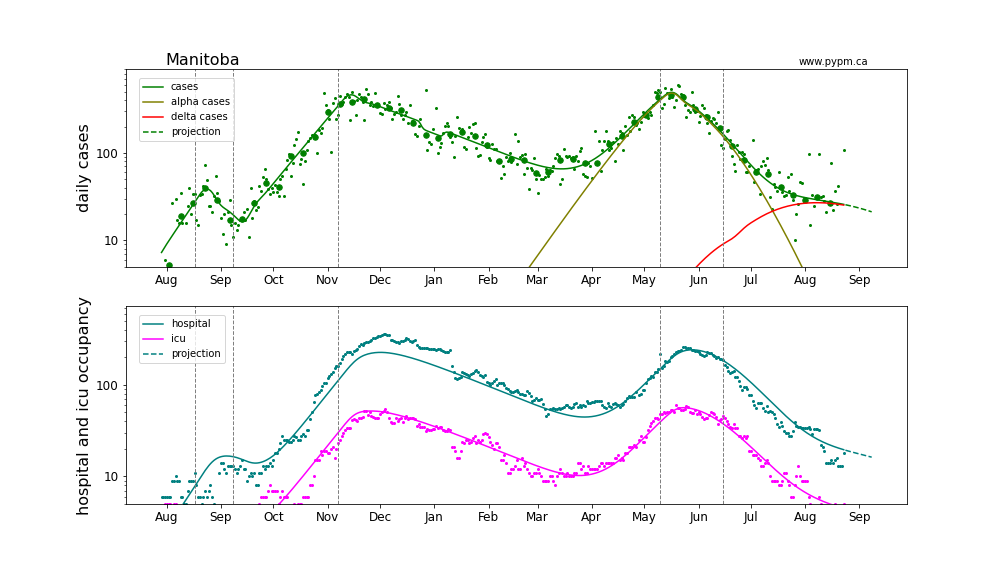
Until mid-July, case rates in the large provinces were in steady decline, following closely forecasts made from mid- to late-June. The situation changed, with case rates significantly exceeding the forecasts except in Manitoba.
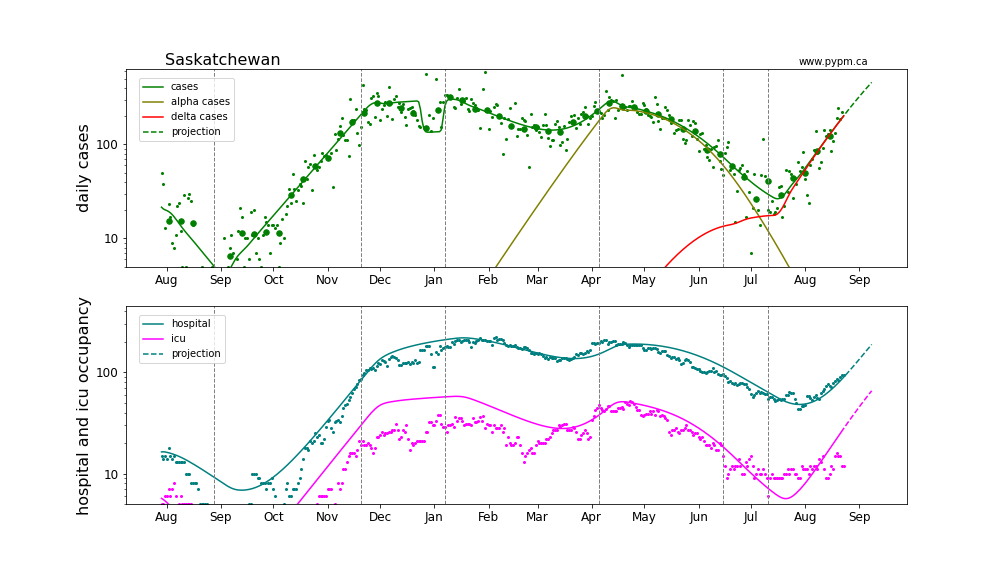
The plots show the daily case numbers (small green points) and the weekly averages of the daily rates (large green dots) for the data used in fitting the model forecast, shown by the smooth green curves. The dashed curves show how the model attributes cases to the original, alpha, and delta variants.
The blue points and dots are data collected after the model fit and forecast was made. The vertical lines indicate the dates in which transmission rates were changed in the model in order to fit case data.
The left graphs are a linear scale and right graphs are log-scale. The log-scale plots better reveal recent trends in case rates.
Alberta
Saskatchewan
Manitoba
Ontario
Quebec