August 15, 2021 Analysis of EU national data
Fits to case data
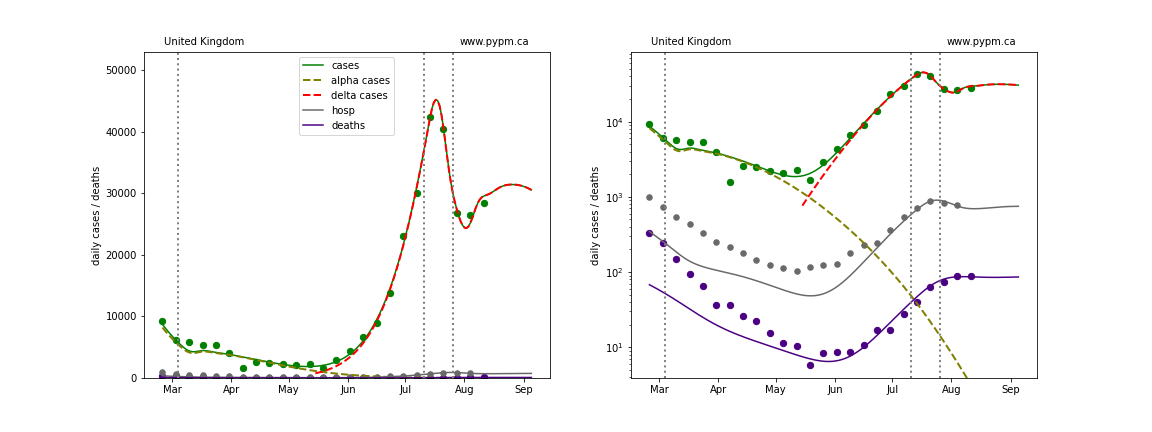
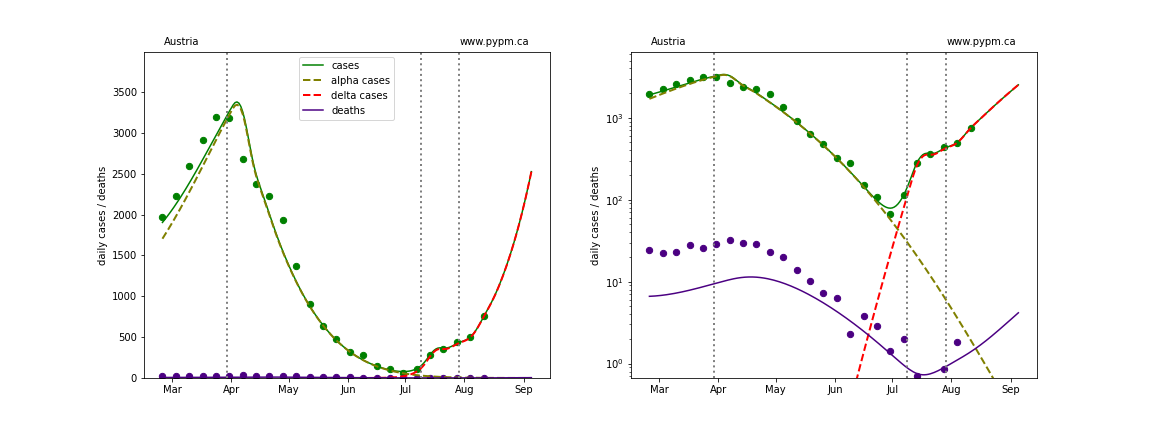
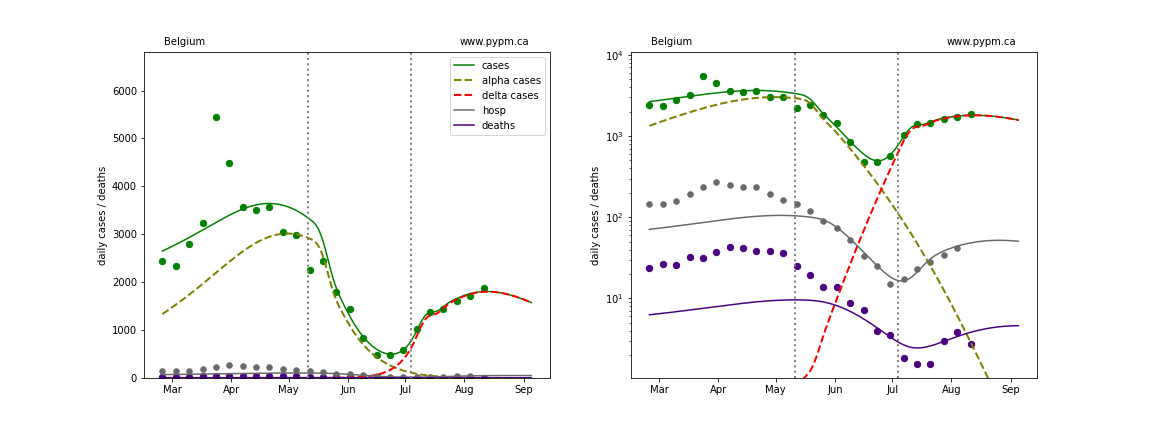
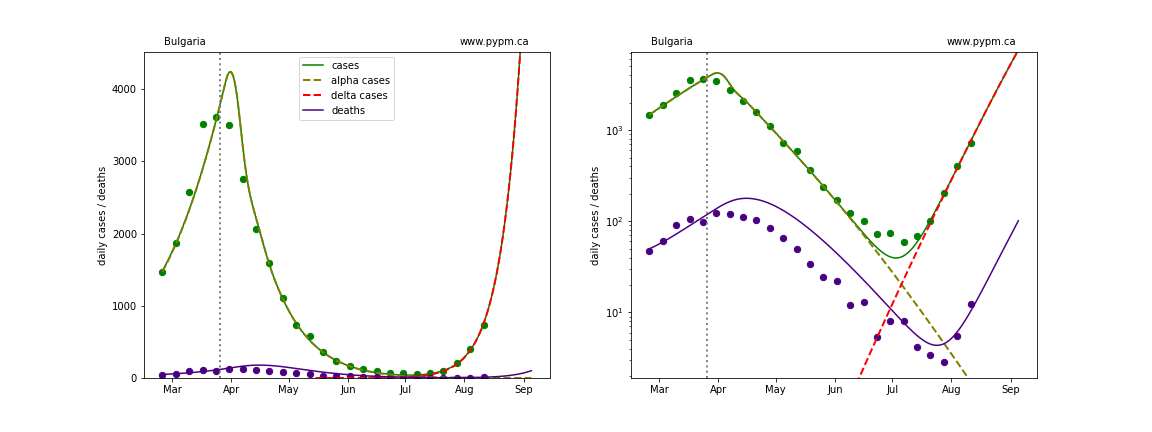
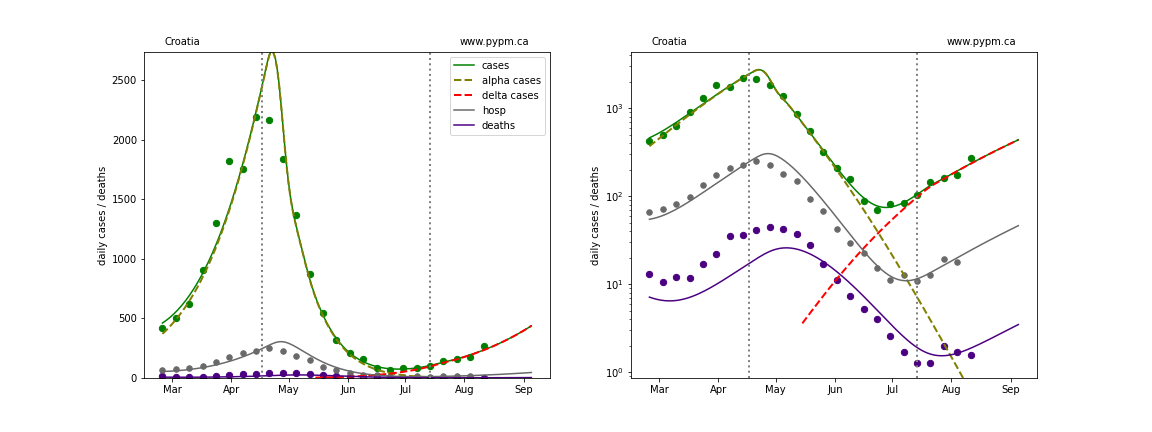
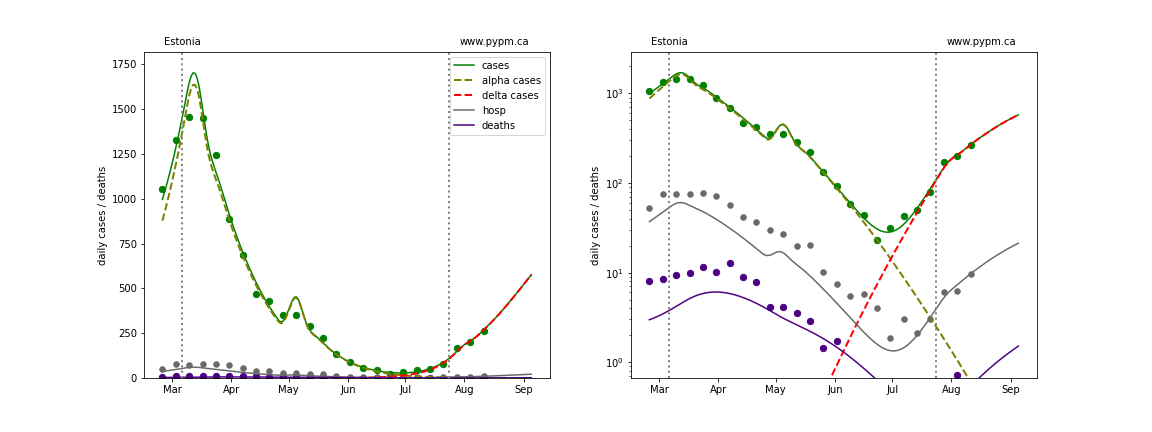
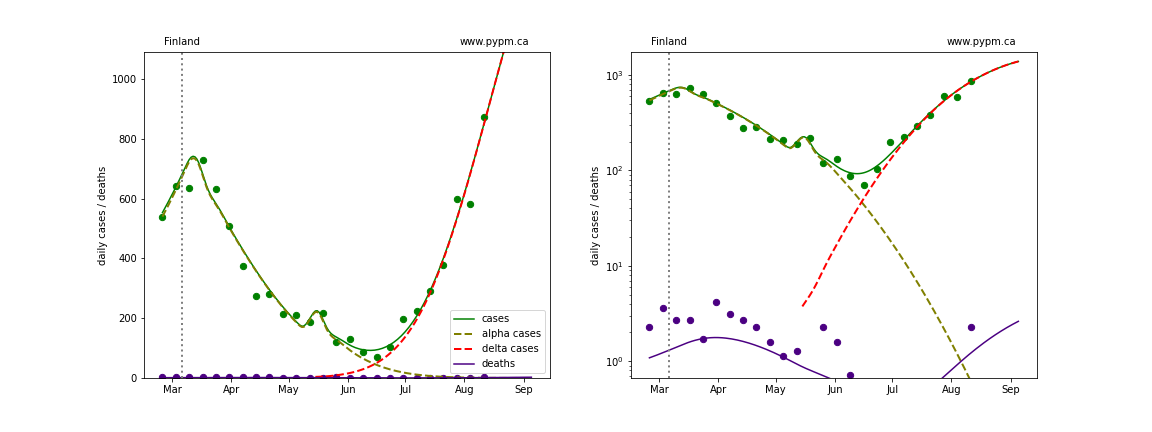
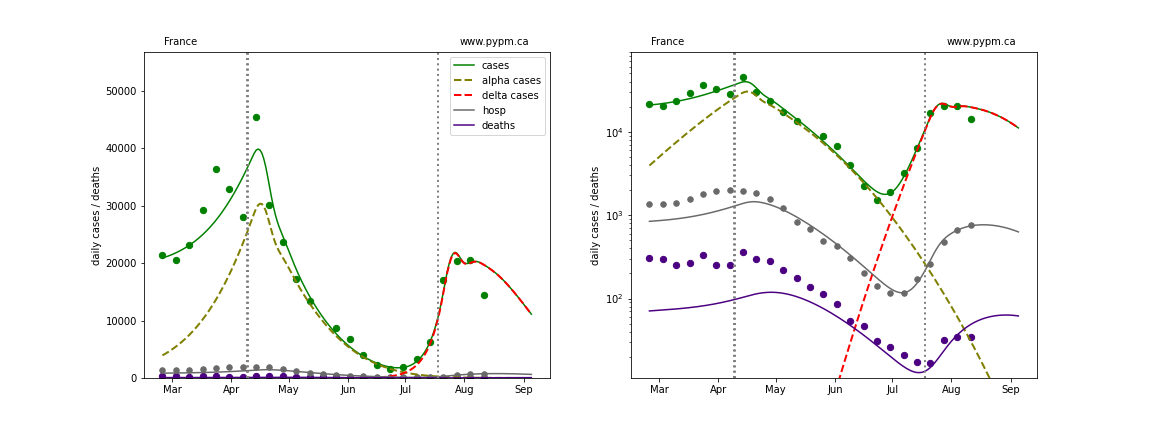
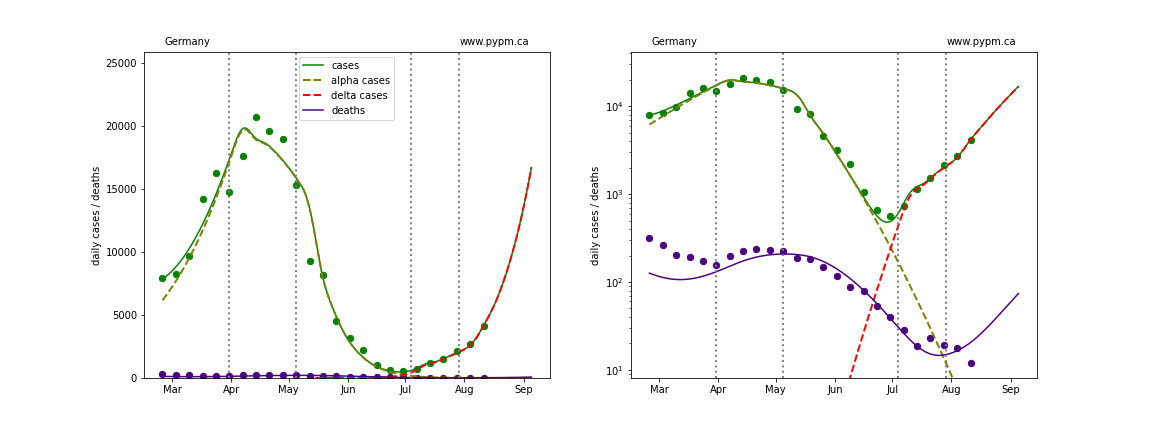
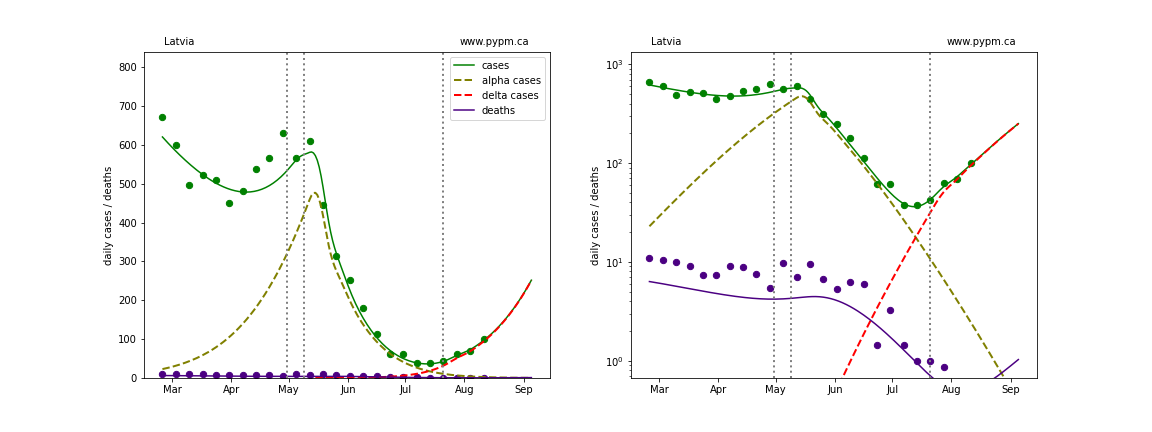
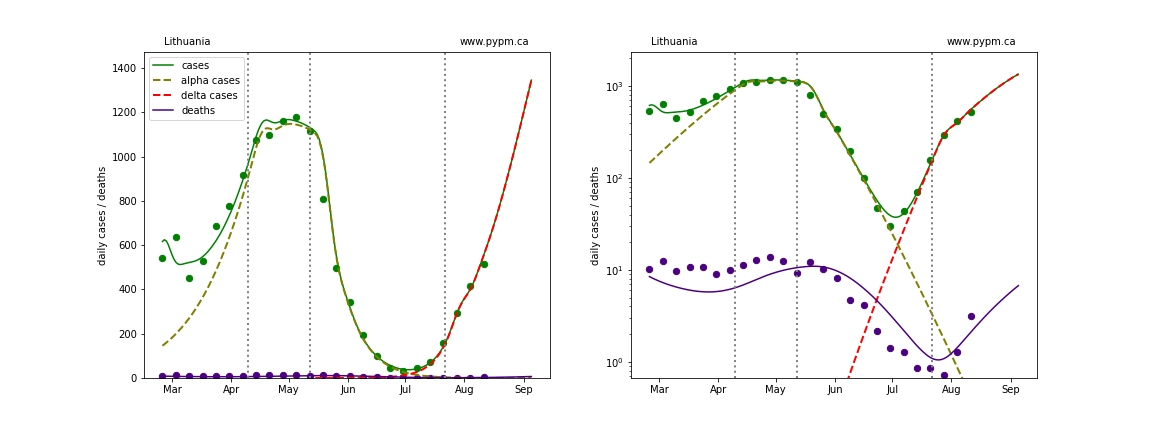
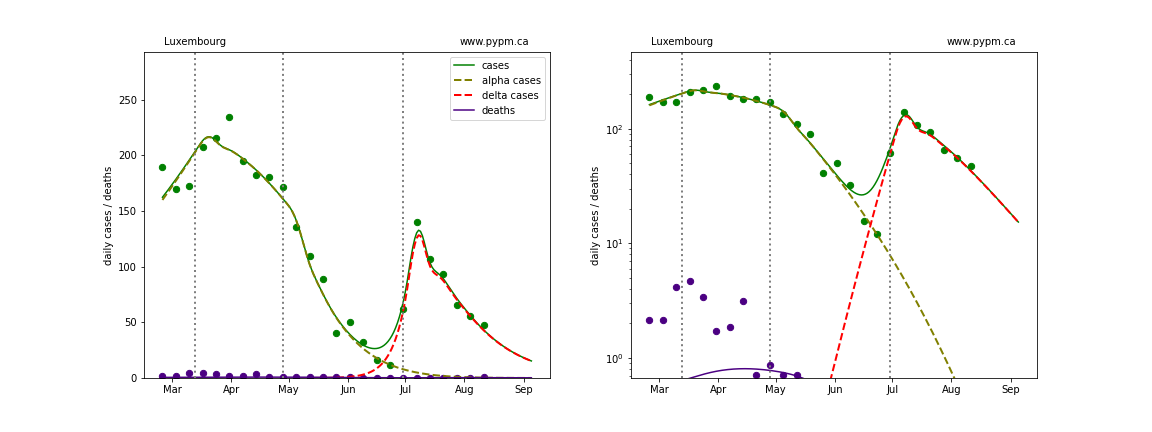
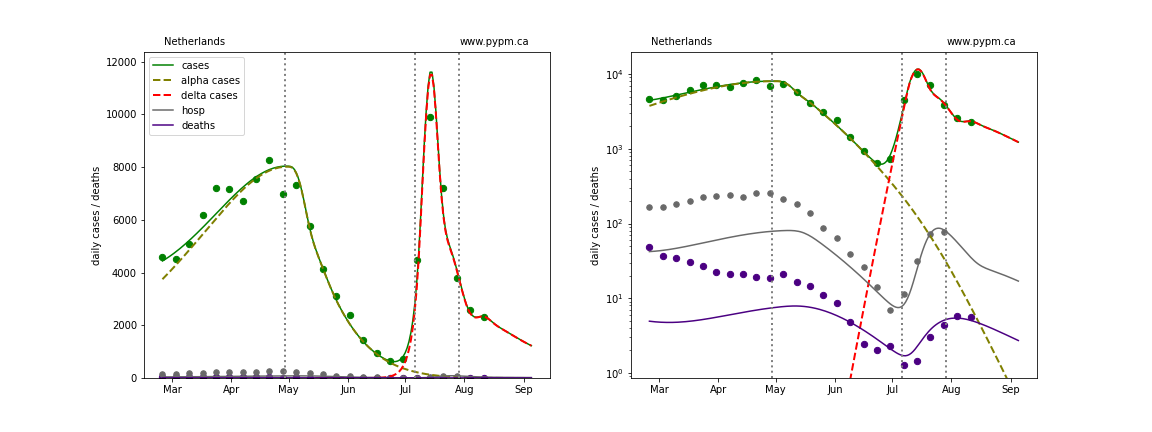
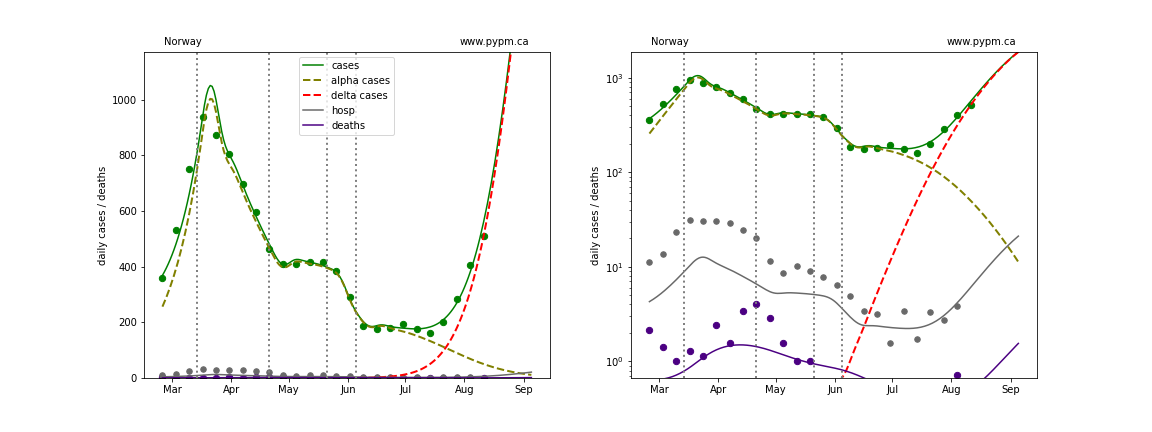
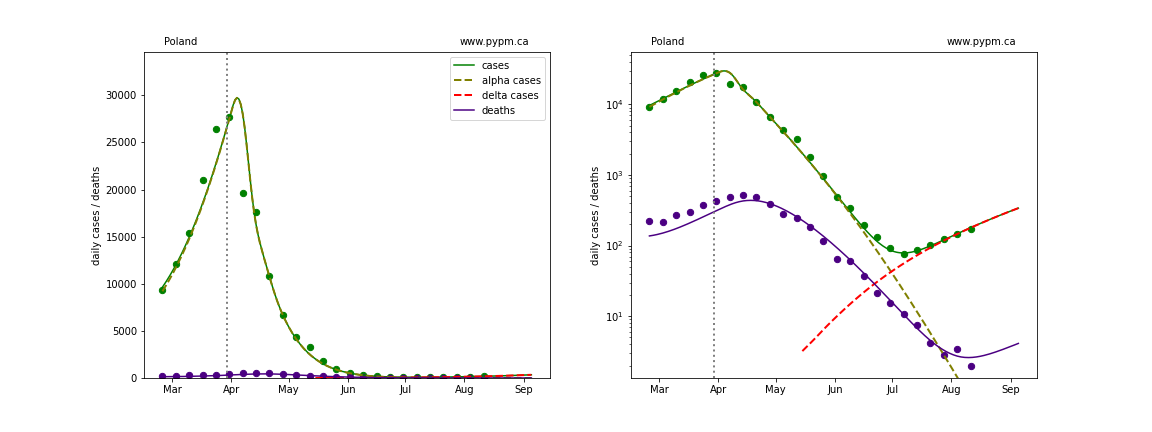
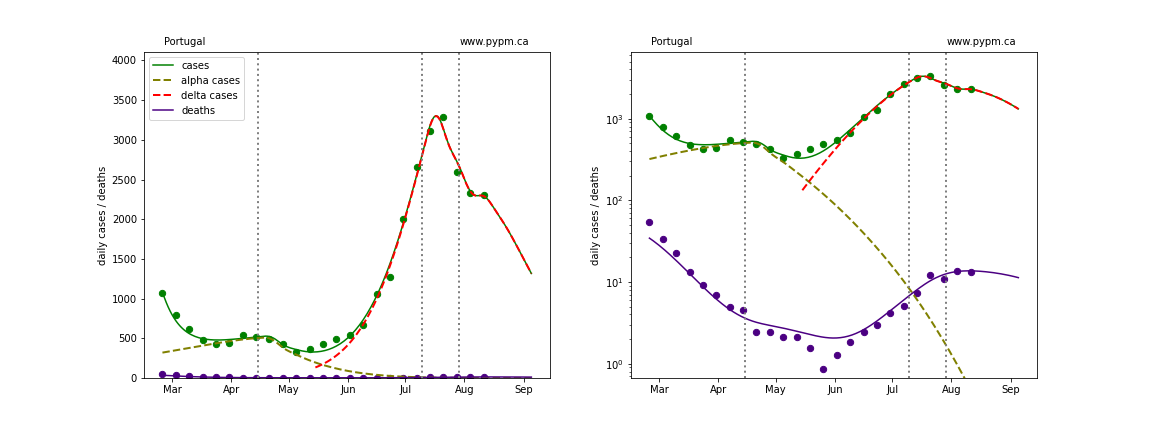
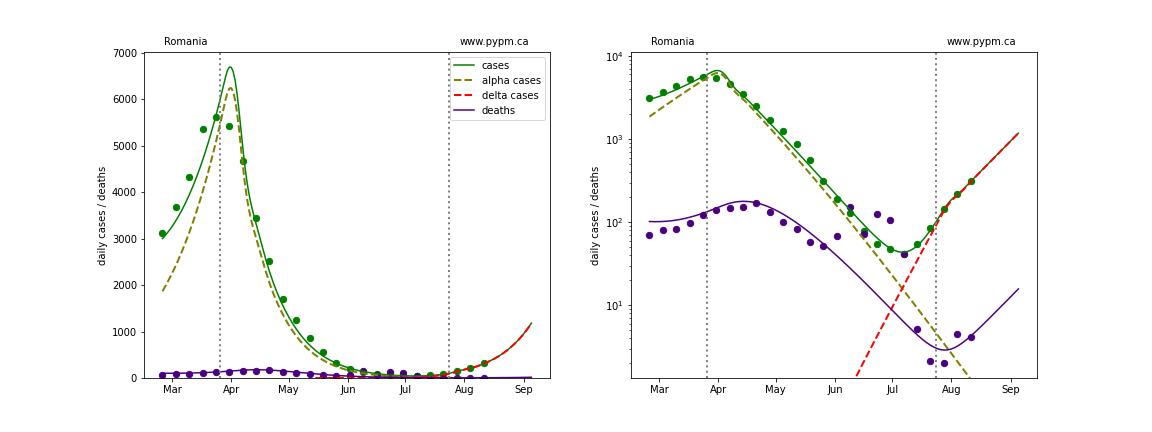
The plots below show the case and death data for 29 EU nations. The data fits were done using data up until August 14, 2021.
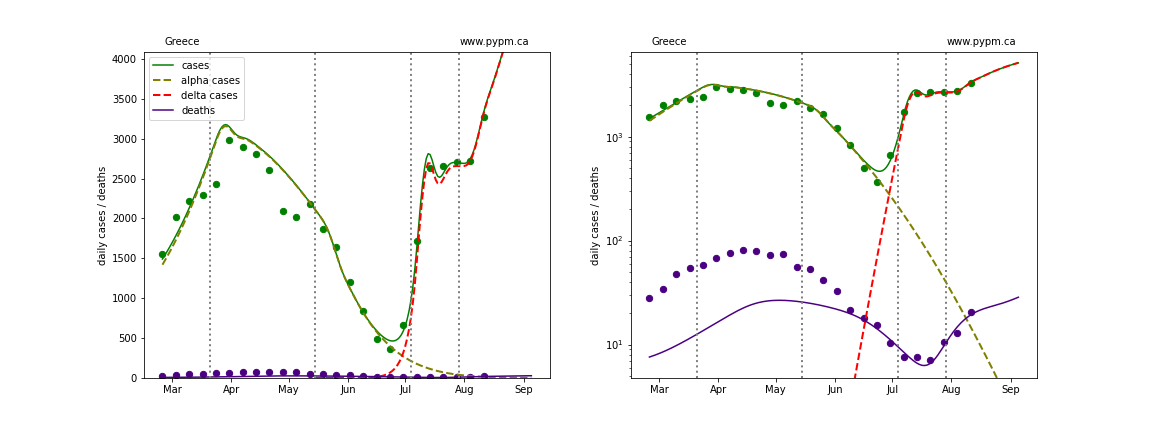
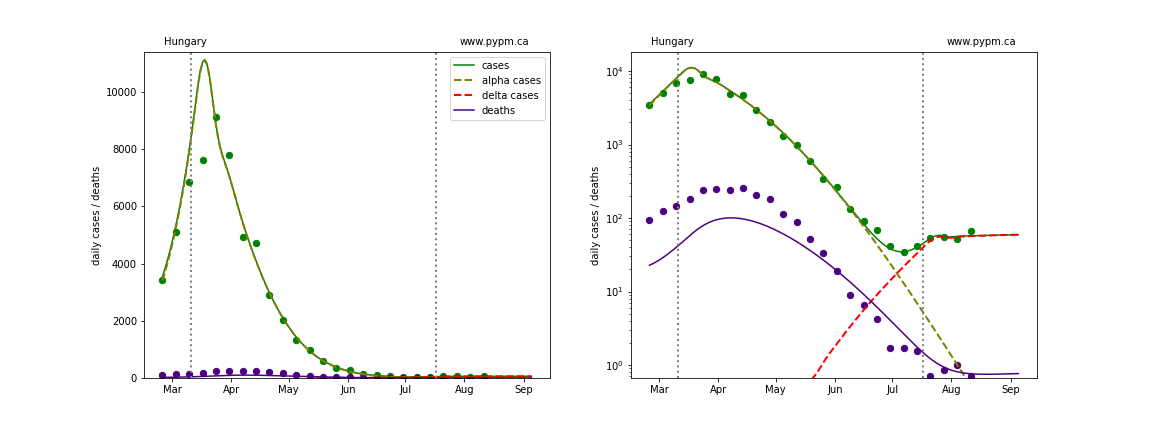
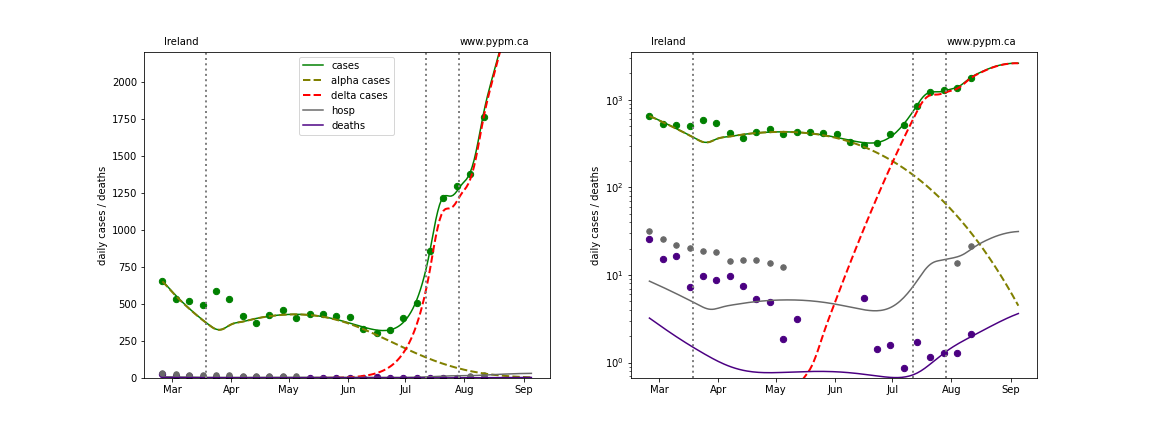
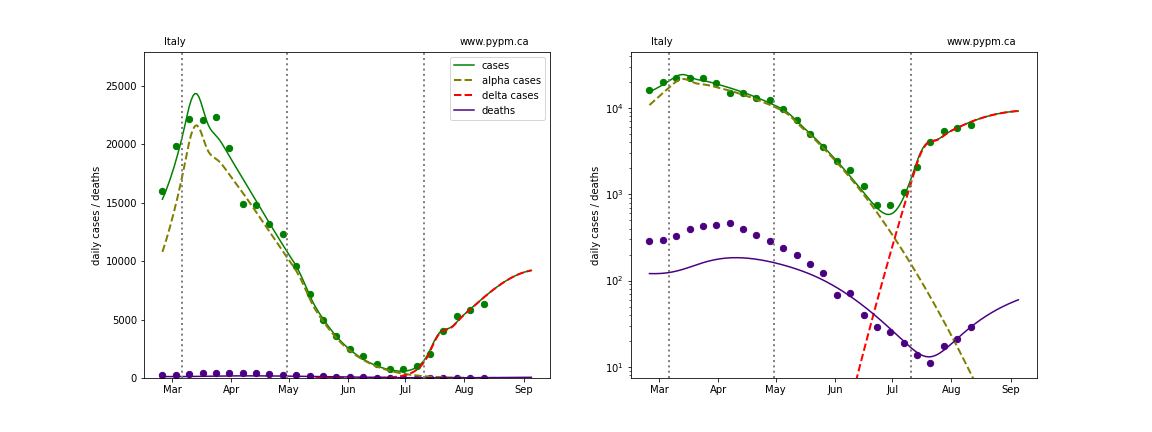
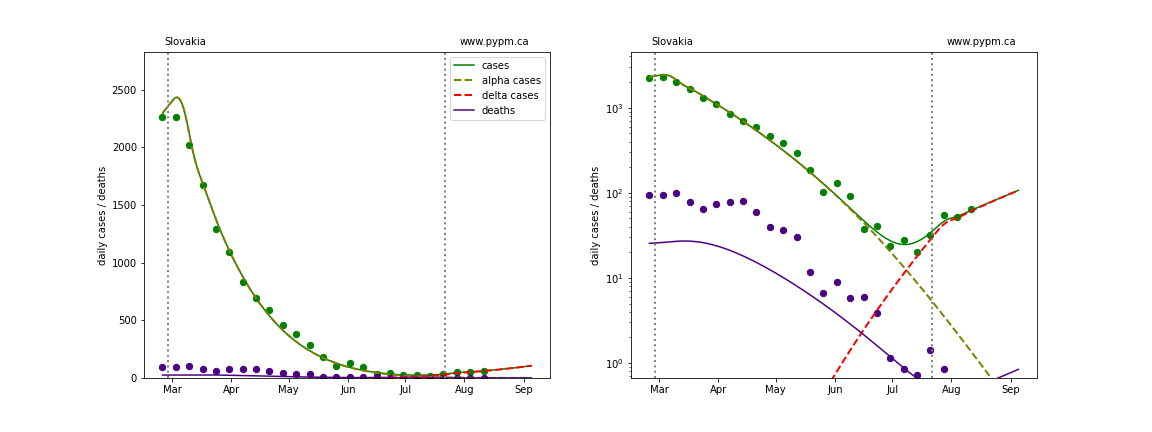
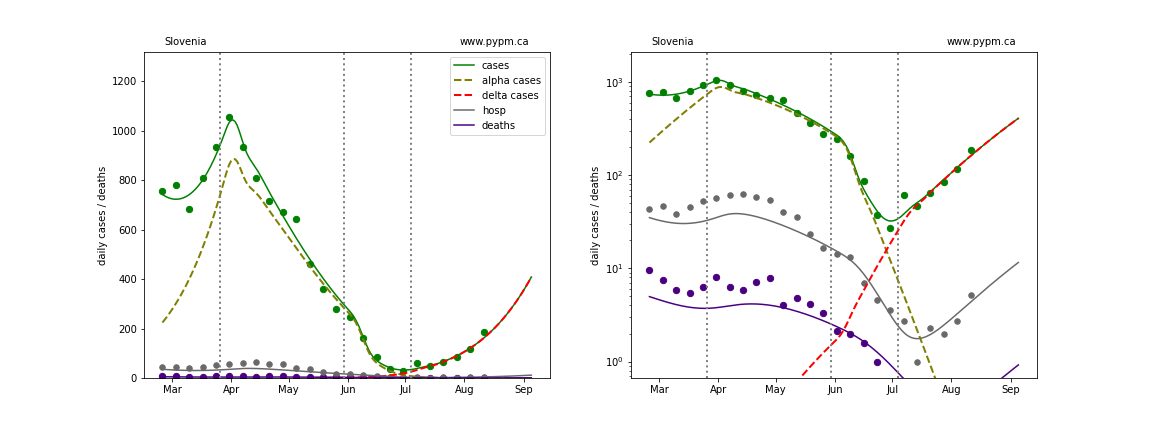
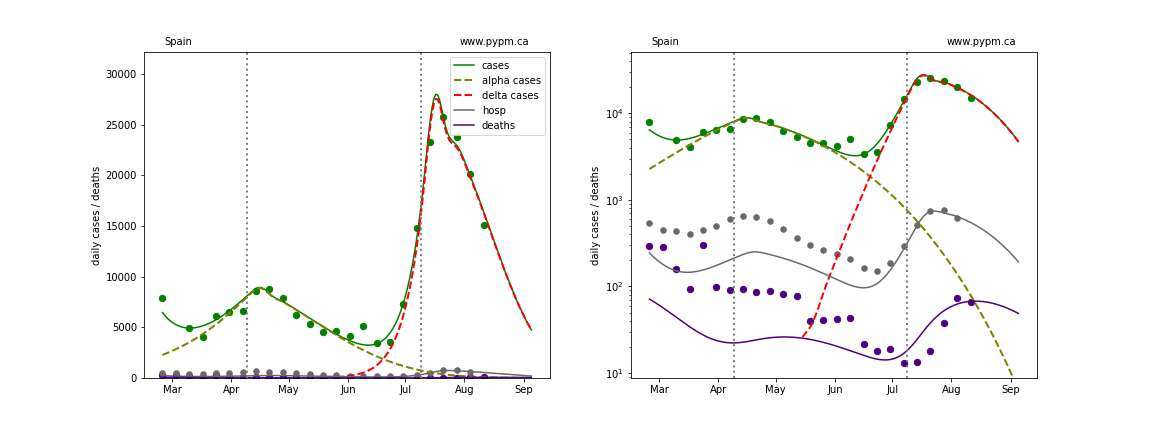
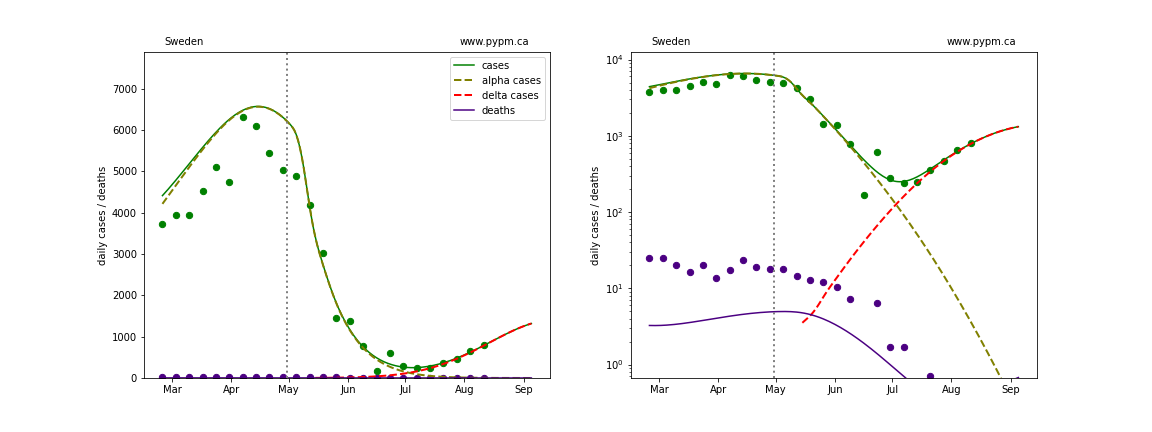
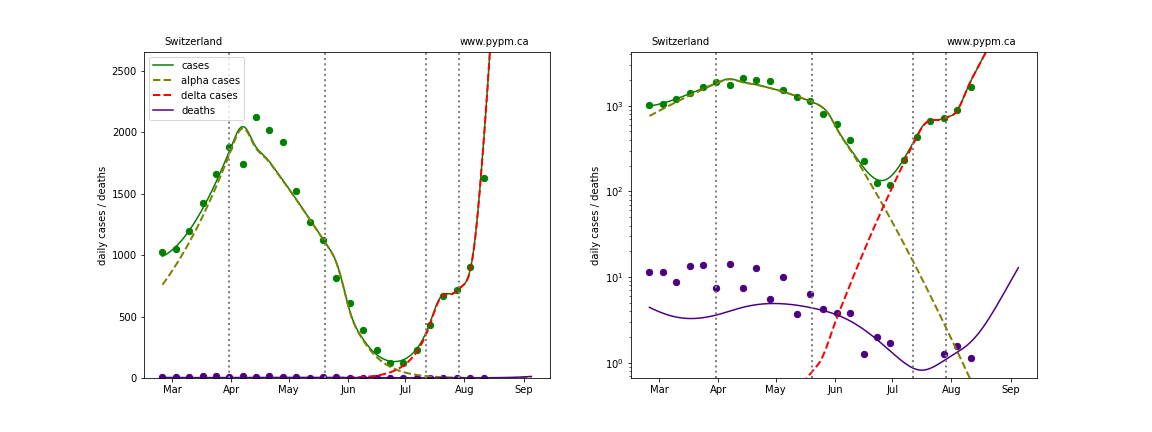
The large green, grey, and indigo circles are the daily cases, hospitalizations, and deaths respectively, averaged over each week. The smaller points show the daily values. The case data are used to define the periods for which transmission rate appears to be constant. The vertical lines show where the transmission rate is changed.
If the susceptible fraction is roughly constant, constant transmission rates lead to steady exponential growth or decline during, which appear as straight lines on these log-scale plots. With immunity growing, these lines are no longer straight - bending downwards due to the herd effect. The solid curves show the model expectations for cases, hospitalizations, and deaths, as determined from the case data. Since this analysis started in July, fine tuning of the model for May date was not done, resulting in some discrepency with data.
The dashed curves separately show the reported cases interpretted as coming from variants of concern, divided into two types B.1.1.7 (alpha) and B.1.617.2 (delta). The very rapid growth of cases is a combination of relaxing restrictions and the introduction of the delta variant.
Austria
Belgium
Bulgaria
Croatia
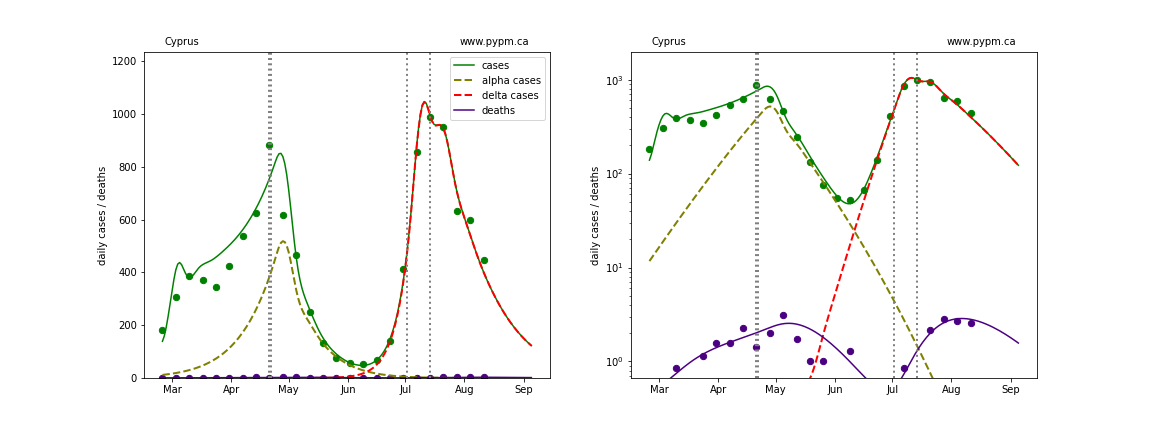
Cyprus
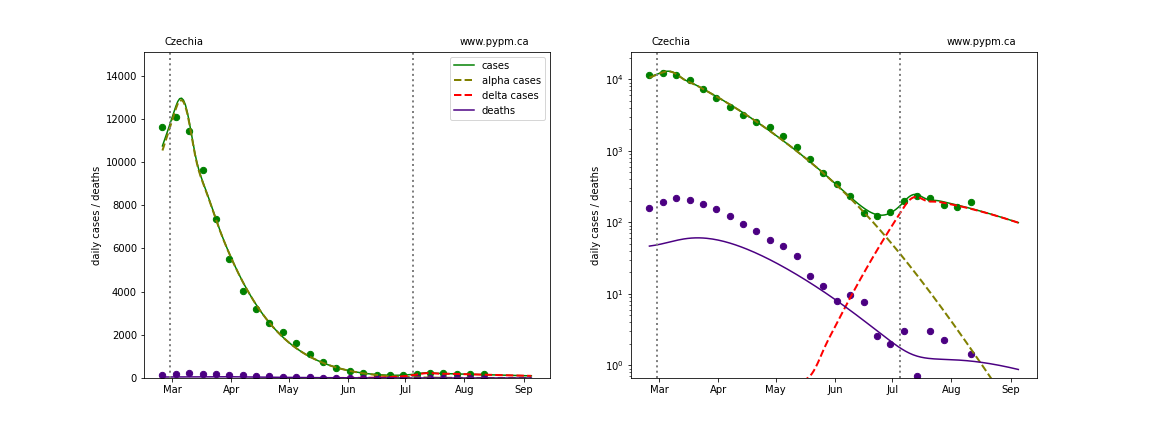
Czechia
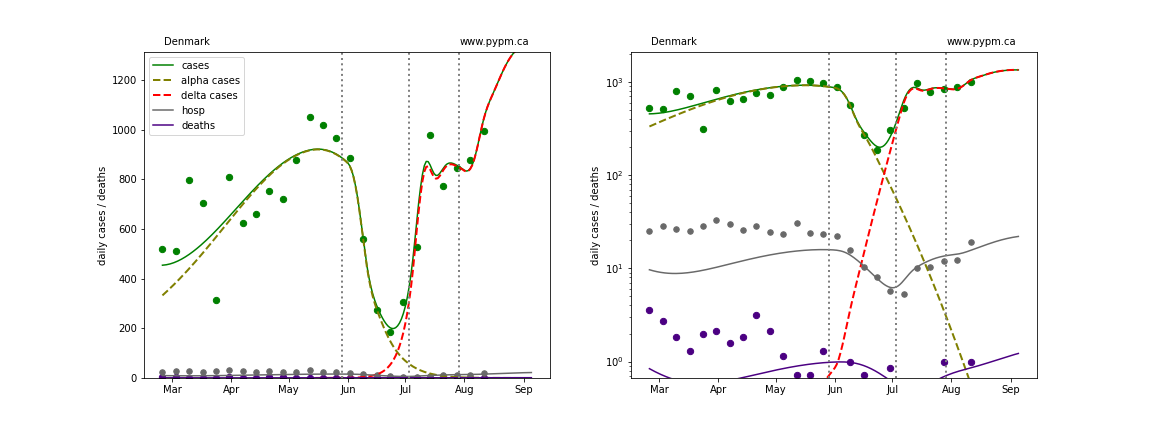
Denmark
Estonia
Finland
France
Germany
Greece
Hungary
Ireland
Italy
Latvia
Lithuania
Luxembourg
Netherlands
Norway
Poland
Portugal
Romania
Slovakia
Slovenia
Spain
Sweden
Switzerland
United Kingdom