June 24, 2020 Analysis of Brazil state data
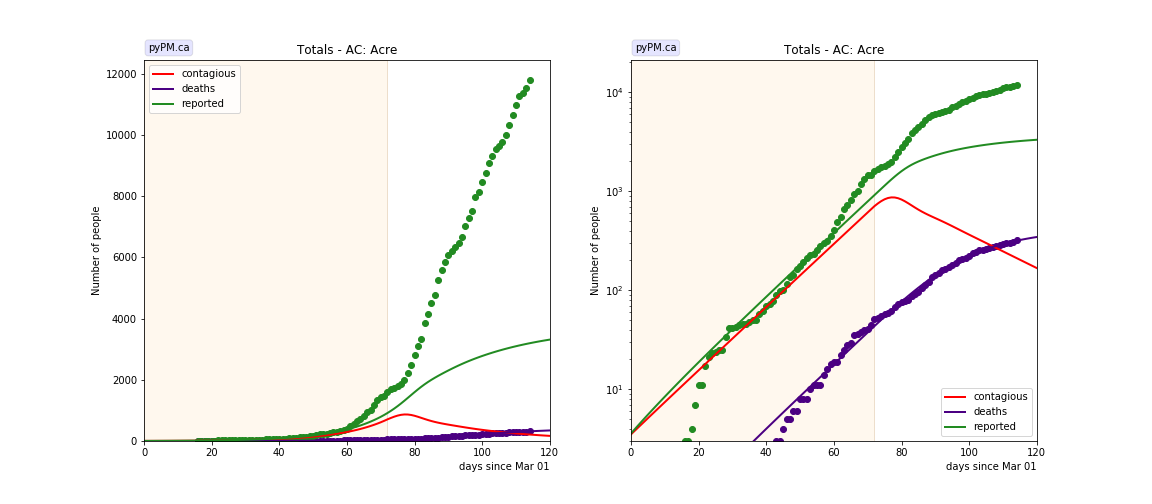
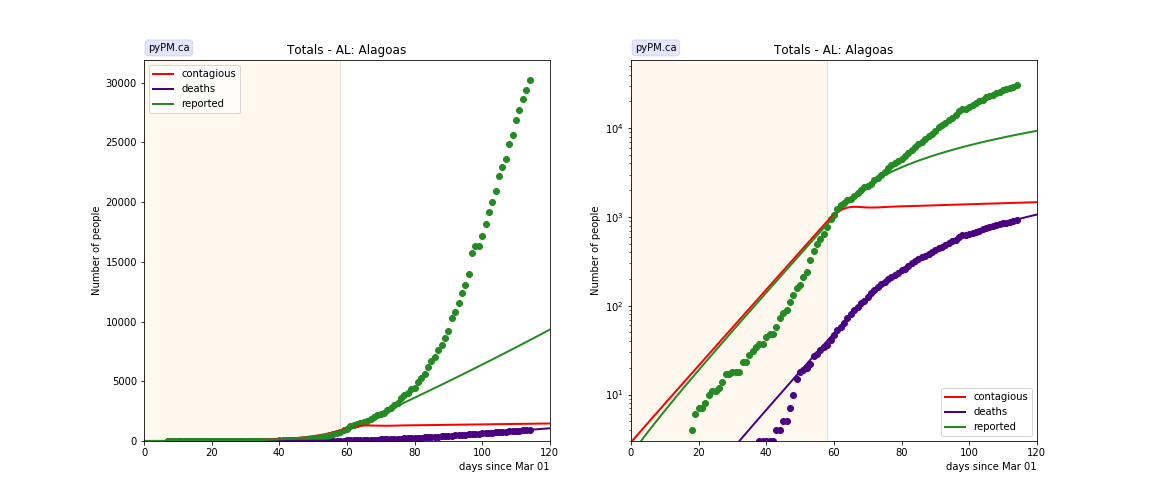
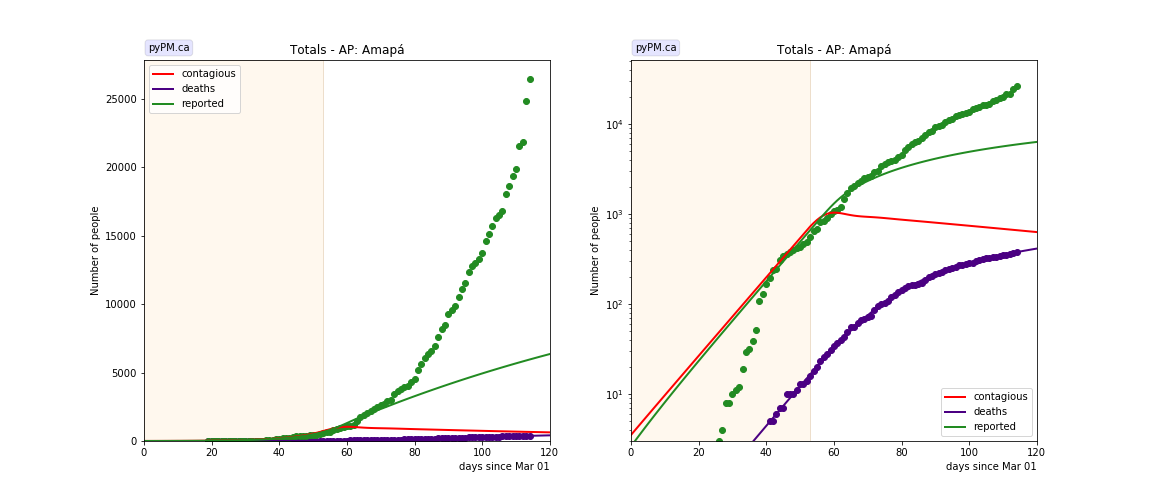
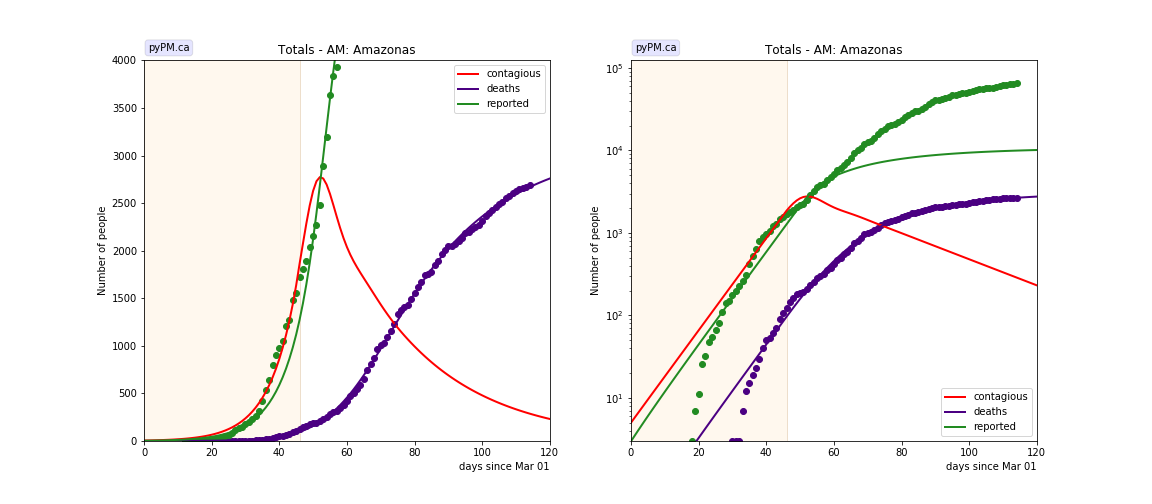
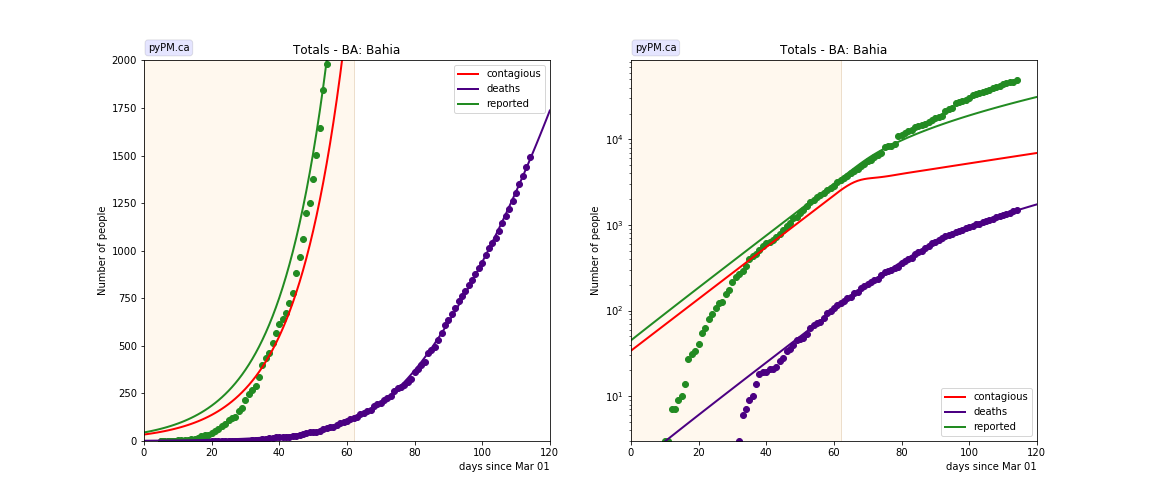
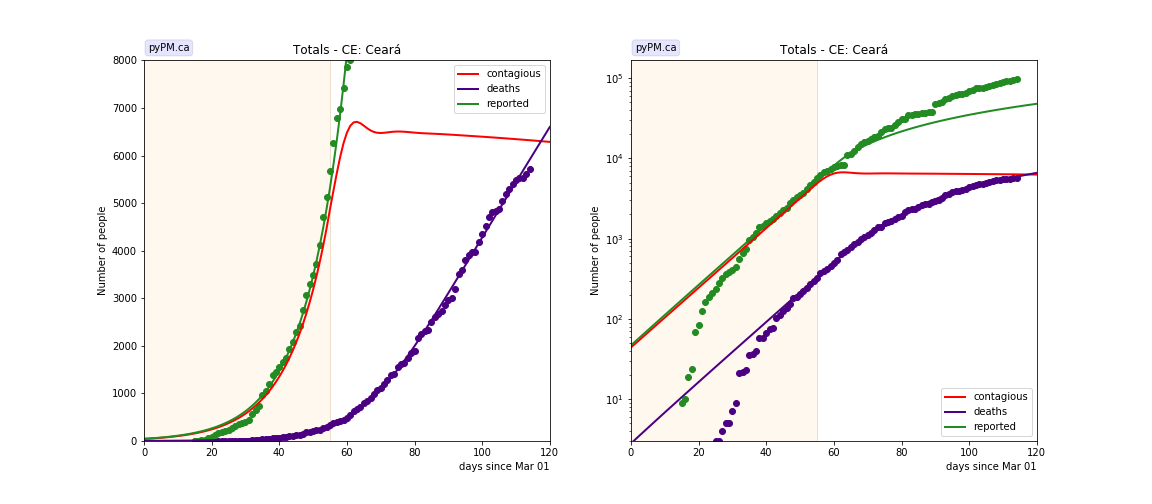
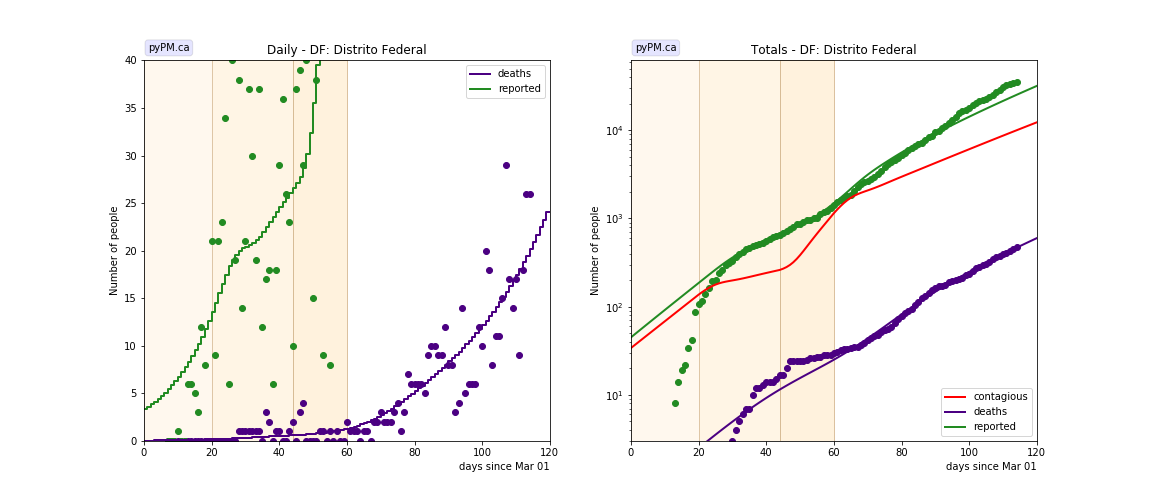
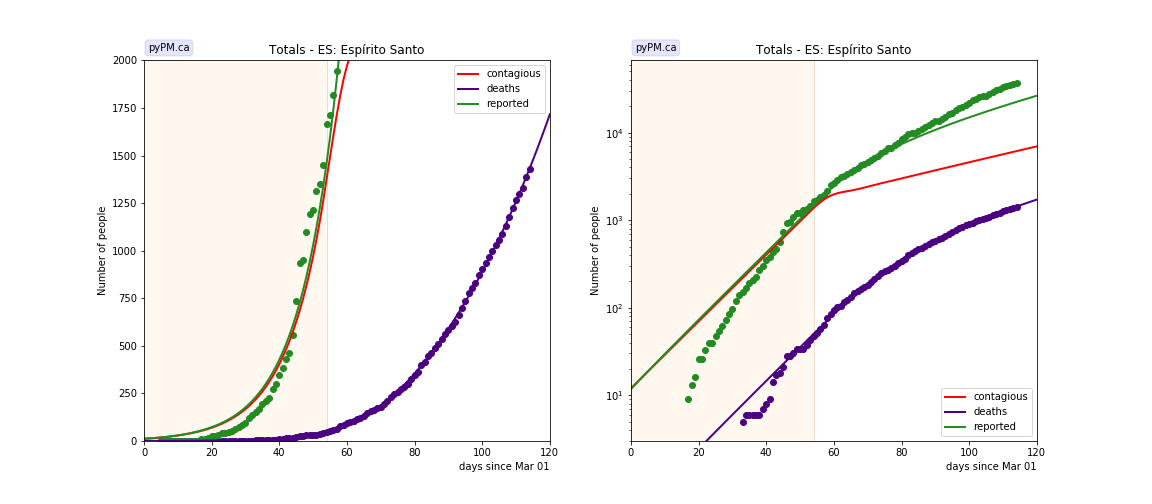
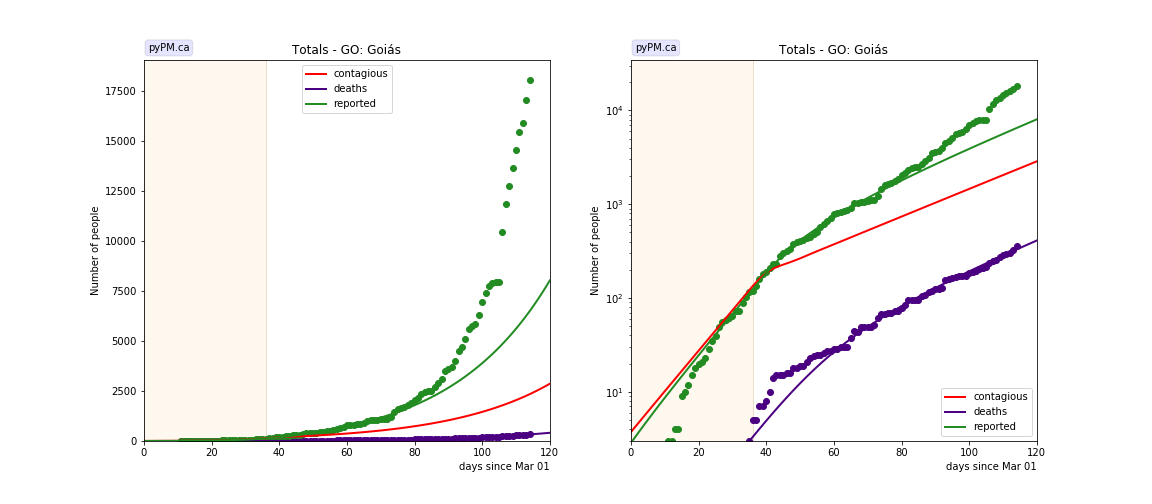
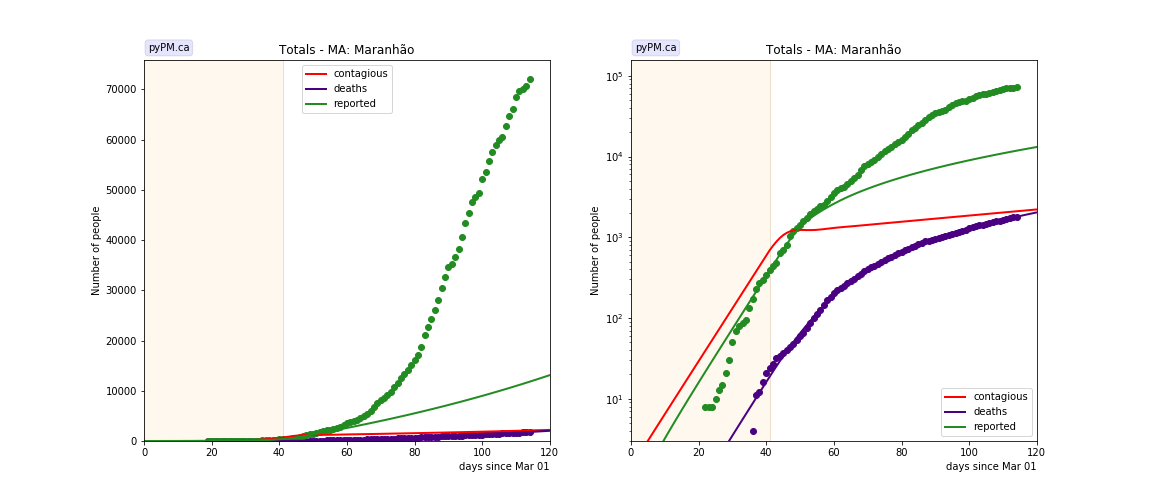
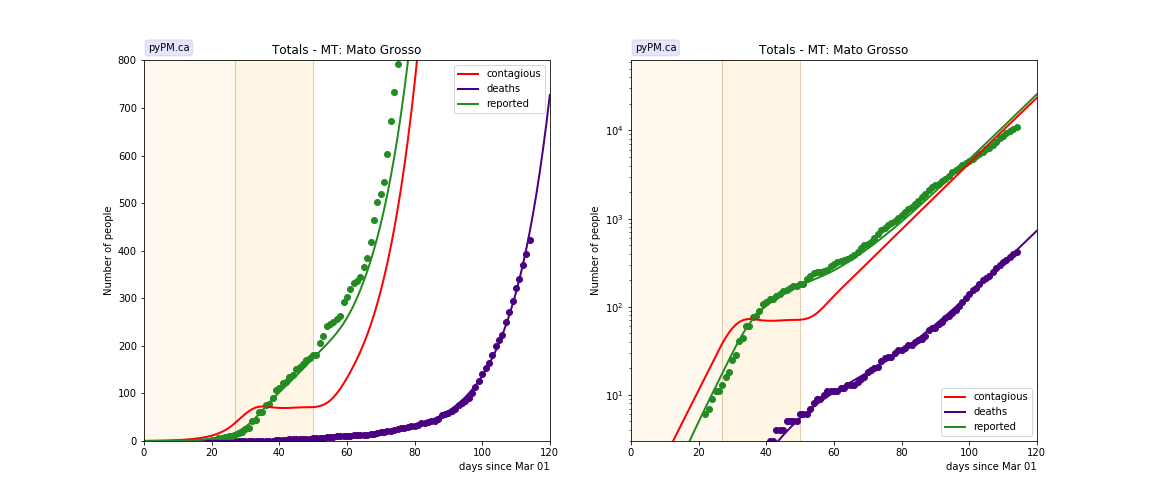
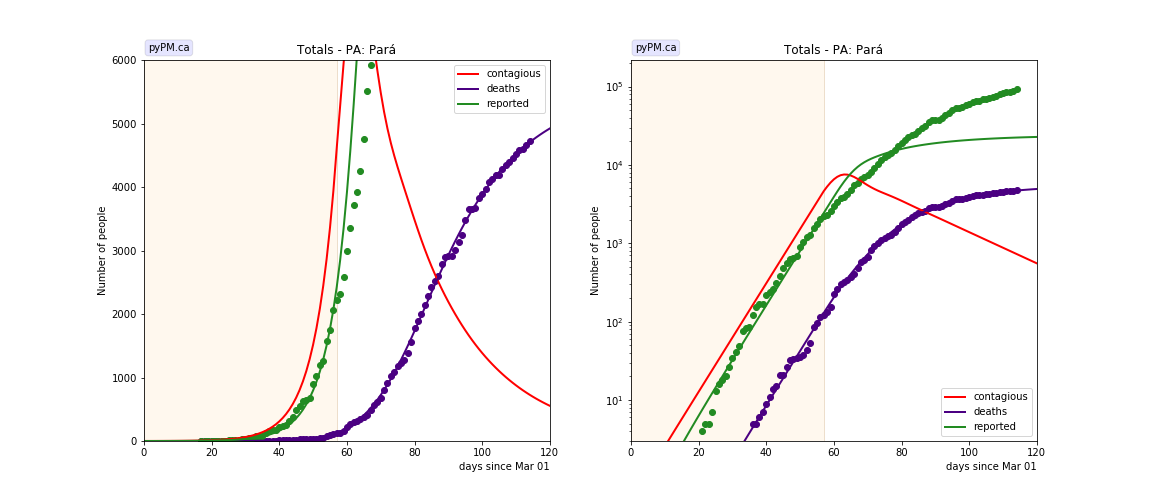
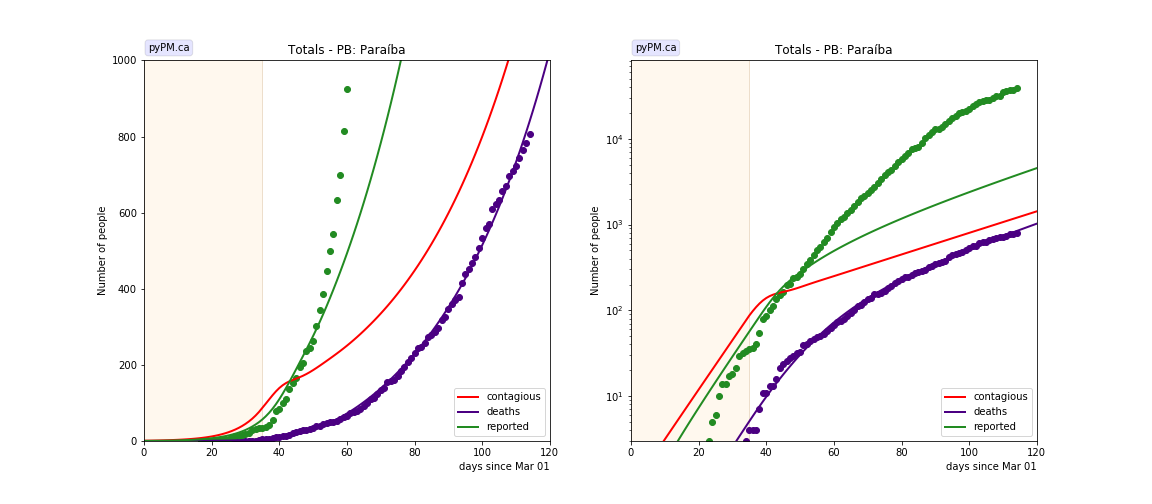
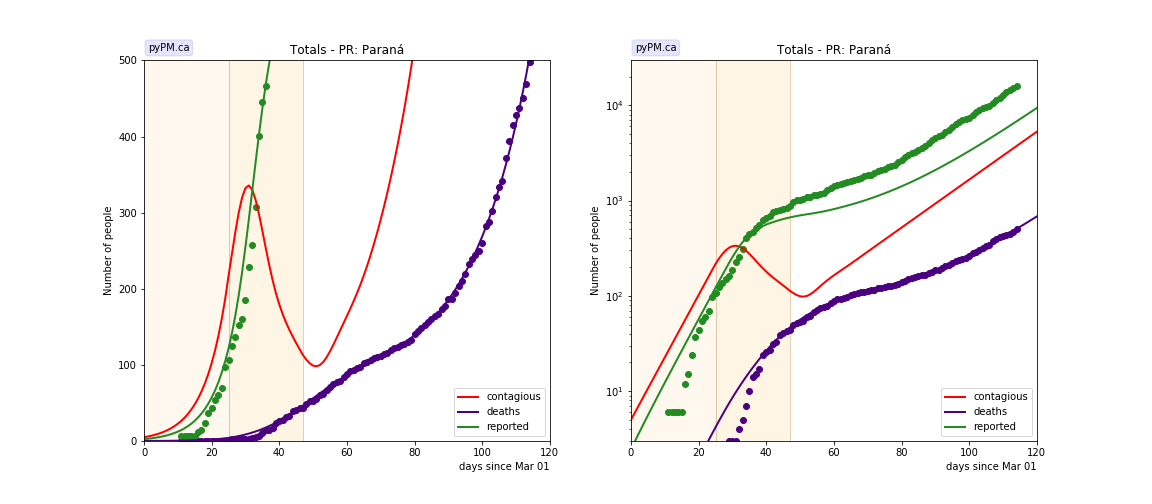
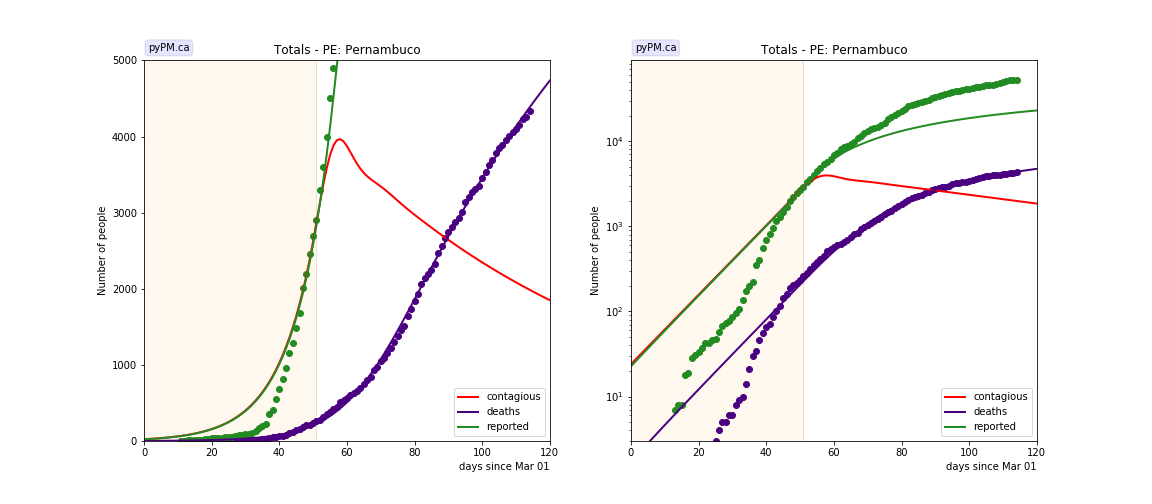
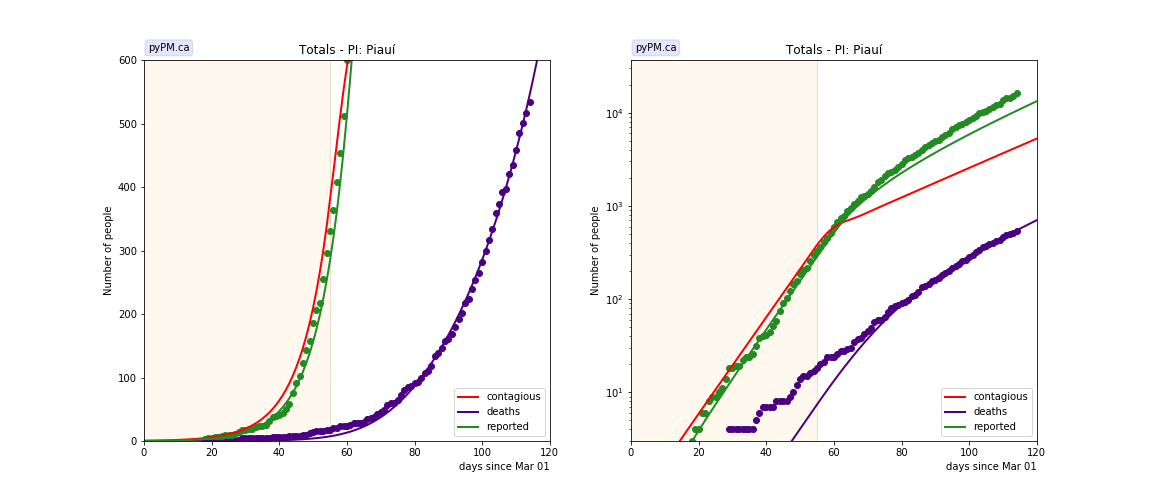
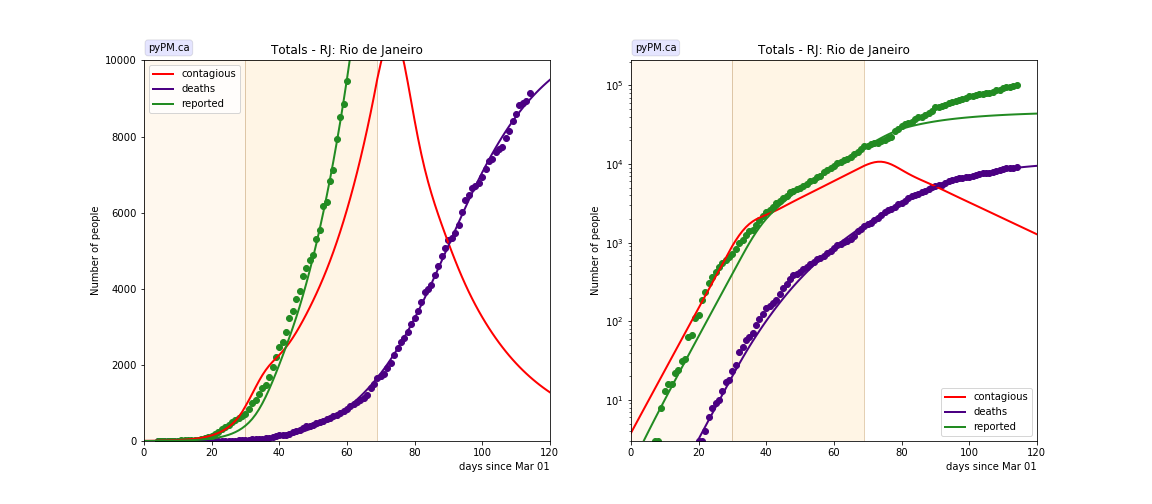
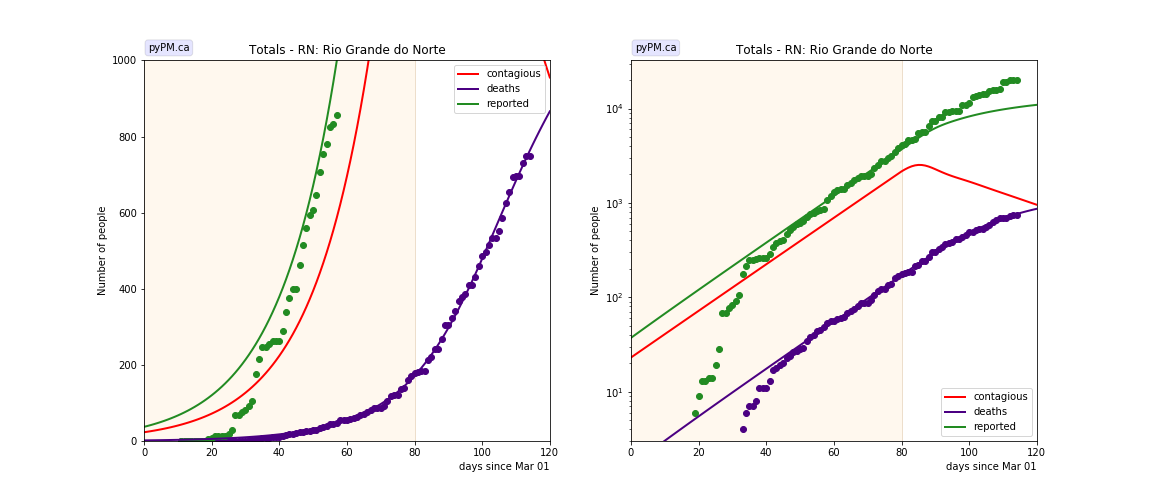
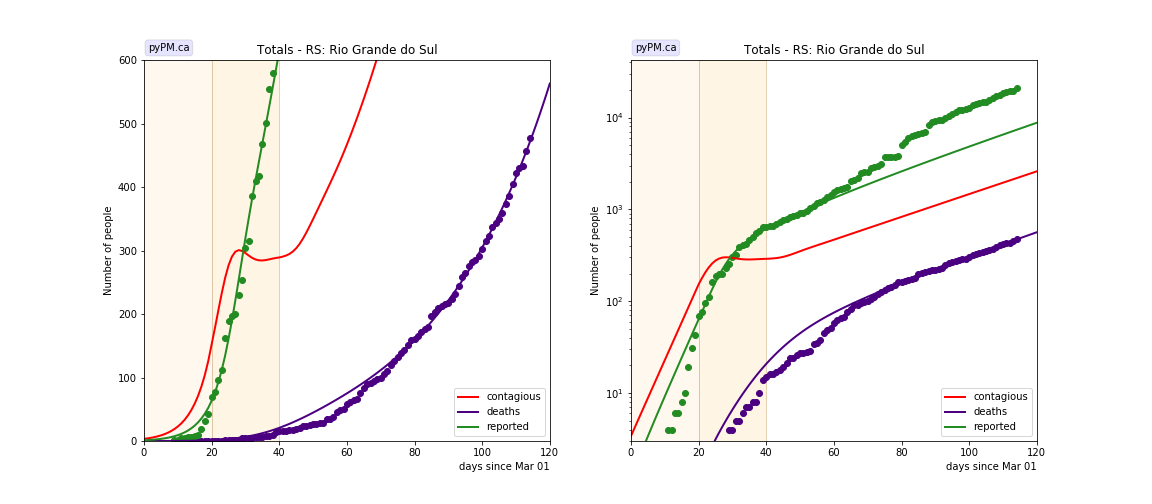
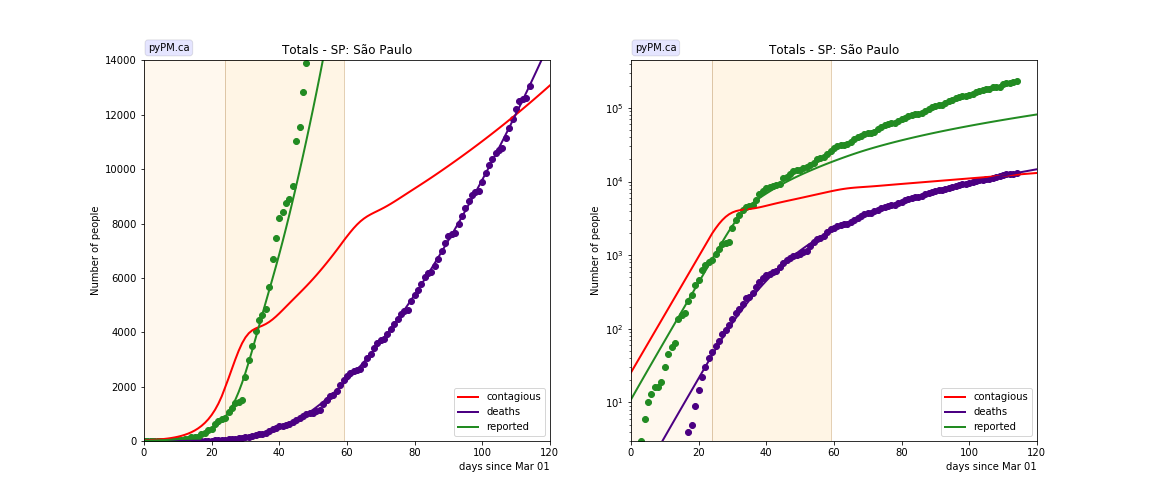
Data from March 1-June 23 were included in this analysis. The case data does not follow the expected steady state trajectories. Instead, the death data was fit, yielding, reasonable fits. The case data shows a faster growth rate than the death data.
Acre
Alagoas
Amapa
Amazonas
Bahia
Ceara
Distrito Federal
Espirito Santo
Goias
Maranhao
Mato Grosso
Para
Paraiba
Parana
Pernambuco
Piaui
Rio de Janeiro
Rio Grande do Norte
Rio Grande do Sul
Sao Paulo
Tables
The tables below are results from the fits to reference model 2.3. These are shown for purposes of comparison.
daily growth/decline rates (δ)
| state | δ0 | day 1 | δ1 | day 2 | δ2 | day 3 | δ3 |
|---|---|---|---|---|---|---|---|
| AC | 0.076 | 72 | -0.035 | ||||
| AL | 0.103 | 58 | 0.004 | ||||
| AM | 0.137 | 46 | -0.033 | ||||
| AP | 0.099 | 60 | -0.006 | ||||
| BA | 0.072 | 62 | 0.015 | ||||
| CE | 0.089 | 55 | 0.001 | ||||
| DF | 0.072 | 20 | 0.021 | 44 | 0.113 | 60 | 0.038 |
| ES | 0.092 | 54 | 0.023 | ||||
| GO | 0.104 | 36 | 0.035 | ||||
| MA | 0.162 | 41 | 0.010 | ||||
| MT | 0.191 | 27 | 0.003 | 50 | 0.091 | ||
| PA | 0.173 | 57 | -0.041 | ||||
| PB | 0.142 | 35 | 0.030 | ||||
| PE | 0.098 | 51 | -0.010 | ||||
| PI | 0.126 | 55 | 0.038 | ||||
| PR | 0.162 | 25 | -0.062 | 47 | 0.060 | ||
| RJ | 0.200 | 30 | 0.052 | 69 | -0.042 | ||
| RN | 0.058 | 80 | -0.025 | ||||
| RS | 0.209 | 20 | 0.002 | 40 | 0.029 | ||
| SP | 0.199 | 24 | 0.024 | 59 | 0.010 |