December 6, 2021 Analysis of BC regional data
This page shows results of analyses reported in our regular BC COVID-19 Modelling Group reports.
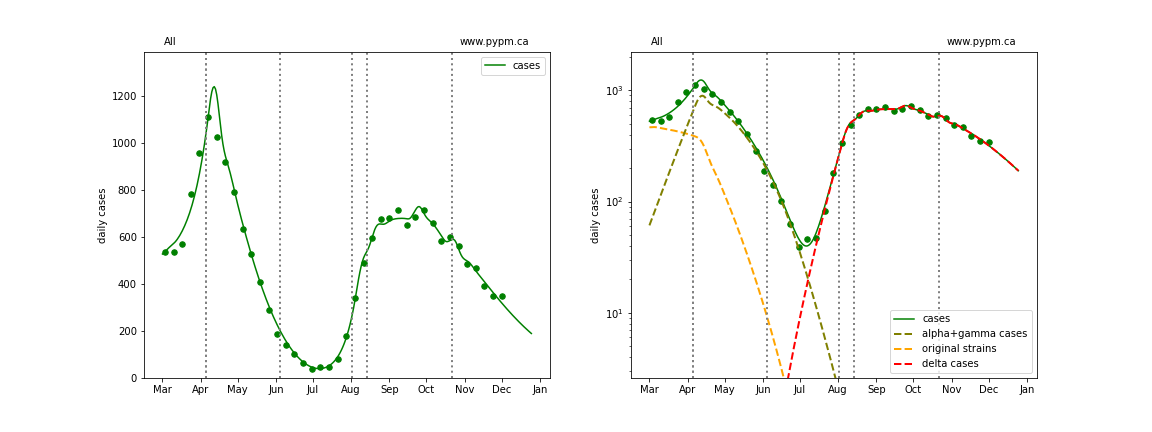
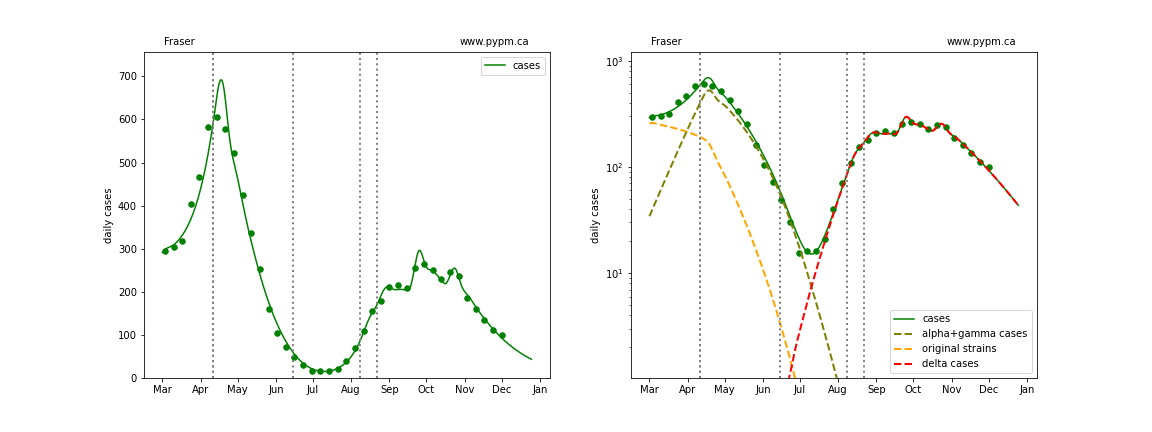
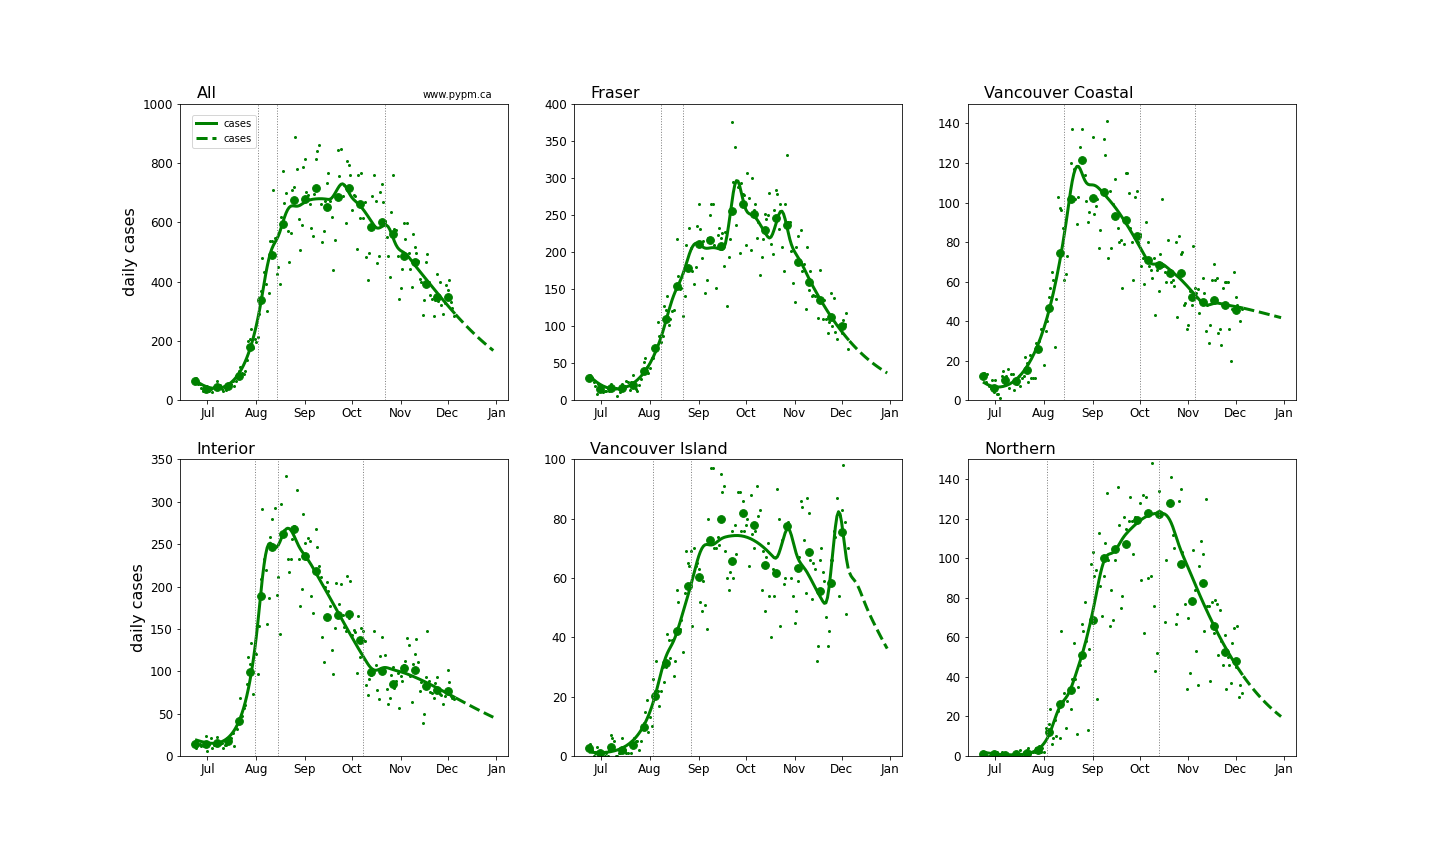
Fits to each health authority case data
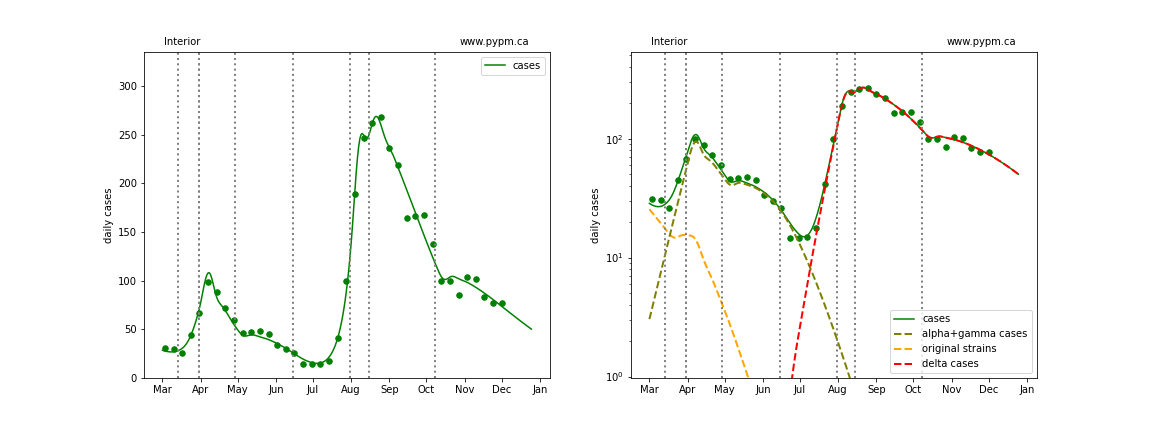
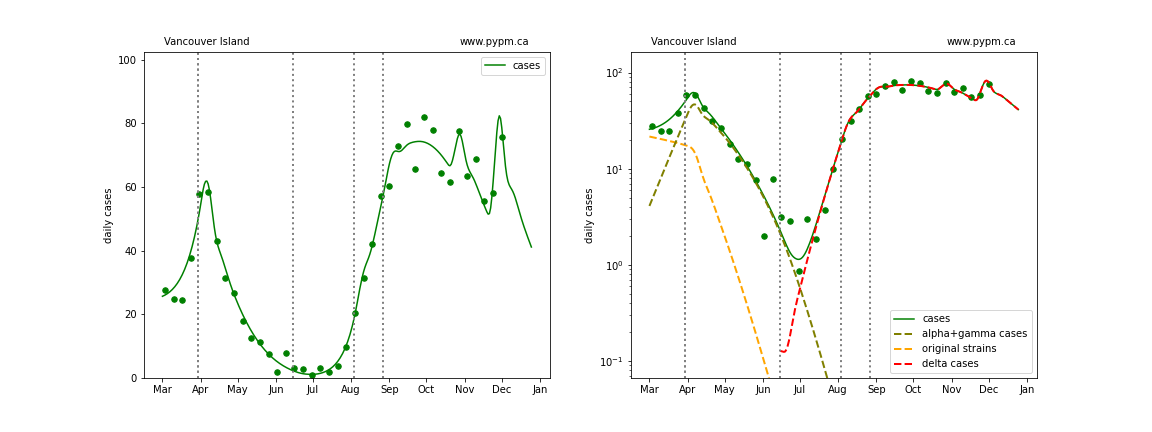
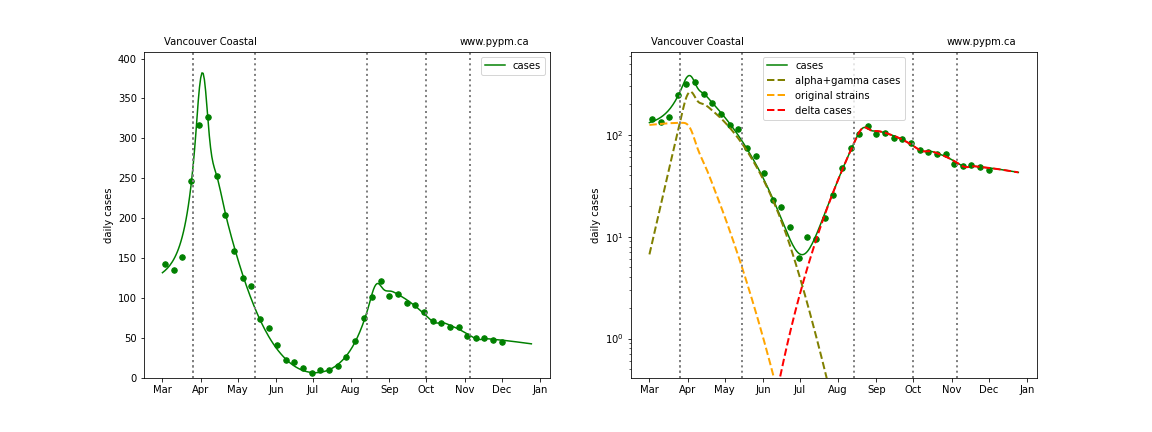
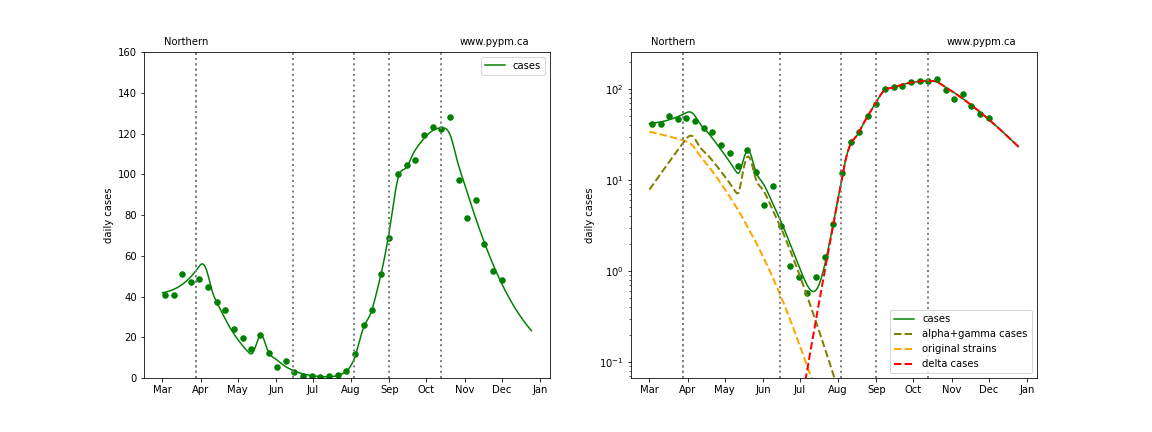
The following shows graphs of daily cases on linear and log scale.
The dashed curves illustrate how cases from the variants overtook the cases from the original strains, and note the hypothesized introduction of delta at a low level and low rate of growth, consistent with what was known at that time.
While the general tendency of a slow decline in daily growth rate continues, the fits indicate a few recent transitions to a higher growth rate, and 2 outbreaks in Fraser and 2 on Vancouver Island. These outbreaks are included in the overall BC fit.
BC total
Fraser
Interior
Island
Coastal
Northern
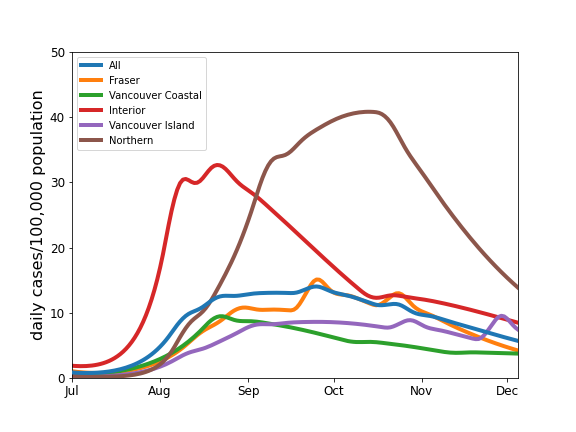
Comparison of case rates for the health authorities
The recent case history for all health authorities are compared below.
This can be compared to long term projections from the October 4 analysis (7 weeks prior). The data collected after October 4 follow the general trends from the long term projection.

The table below indicates the growth rates (shown as percent per day) for each region for recent analyses. The trend to reduced growth rates is evident. Typical uncertainty (68% CL) is about 1%/day. For estimates shortly after a transition, the uncertainties are larger, and are included in the table.
| Region | Sep 13 | Sep 21 | Sep 28 | Oct 4 | Oct 13 | Oct 25 | Nov 11 | Nov 22 | Dec 6 |
|---|---|---|---|---|---|---|---|---|---|
| BC | +1% +/- 1% | 0% | -1% | -1% | -1% | -2% | -3% | -3% | -2% |
| Fraser | +2% +/- 1% | +1% | 0% | -1% | -1% | -2% | -3% | -3% | -3% |
| Interior | -1% +/- 1% | -2% | -3% | -2% | -3% | -3% | -2% | -1% | -2% |
| Coastal | -1% +/- 2% | -1% | -2% | -2% | -2% | -2% | -1% | -2% | 0% |
| Island | +1% +/- 3% | +1% | +1% | 0% | 0% | -1% | -2% | -2% | -3% |
| Northern | +5% +/- 2% | +2% | +1% | +1% | 0% | 0% | -4% | -3% | -3% |
The plot below compares the daily cases as a proportion of HA population. Cases per capita in the Northern HA is similar to the levels reached in Alberta and Saskatchewan.
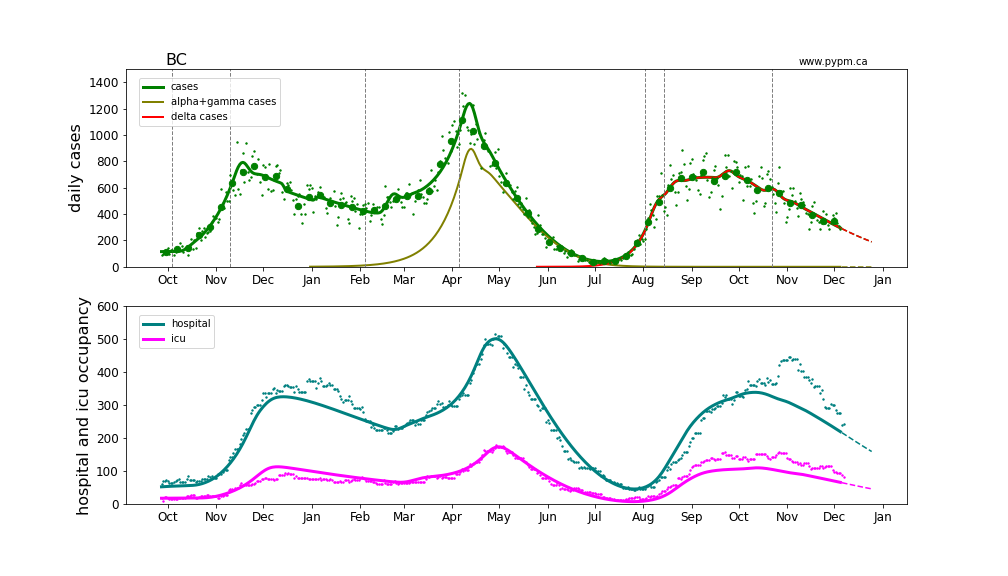
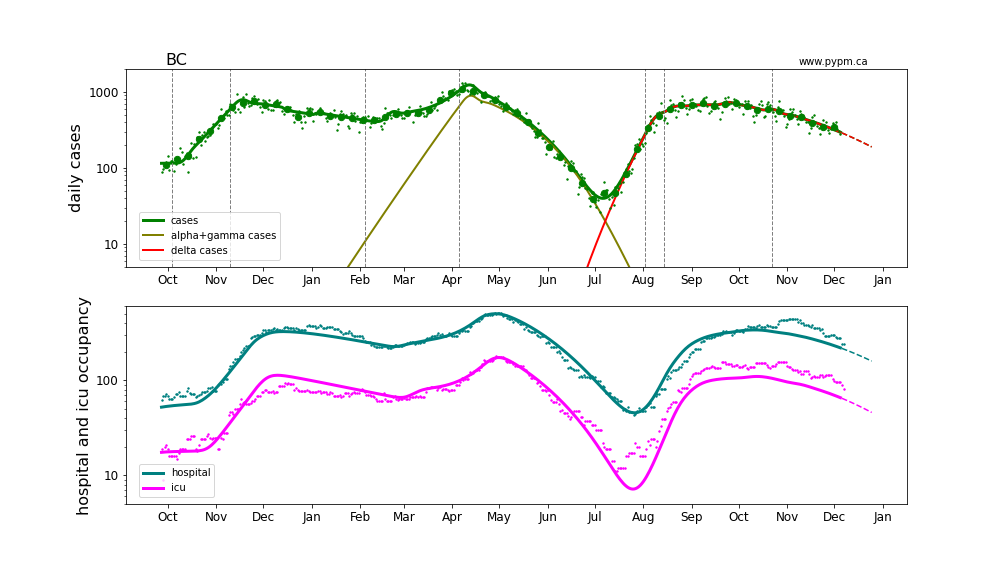
Hospitalization projections
The figure below shows projections for hospital and ICU occupancy (calibrated to the third wave), assuming the growth in case rates from the figure above. It can be seen in the graphs that growth in hospital occupancy are delayed compared to the growth in cases. ICU occupancy is higher in the fourth wave, and recently the hospital occupancy has unexpectedly increased.
The plots are shown in linear and log-scale.
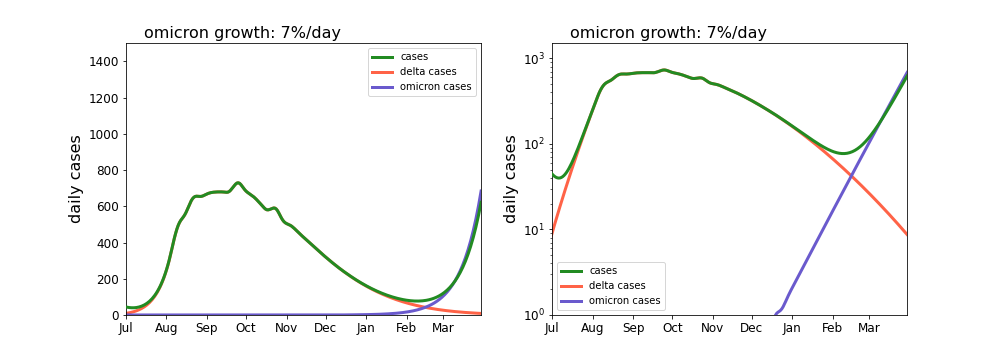
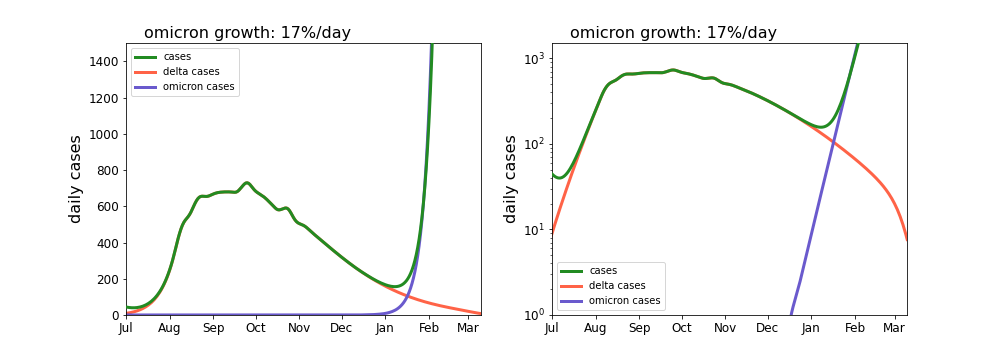
Omicron projections
The Omicron variant appears to have a significant growth advantage compared to the various delta strains. The growth rate in a jurisdiction with high vaccination levels and moderate NPI. The figures below illustrate possible scenarios for growth: 7% per day and 17% per day.