August 24, 2021 Analysis of BC regional data
This page shows results of analyses reported in our regular BC COVID-19 Modelling Group reports.
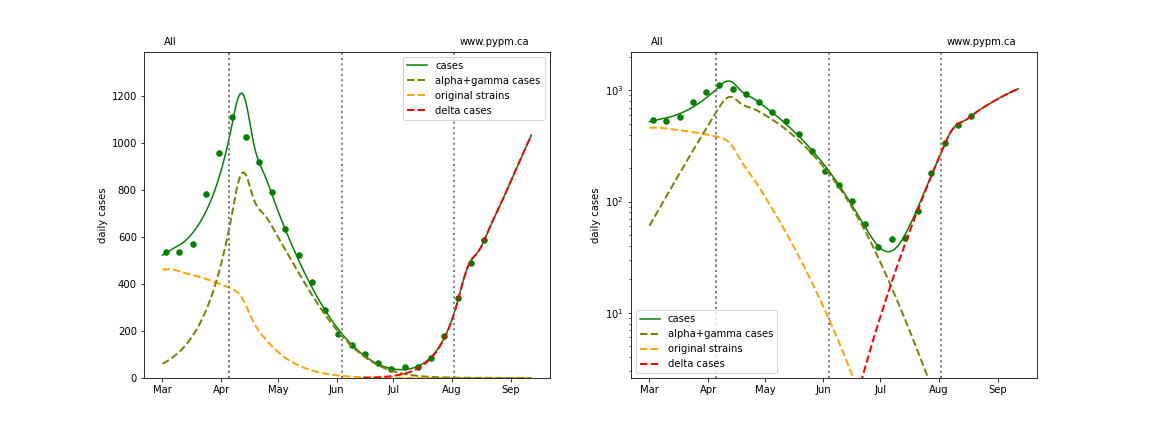
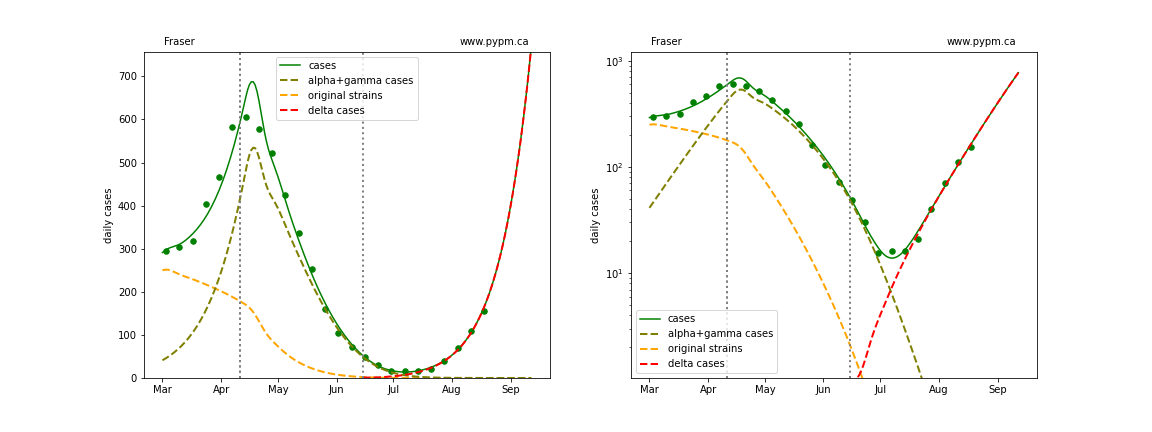
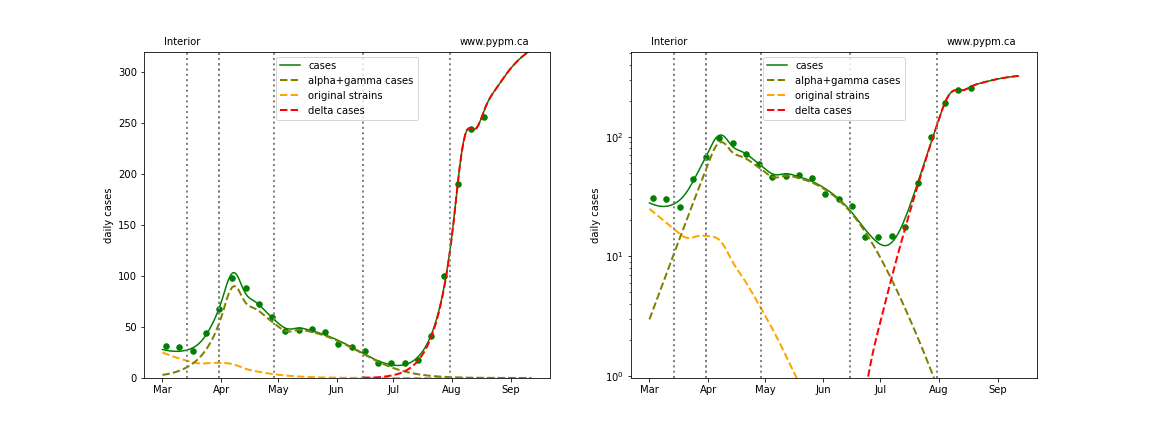
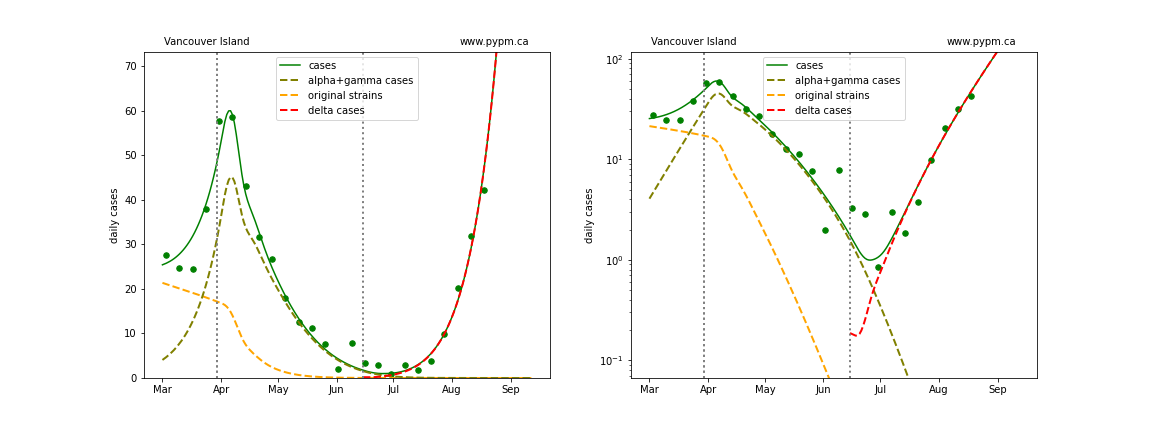
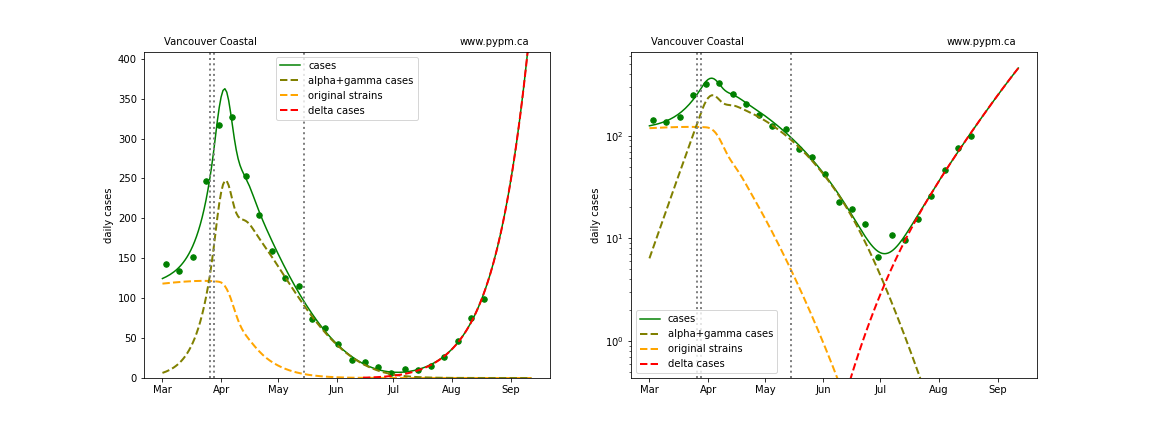
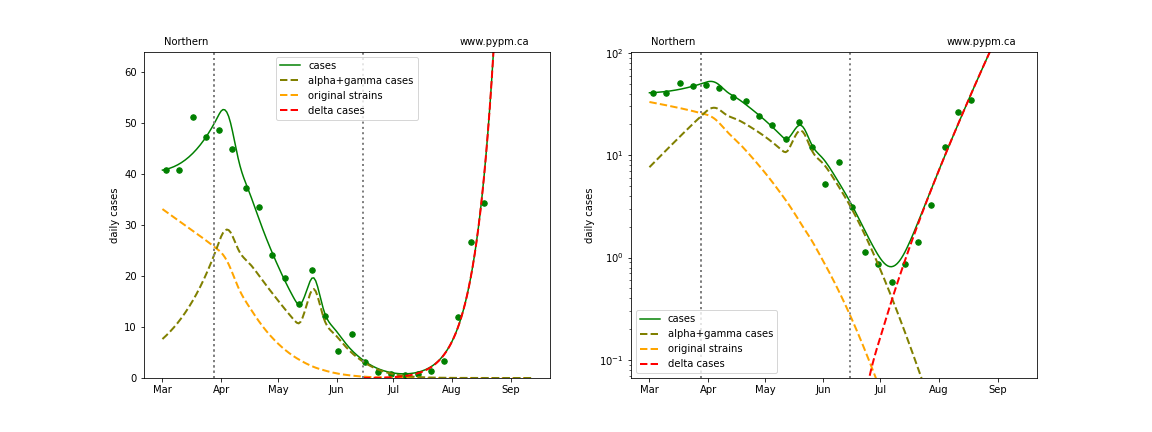
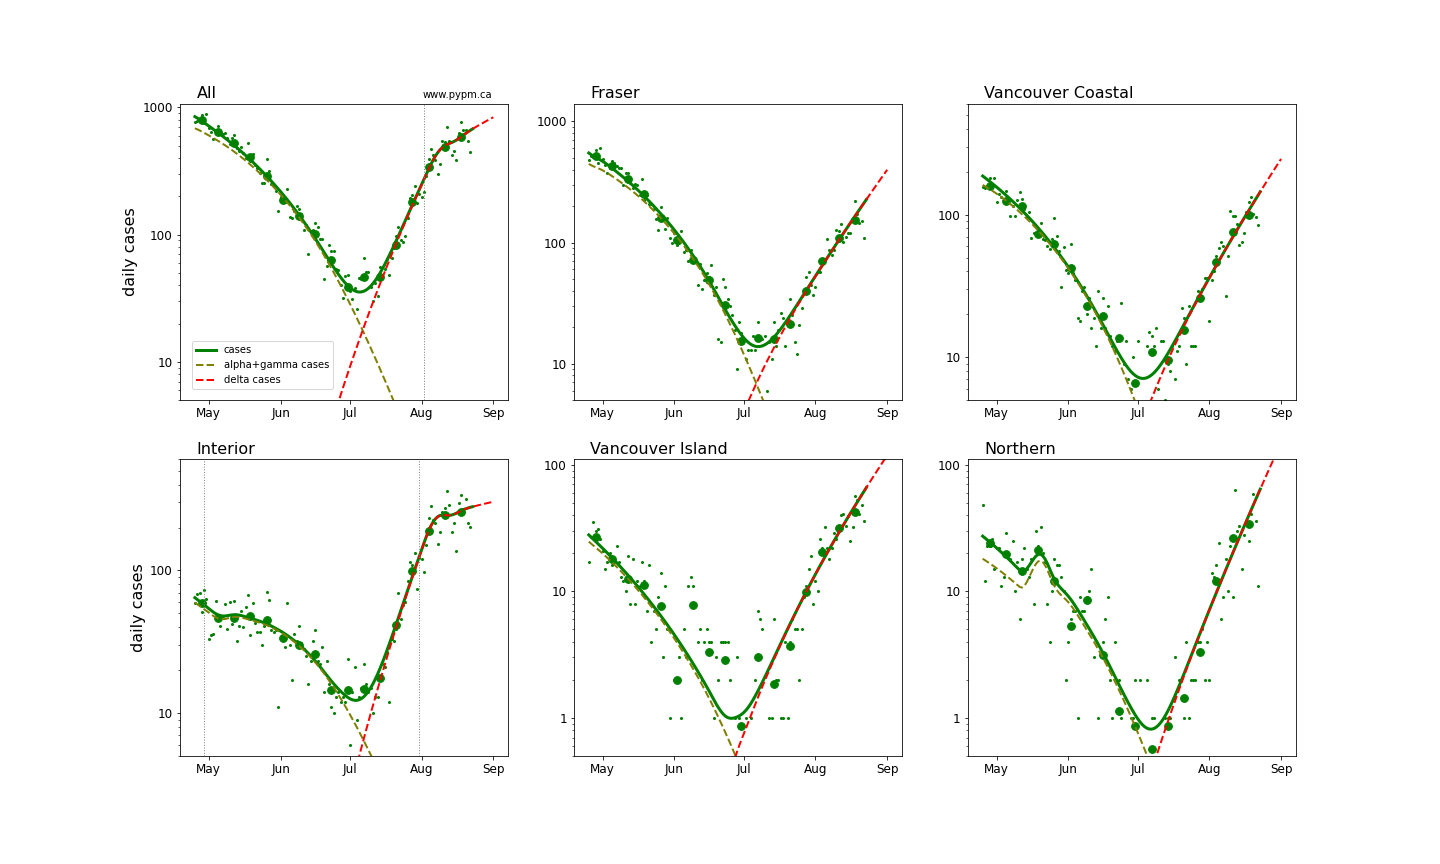
Fits to each health authority case data
All health authorities are experiencing rapid growth in cases due to the delta variant.
The following shows graphs of daily cases on linear and log scale.
The dashed curves illustrate how cases from the variants overtook the cases from the original strains, and note the hypothesized introduction of delta at a low level and low rate of growth, consistent with what was known at that time.
A change in transmission rate at the end of March is included in the fits, to account for the “circuit breaker” restrictions brought into force. The transition date is fit for each region individually.
A transition is included for the Interior, since there appears to be a slight reduction in growth rate recently, likely the result of additional health measures brought into force in late July. This is also apparent in the overall BC case history, so a transition is also included. The transition dates are found by optimizing goodness of fit.
BC total
Fraser
Interior
Island
Coastal
Northern
Recent transition to growth
The recent transition to rapid growth is seen more clearly in the plot below.
The table below indicates the growth rates for each region for recent analyses
| Region | July 28 | Aug 3 | Aug 10 | Aug 16 | Aug 24 |
|---|---|---|---|---|---|
| BC | +9% / day | +9% / day | +9% / day | +8% / day | +3% / day |
| Fraser | +8% / day | +7% / day | +8% / day | +7% / day | +7% / day |
| Interior | +12% / day | +11% / day | +8% / day | +6% / day | +1% / day |
| Coastal | +6% / day | +6% / day | +7% / day | +7% / day | +6% / day |
| Island | - | +7% / day | +9% / day | +9% / day | +7% / day |
| Northern | - | +14% / day | +15% / day | +14% / day | +10% / day |
The growth rates are roughly consistent from week to week, except for the significant reduction in Interior, which also affects the overall growth. Growth appears to be sustained in the other regions. The low case rates in Northern and Vancouver Island HA leads to larger variance of the growth rate estimators.
If the growth continues in each HA, then the growth rate for the province will return to 7-8%/day once the other regions start to produce the most cases. With growing immunity, the model predicts decling growth rates of about 0.3%/day per week for constant transmission rates.
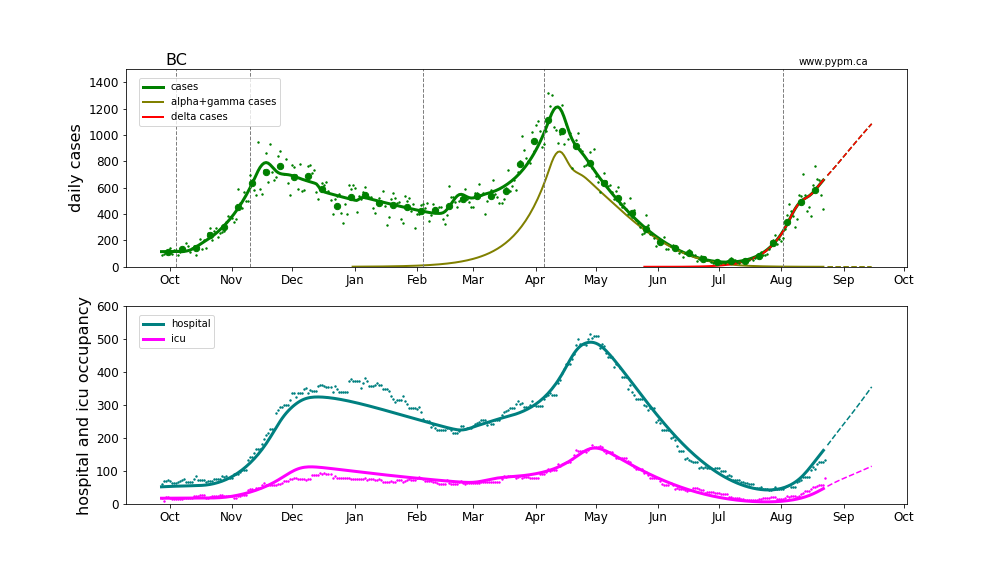
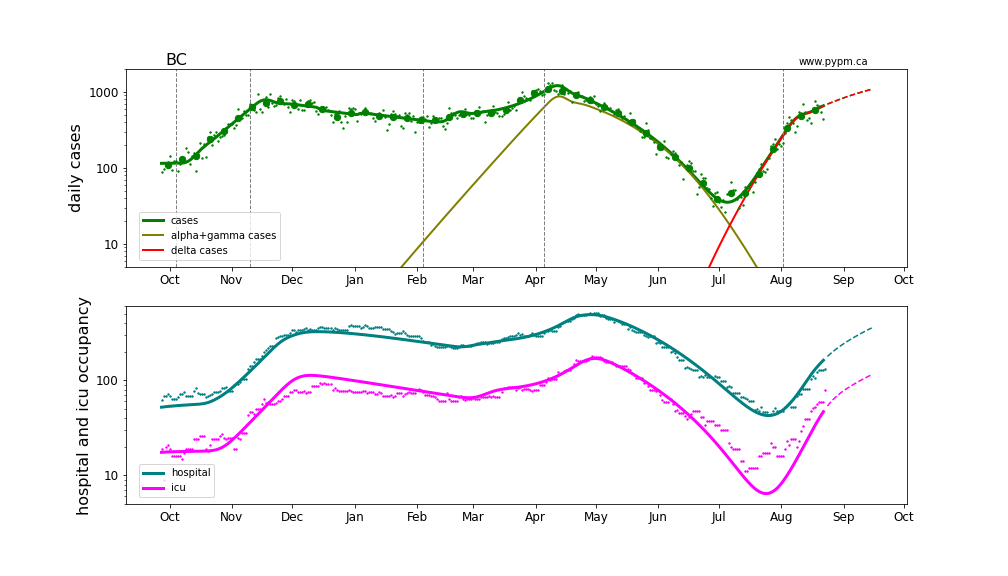
Hospitalization projections
The figure below shows unfitted projections for hospital and ICU occupancy, assuming the growth in case rates from the figure above. It can be seen in the graphs that growth in hospital occupancy will be delayed compared to the growth in cases. The rise in hospitalization due to the recent growth of delta is following at the expected level.
The plots are shown in linear and log-scale.