June 20, 2020 Analysis of provincial data
All provinces except PEI (which has very few cases) are fit to the reference model 2.3. Reporting anomalies are included for BC and Quebec.
The following shows graphs followed by tables. To download a pdf version of a plot, click on the title. The models and data used to produce these are conveniently made available through the ipypm user interface.
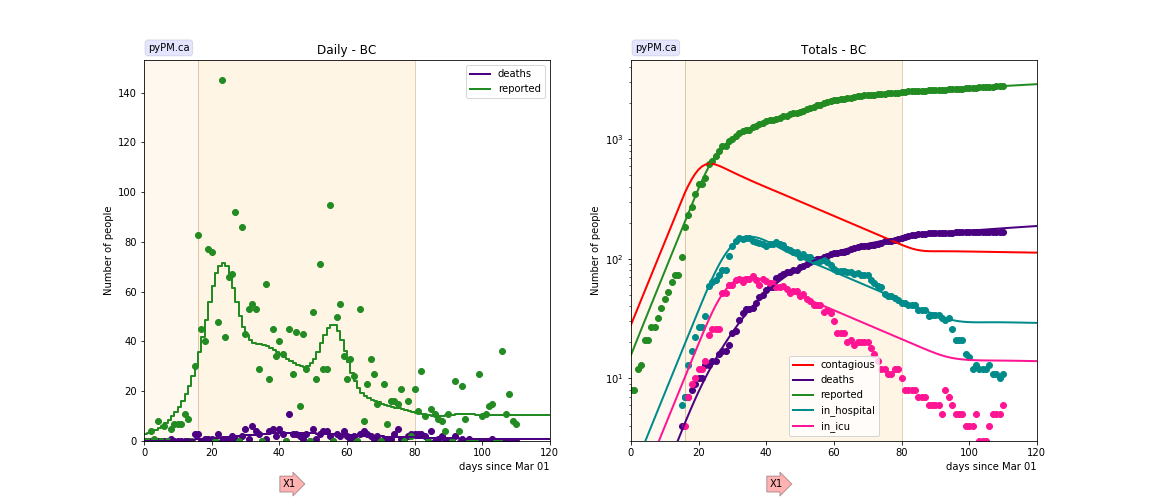
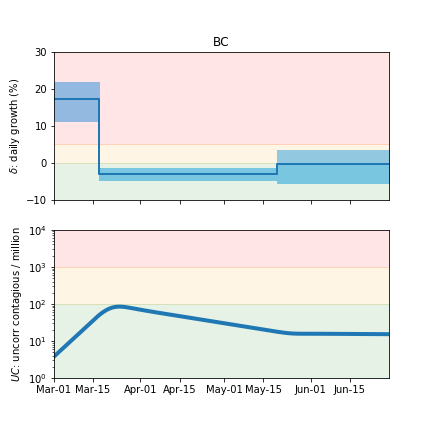
BC
The data is consistent with a single transition in the transmission rate and about 300 cases added in late April. The anomalous cases are seen in all health regions and is expected to be due to a change in test/reporting policy. The trajectory for in hospital follows the infection trajectory deduced from the case studies.
A transition was inserted for May 19, the date social distancing rules were relaxed. While there is an increase in cases, and the fit finds increased transmission rate, this is apparently due to a small outbreak in Vancouver Coastal health region. See this link to see a breakdown by health authority. The statistical analysis finds a large uncertainty for δ following May 19.
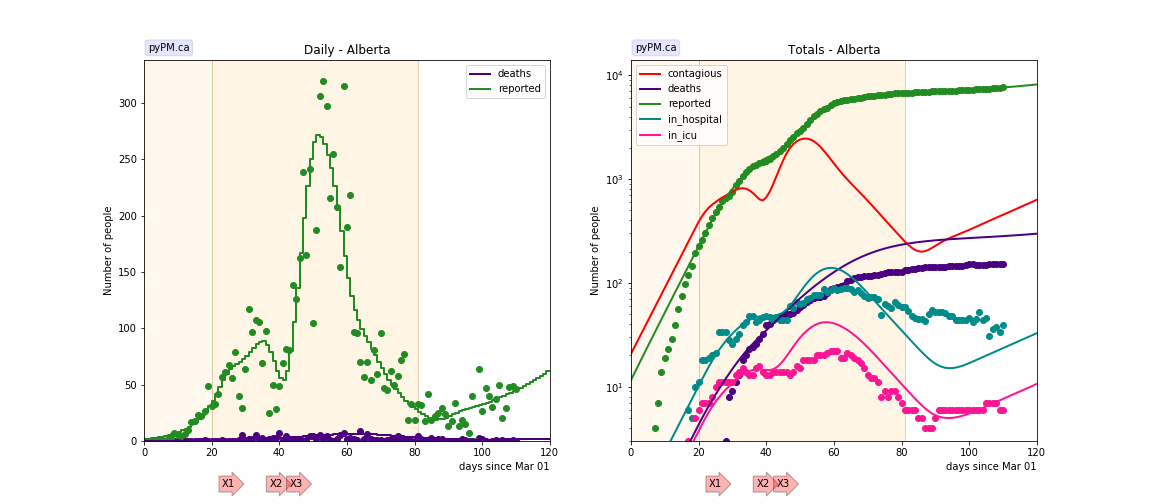
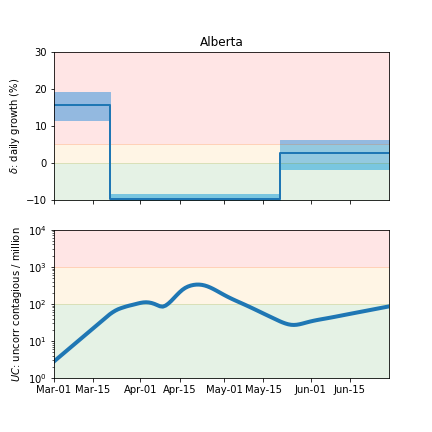
Alberta
The data is consistent with one change in transmission rate in mid March and 3 separate large outbreaks. These have been reported in the media to be due to meat packing plants. The data is consistent with each outbreaks taking place over a very short period of time. Only two parameters are used to characterize each outbreak: date and number of infections. The shapes of the case (and contagious populations) are outcomes of the other model parameters which were not tuned.
The hospitalization and death rates from these outbreaks appear to be smaller than the cases from March.
There is again growth in cases starting around May 20. The additional cases are from the Edmonton health region.
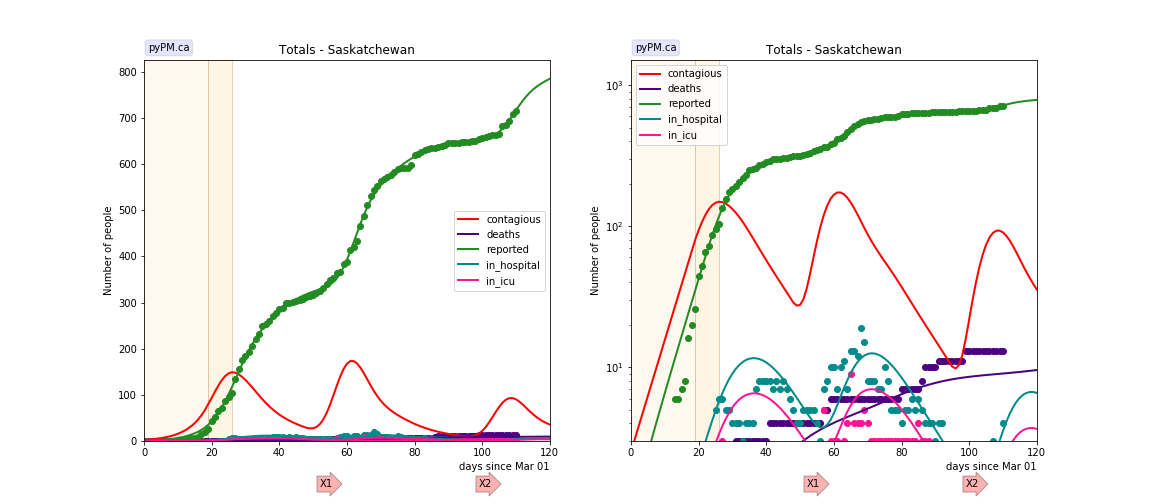
Saskatchewan
The data is consistent with two transitions in transmission rates, one large outbreak reported in the media to be in far northern communities, and a second smaller outbreak in early June (also in far northern communities). The data suggests that the first outbreak took place over a period of about 10 days. The second outbreak is only now becoming visible in the case data.
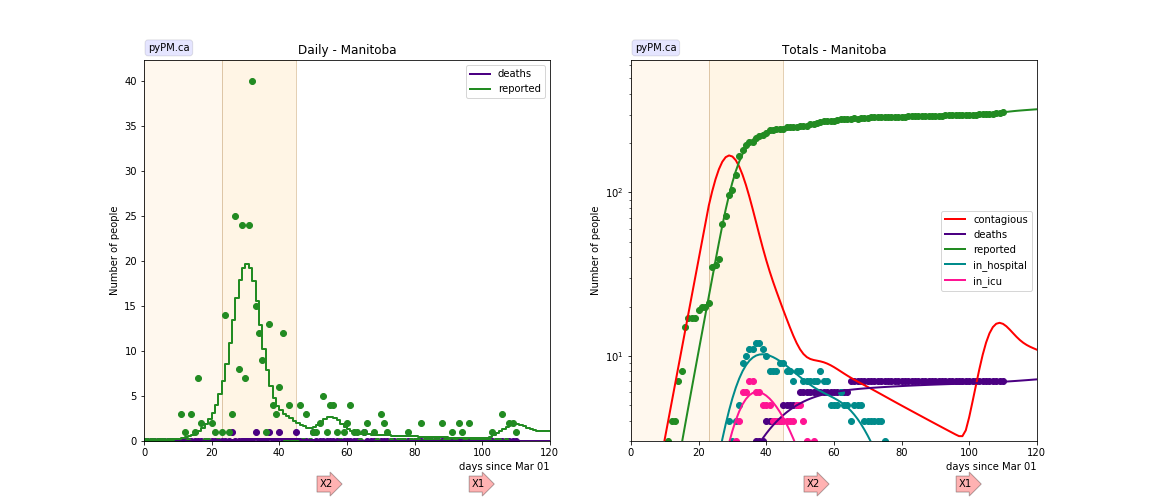
Manitoba
The data is consistent with one change to the transmission rate. Small deviations from exponential decline seen - used a reporting anomaly and an outbreak as examples.
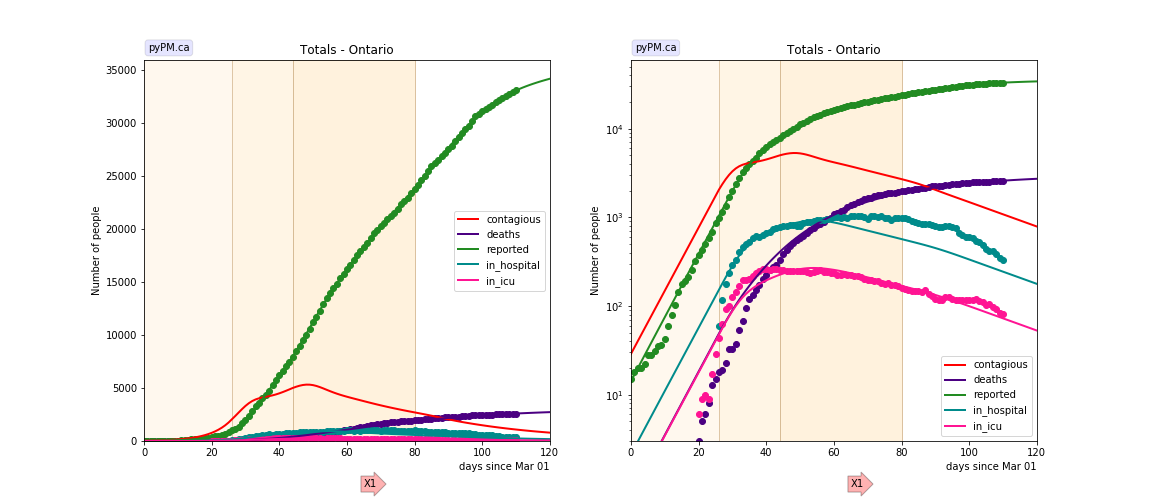
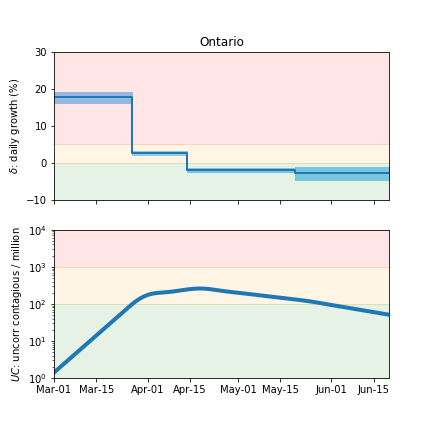
Ontario
The data is consistent with 2 changes in tranmission rate. A third transition is added for May 19 to measure the new transmission rate.
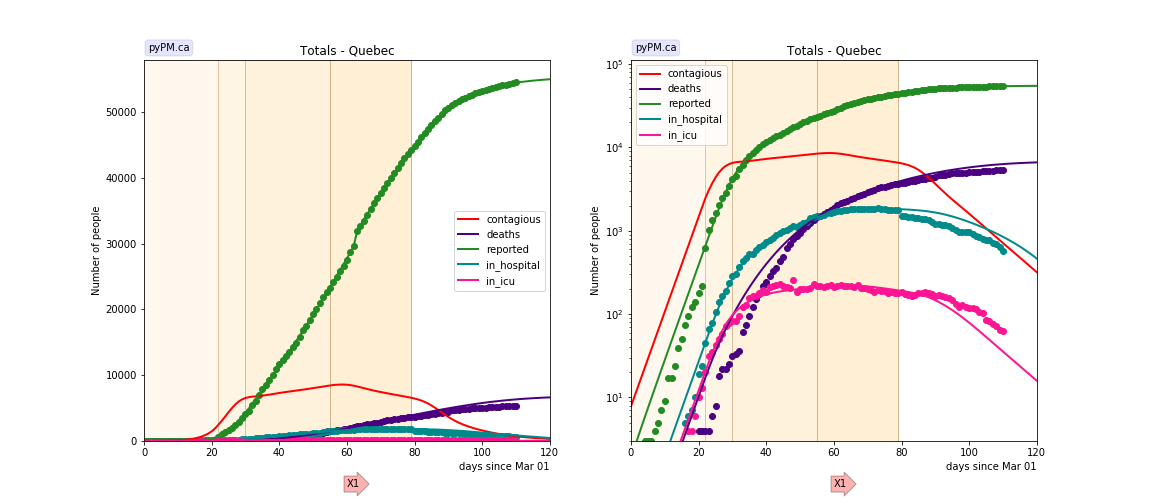
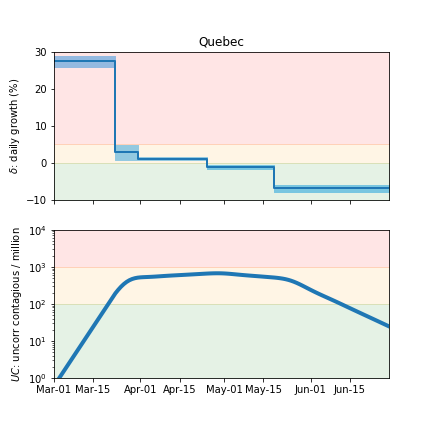
Quebec
Four changes in transmission rate are necessary to fit the data. A large backlog of case reports were released on May 3. A significant reduction in transmission in May. The best fit for the transition date is May 18.
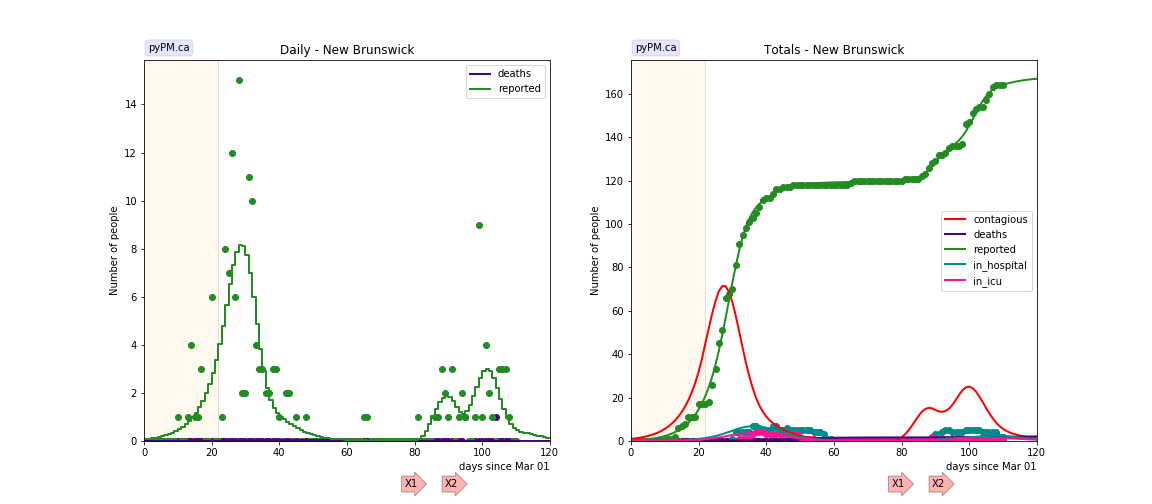
New Brunswick
The data is consistent with two changes in transmission rates and outbreaks in late May (in Campbellton region).
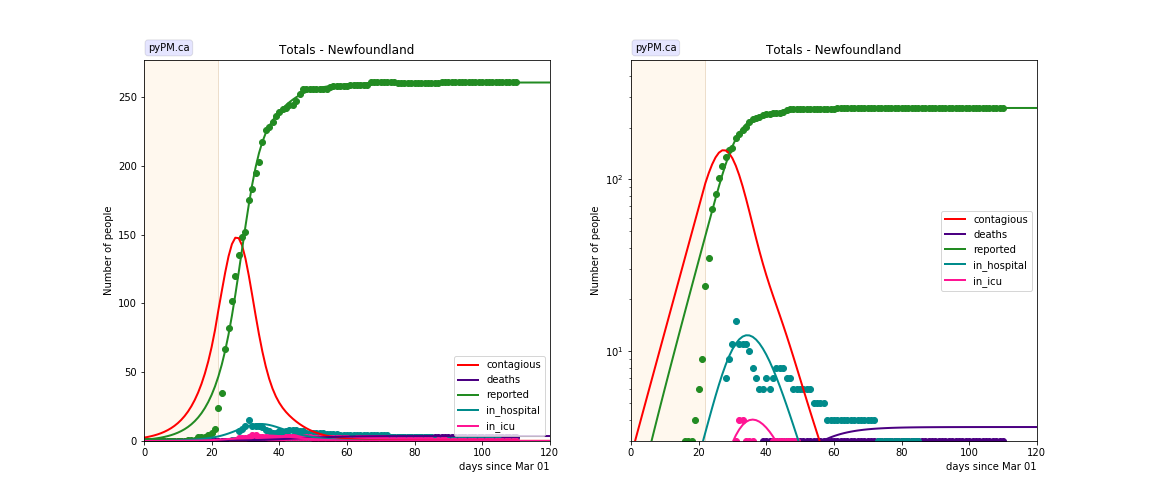
Newfoundland
The data is consistent with one change in transmission rate.
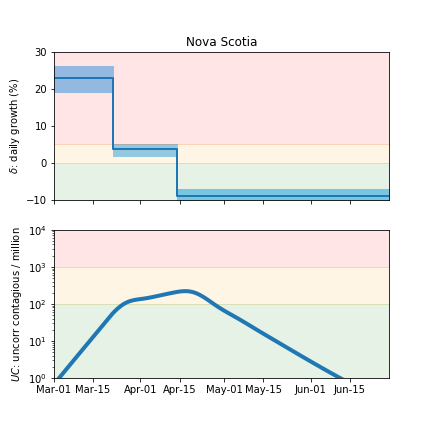
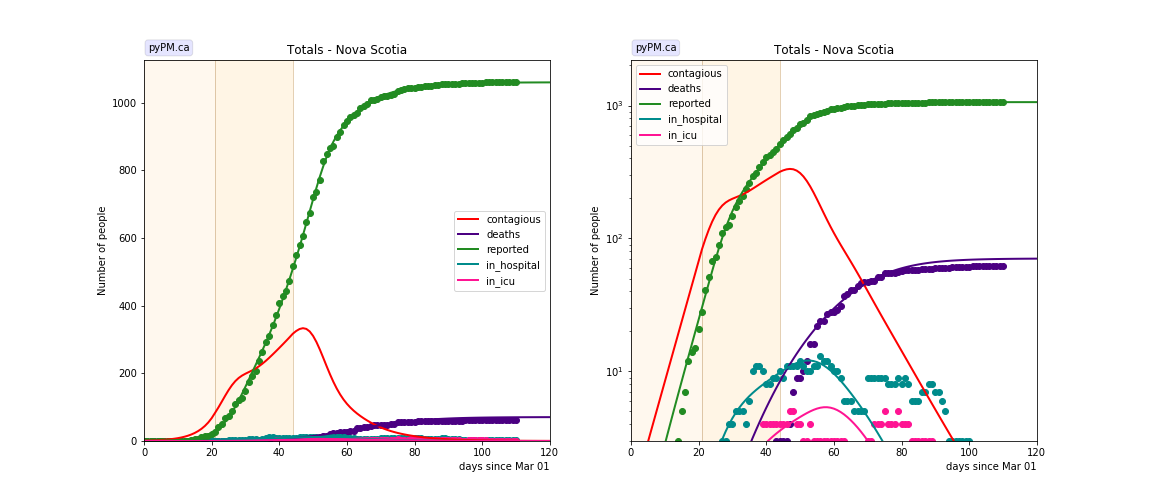
Nova Scotia
The data is consistent with two changes in transmission rates.
Tables
The tables below are results from the fits to reference model 2.3.
Daily fractional growth rates (δ)
| prov | δ0 | day 1 | δ1 | day 2 | δ2 | day 3 | δ3 | day 4 | δ4 |
|---|---|---|---|---|---|---|---|---|---|
| bcc | 0.187 +/- 0.030 | 16 | -0.040 +/- 0.008 | 80 | -0.011 +/- 0.024 | ||||
| ab | 0.158 +/- 0.019 | 20 | -0.072 +/- 0.006 | 81 | 0.034 +/- 0.018 | ||||
| on | 0.178 +/- 0.007 | 26 | 0.026 +/- 0.003 | 44 | -0.019 +/- 0.002 | 80 | -0.028 +/- 0.009 | ||
| qc | 0.298 +/- 0.011 | 22 | 0.029 +/- 0.011 | 30 | 0.011 +/- 0.003 | 55 | -0.011 +/- 0.003 | 79 | -0.071 +/- 0.004 |
| ns | 0.231 +/- 0.019 | 21 | 0.036 +/- 0.008 | 44 | -0.090 +/- 0.011 |
- δ0: initial daily fractional growth parameter
- day 1: days after March 1, 2020 when transmission rate changed
Infection status
The following plots summarize the infection history. The upper plot shows the daily growth/decline from the fit. Bands show approximate 95% CL intervals. The lower plot shows the size of the infection: the uncorrected circulating contagious population per million. Only regions with sufficient statistics to properly analyze uncertainty in δ are shown.
BC
Alberta
Ontario
Quebec
Nova Scotia