June 20, 2020 Analysis of BC regional data
The following shows graphs followed by tables. All regional data are consistent with a single change in transmission rate and a case reporting anomaly. Cases from the Northern Health region are not shown because there are very few cases reported.
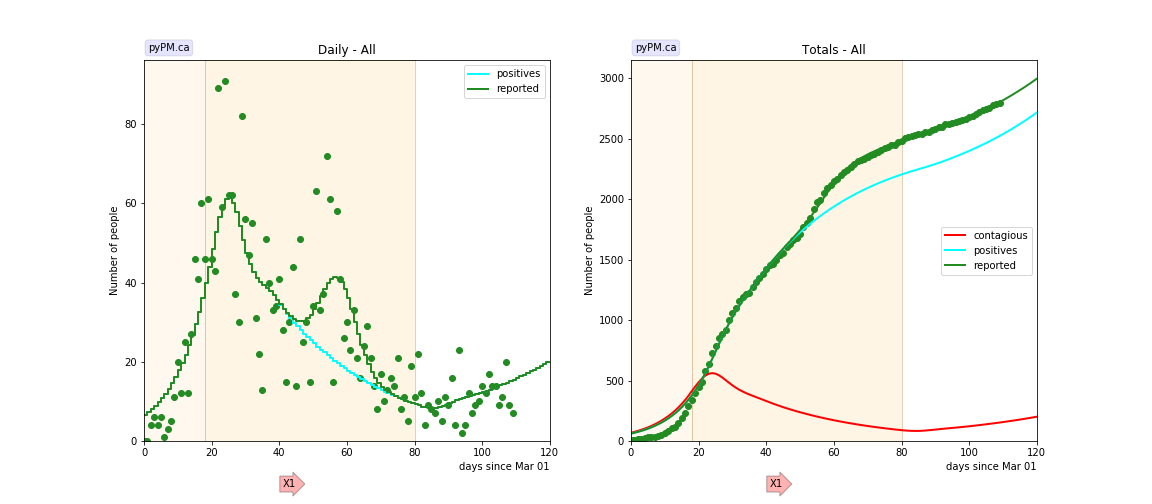
BC total
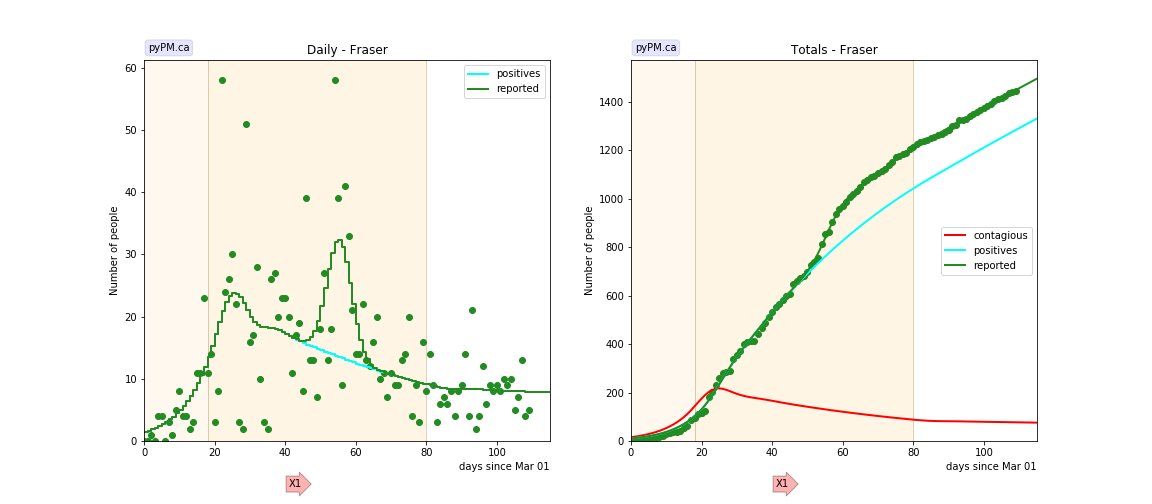
Fraser
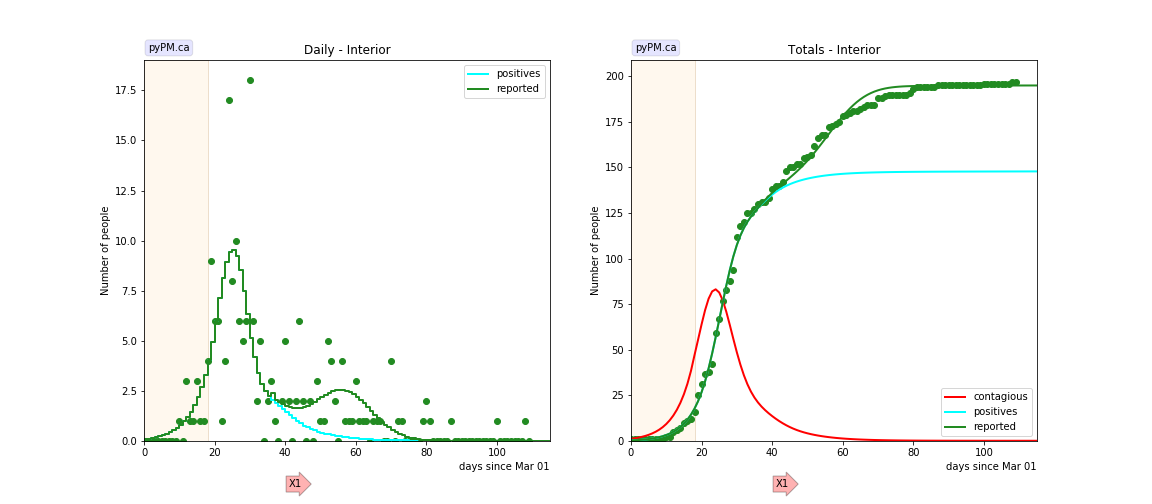
Interior
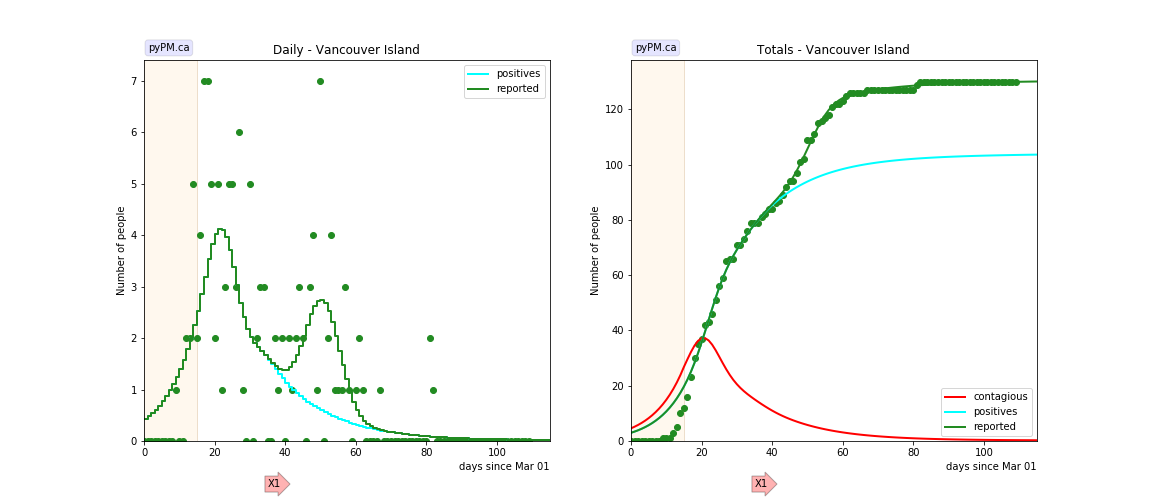
Island
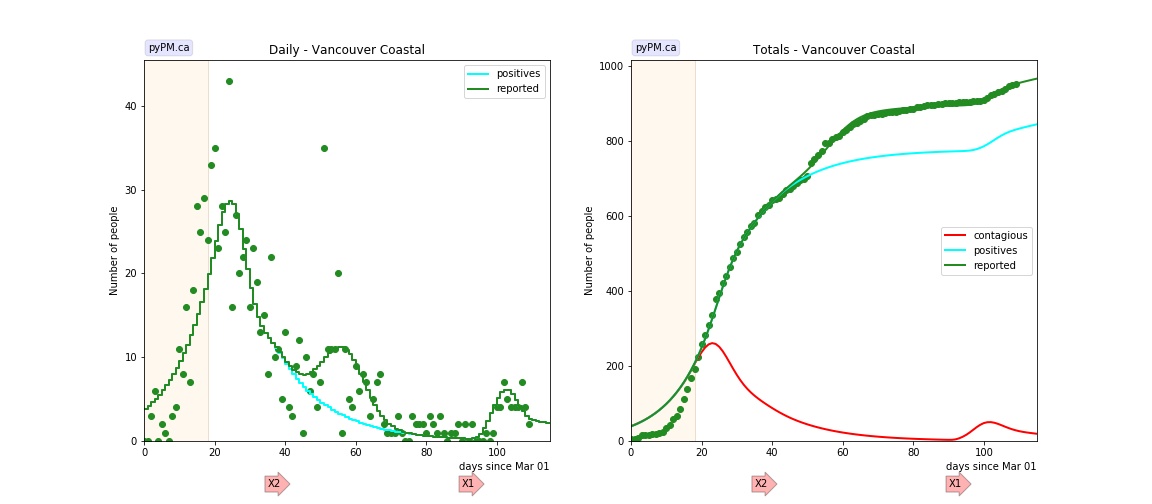
Coastal
A small outbreak appears to be underway starting in mid June.
Tables
The tables below are results from the fits to reference model 2.3. These are shown for purposes of comparison.
Daily fractional growth rates (δ)
| HA | δ0 | day 1 | δ1 | day 2 | δ2 |
|---|---|---|---|---|---|
| bc | 0.105 | 18 | -0.029 | 80 | 0.026 |
| bc* | 0.187 +/- 0.030 | 16 | -0.040 +/- 0.008 | 80 | -0.011 +/- 0.024 |
| fraser | 0.131 | 18 | -0.014 | 80 | -0.002 |
| interior | 0.224 | 18 | -0.104 | ||
| island | 0.124 | 15 | -0.058 | ||
| coastal | 0.096 | 18 | -0.061 |
- δ0: initial daily fractional growth parameter
-
day 1: days after March 1, 2020 when transmission rate changed
- bc* is the result from the Canada wide study that used case numbers reported at the daily briefings. The changes in the BC data (with modified case dates) affects the estimate for δ0.
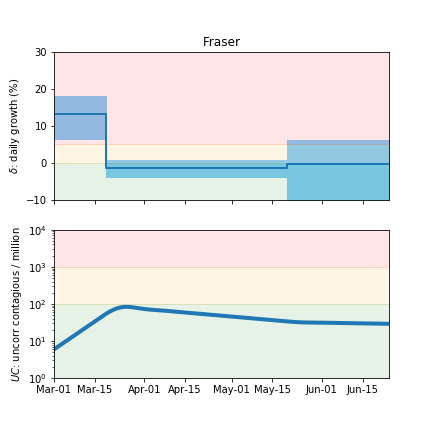
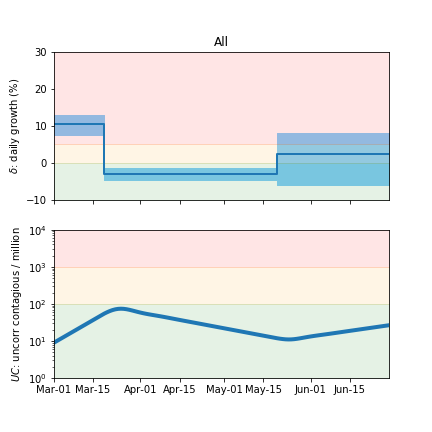
Infection status
The following plots summarize the infection history. The upper plot shows the daily growth/decline from the fit. Bands show approximate 95% CL intervals. The lower plot shows the size of the infection: the uncorrected circulating contagious population per million.
BC total
Fraser