November 15, 2020 Analysis of USA state data
Summary: Cases
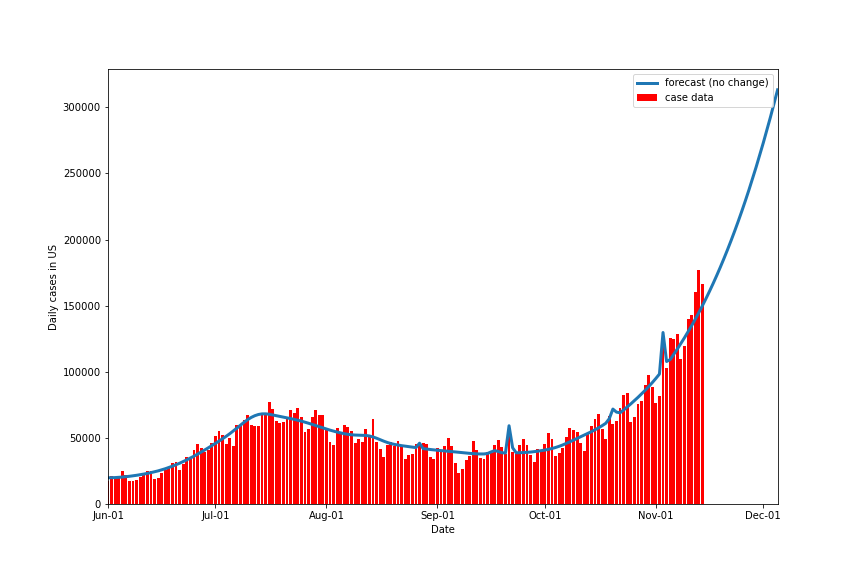
The histogram shows the daily cases for the 50 states, DC and PR. The curve labelled “forecast (no change)” shows the expected daily cases by adding the expectations from all of the individual state models fit to the state data, as shown below.
Summary: Deaths
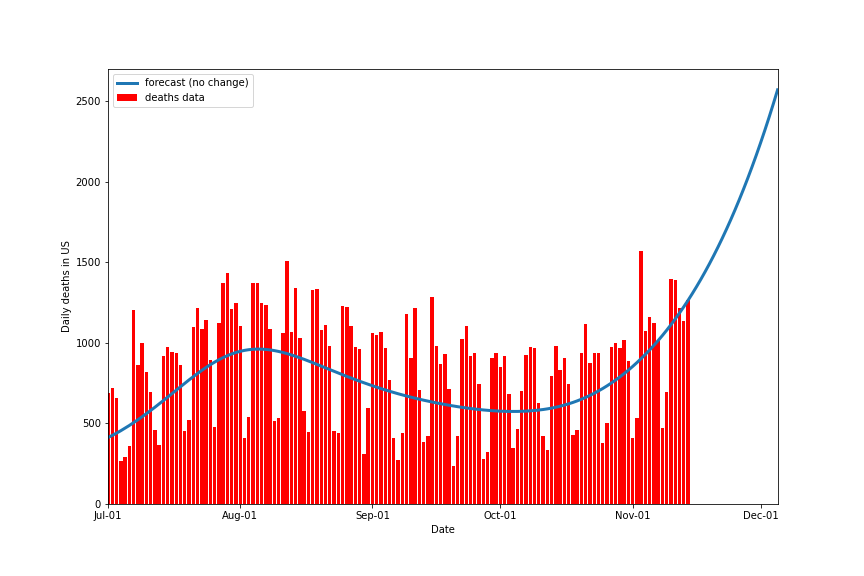
This plot uses the same convention as the previous one: this time for daily deaths.
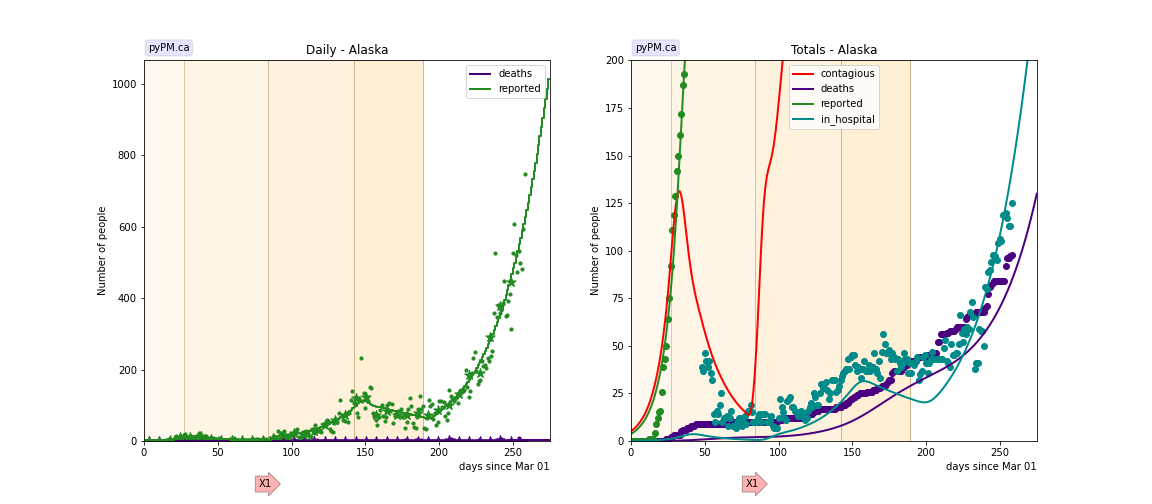
Individual state fits
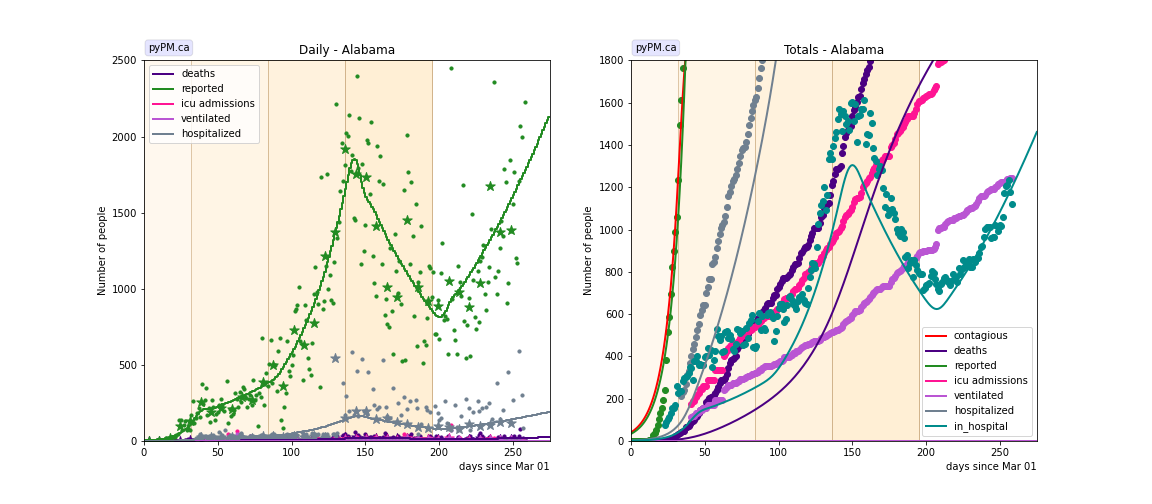
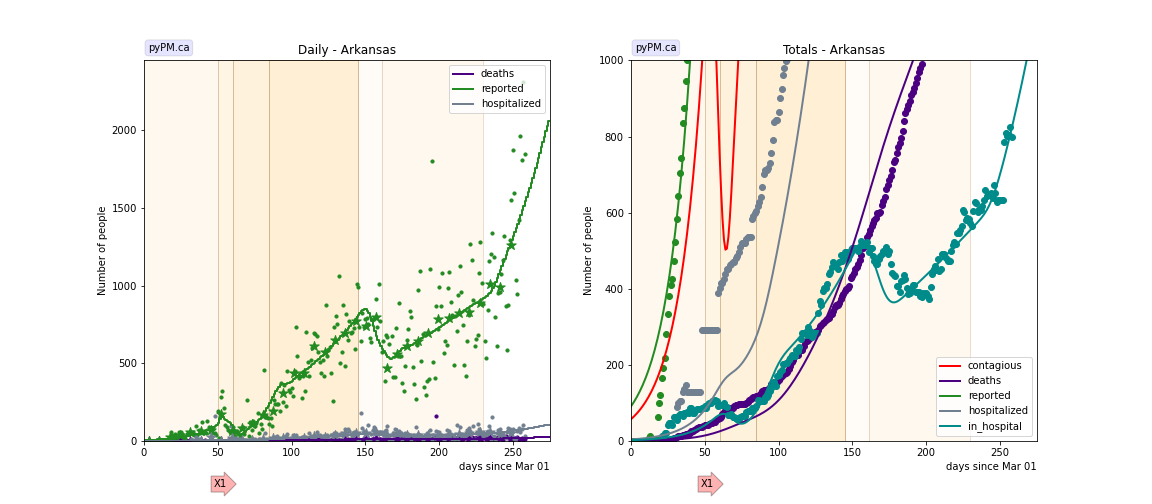
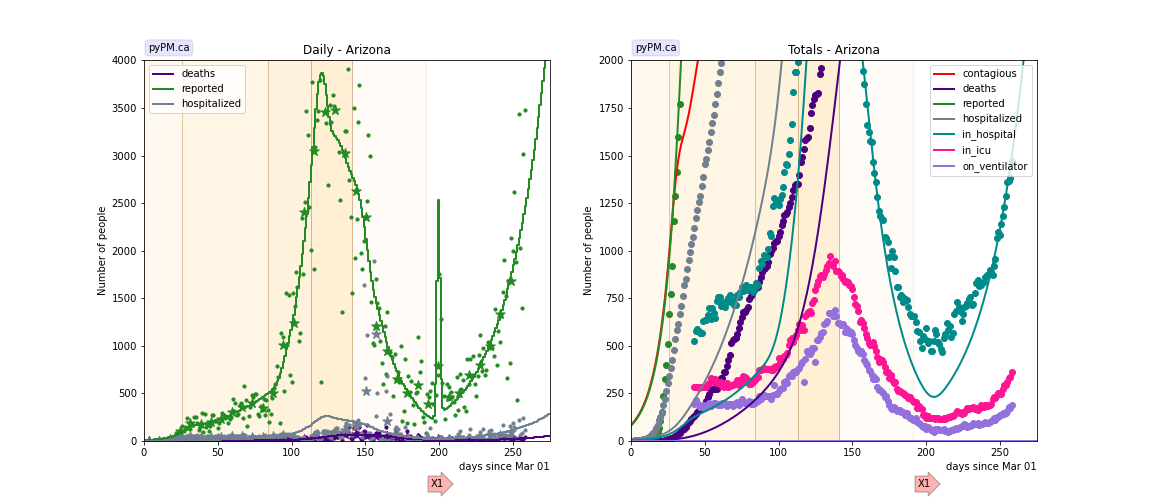
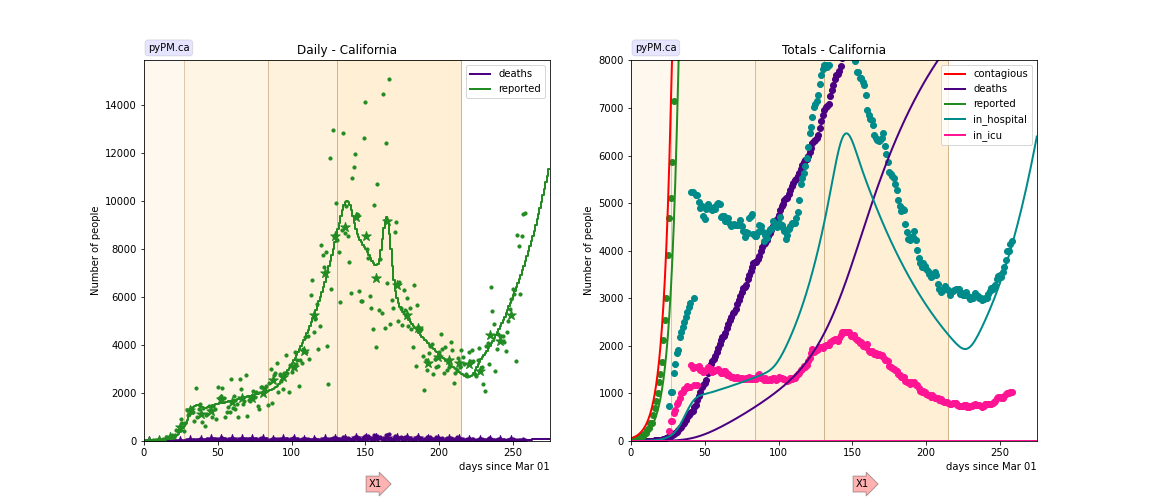
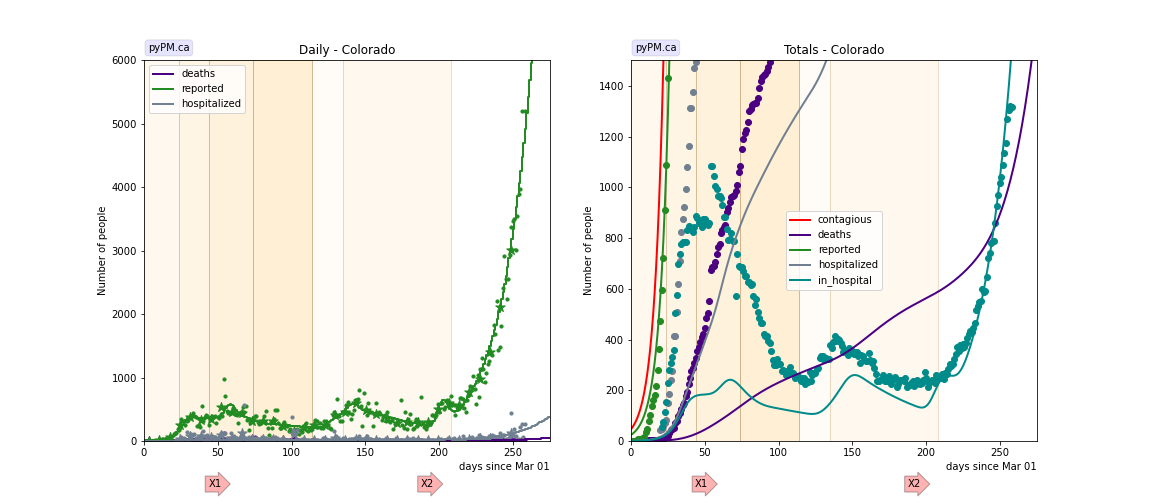
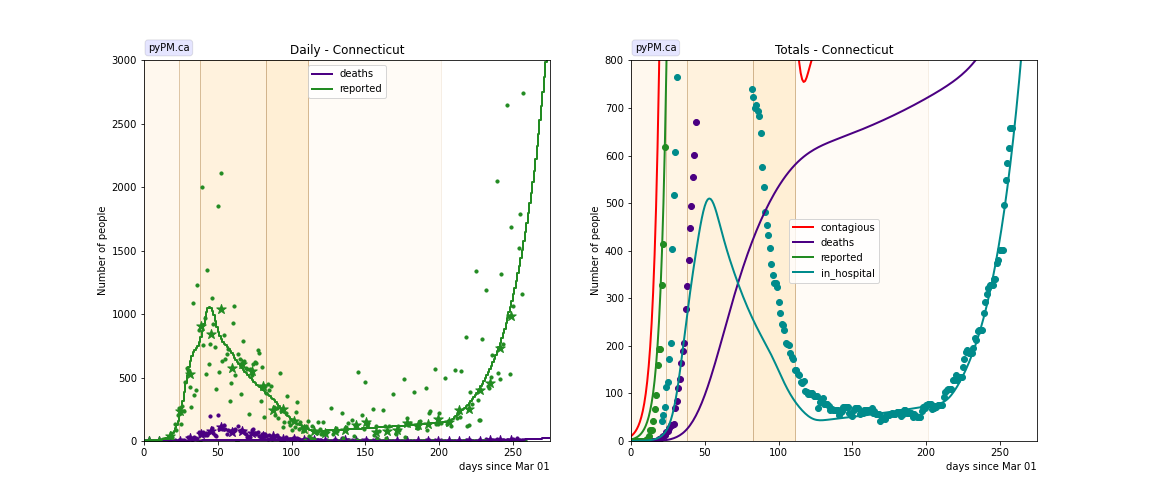
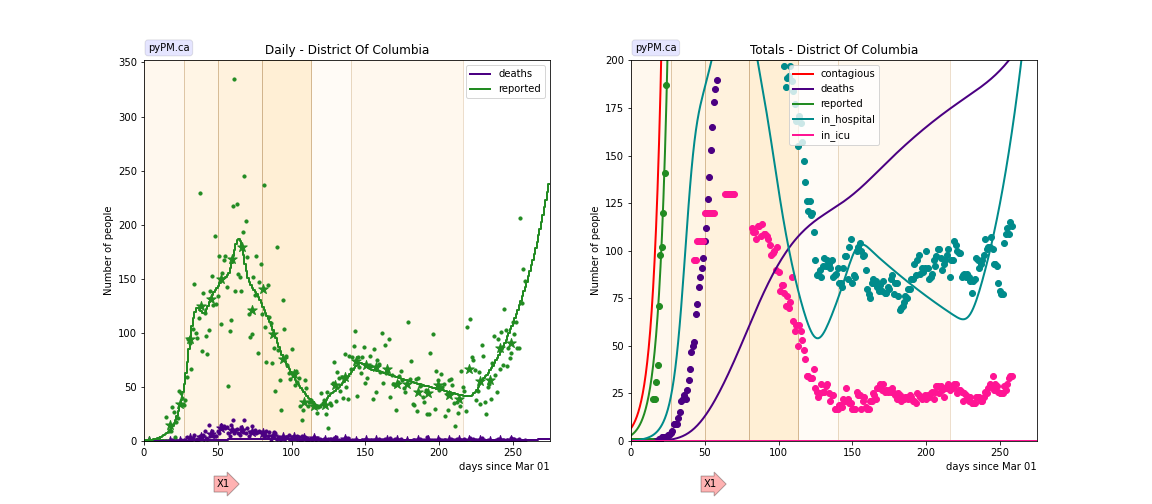
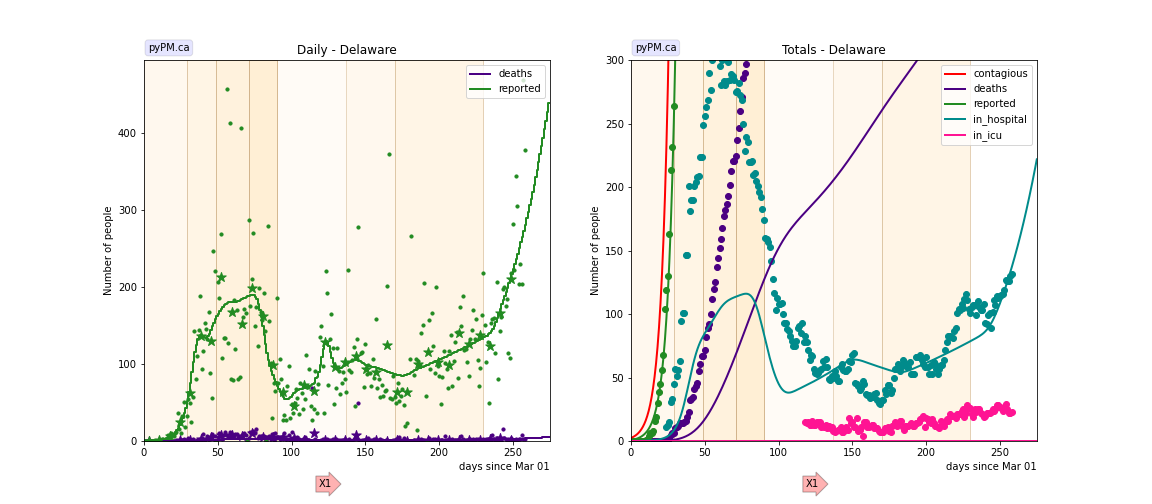
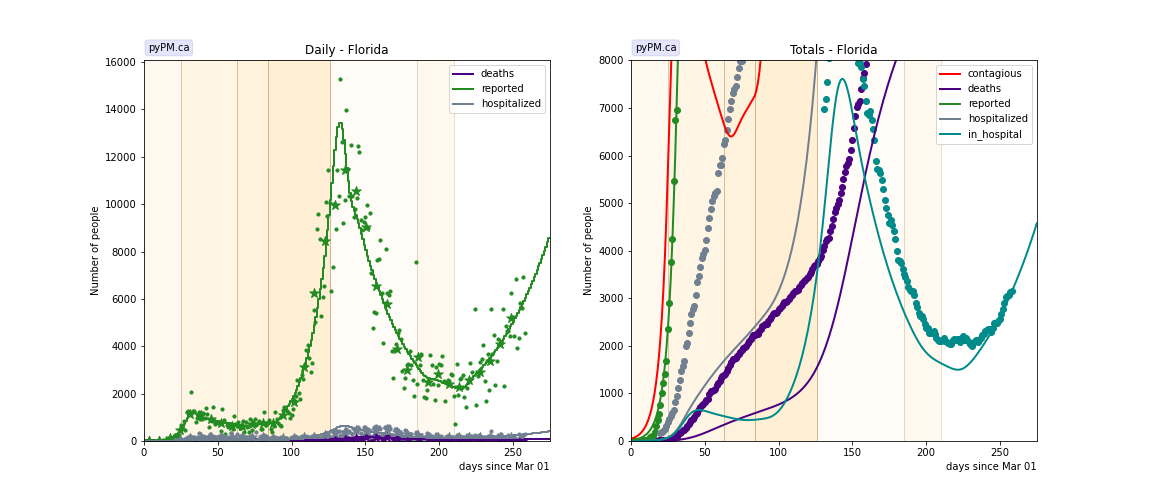
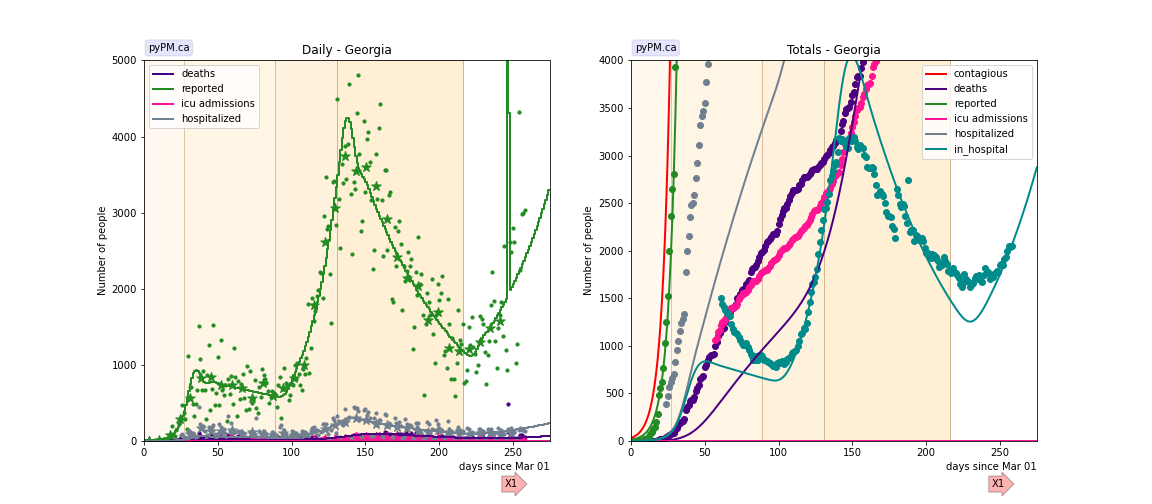
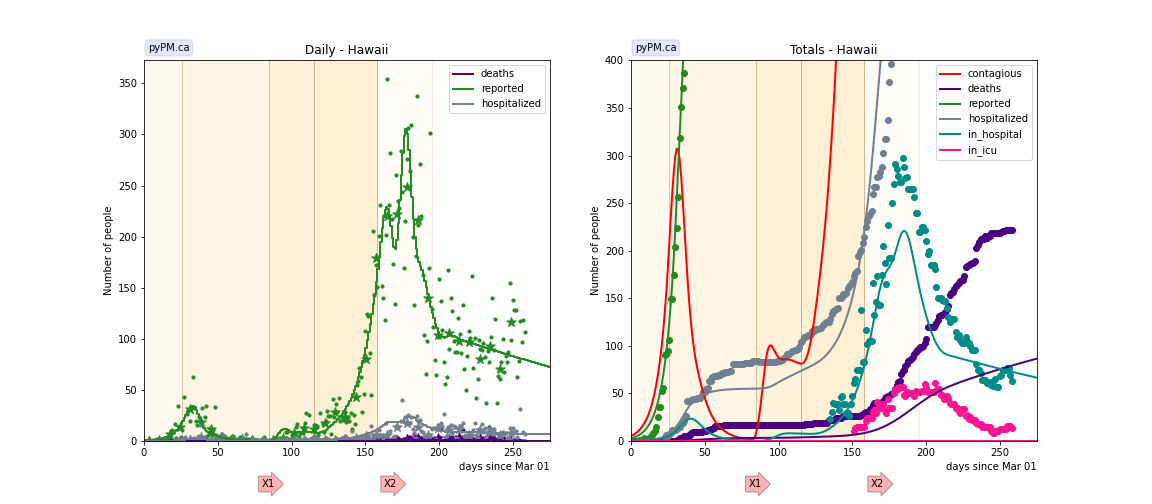
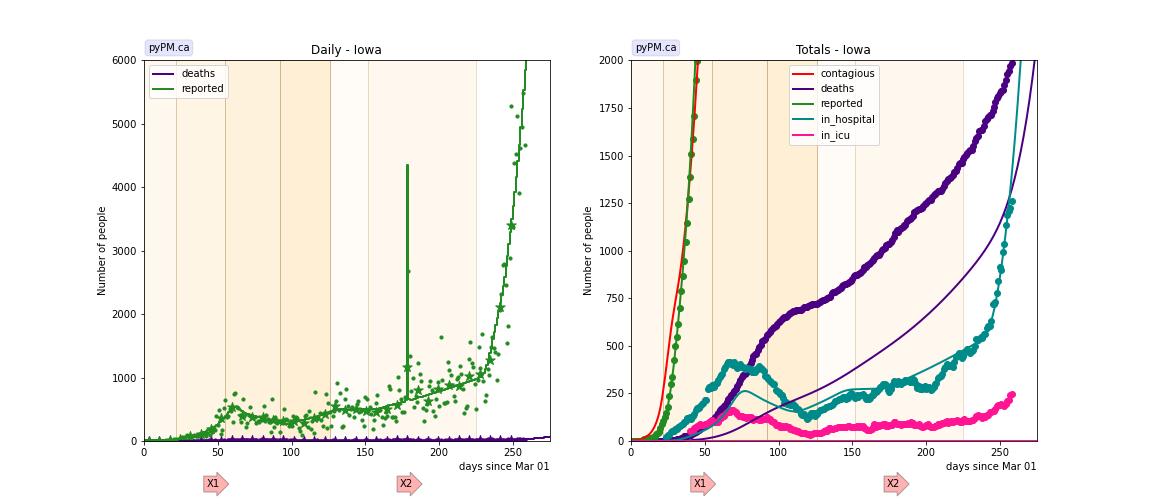
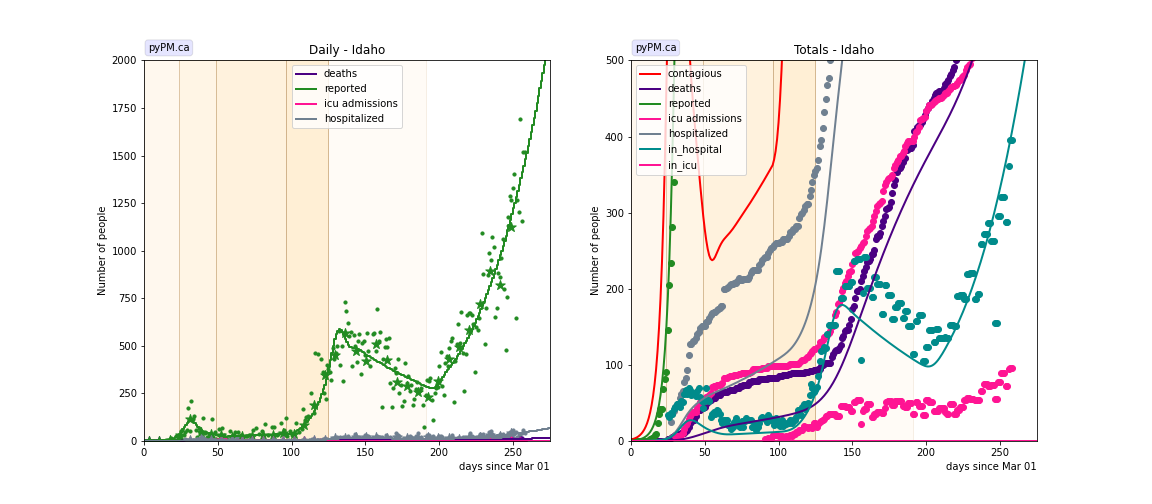
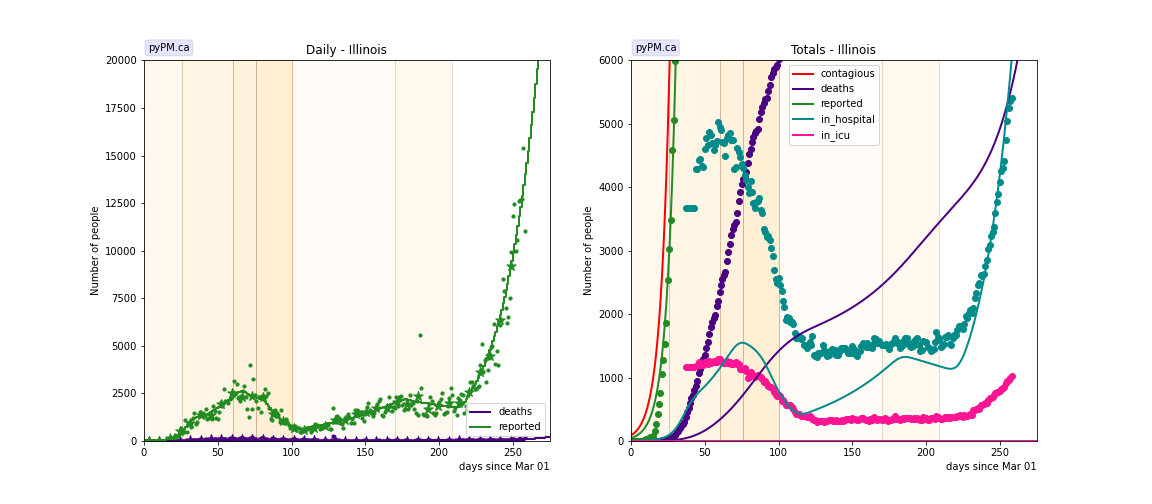
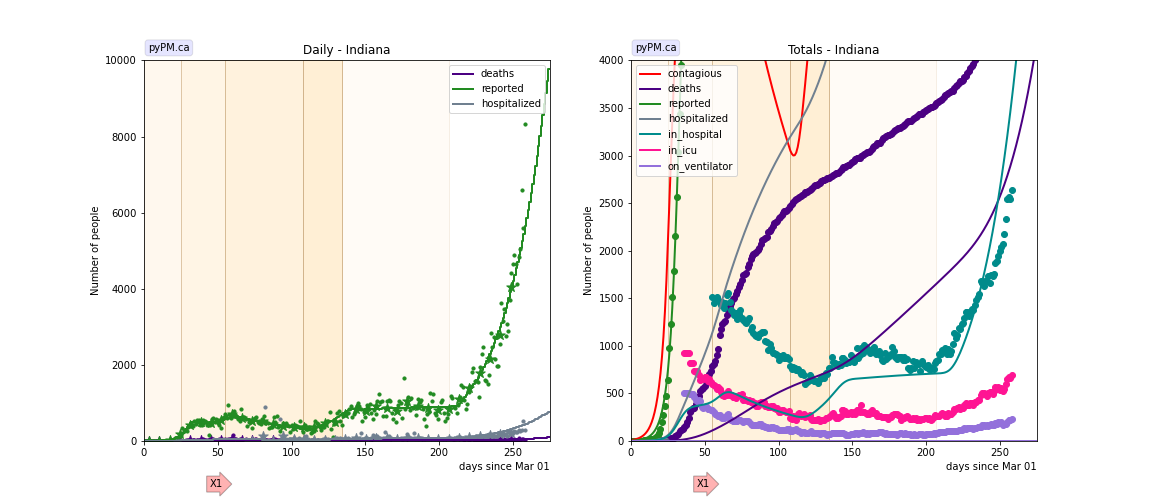
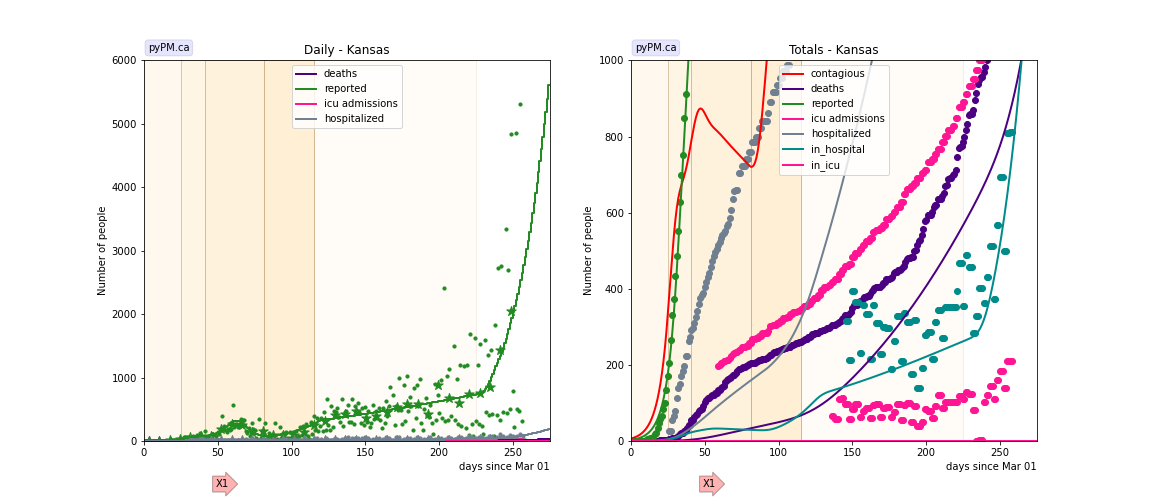
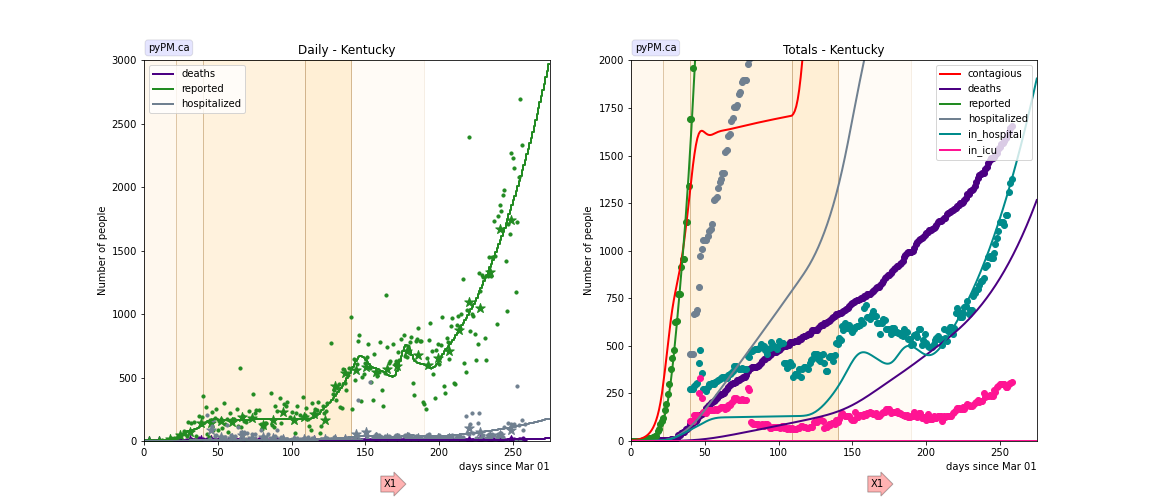
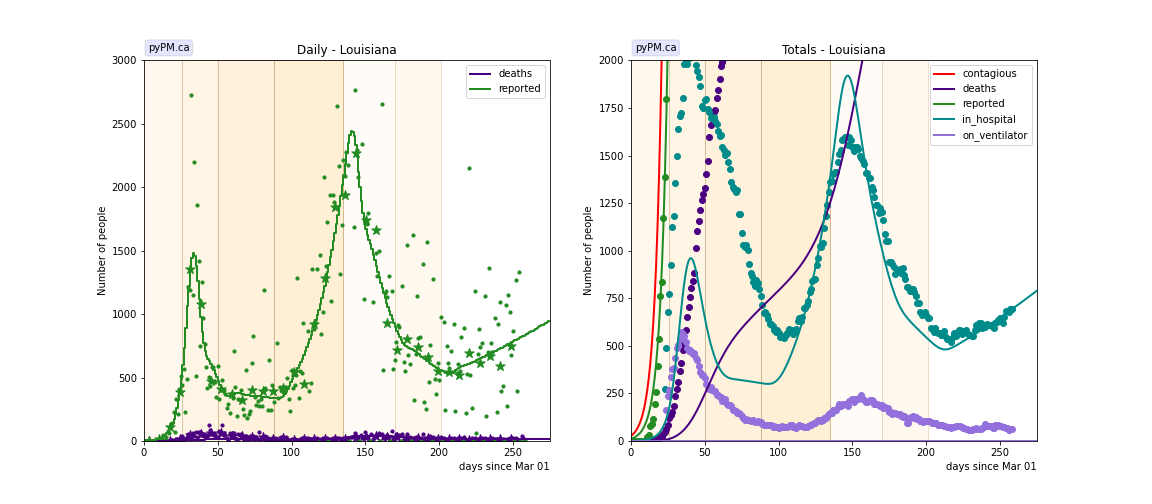
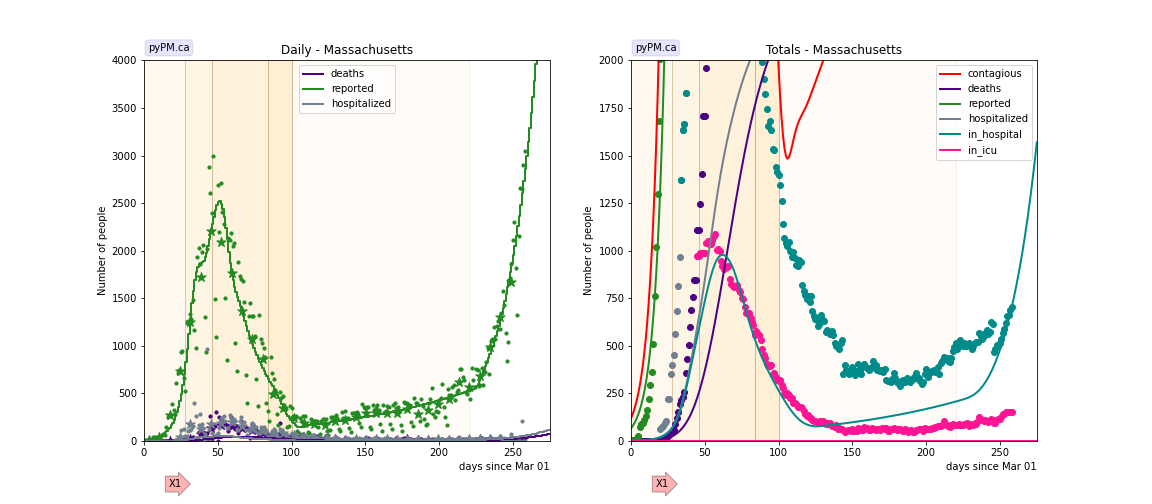
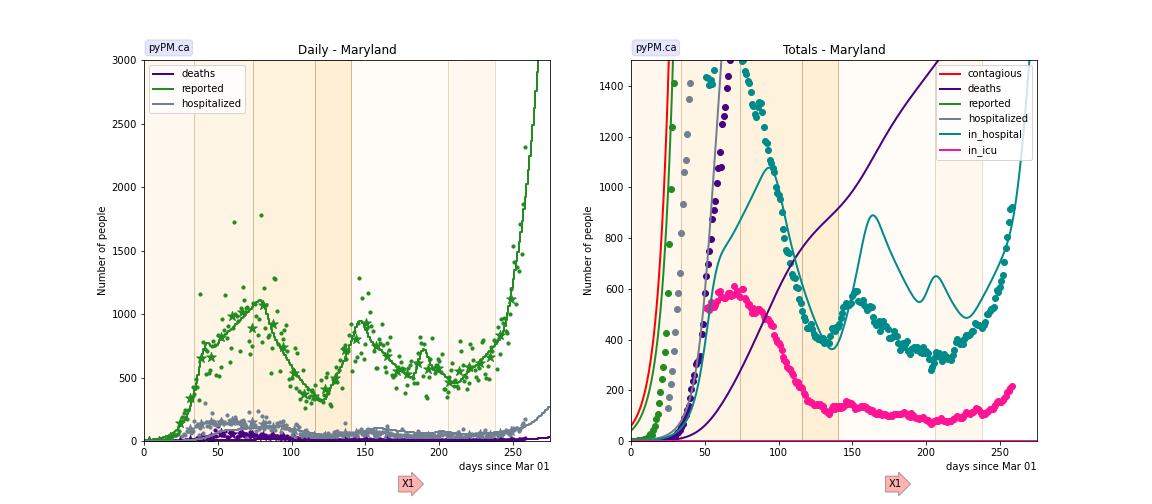
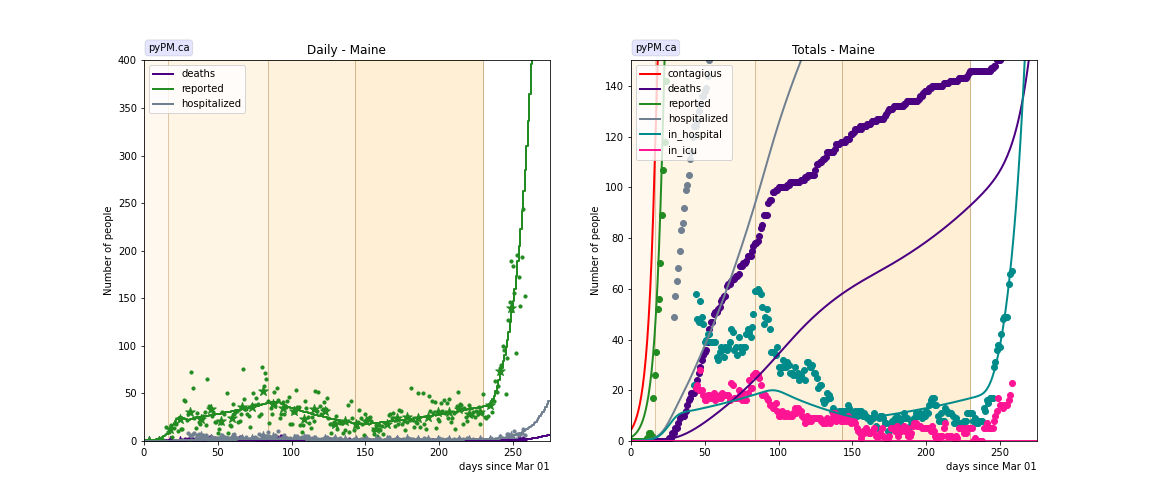
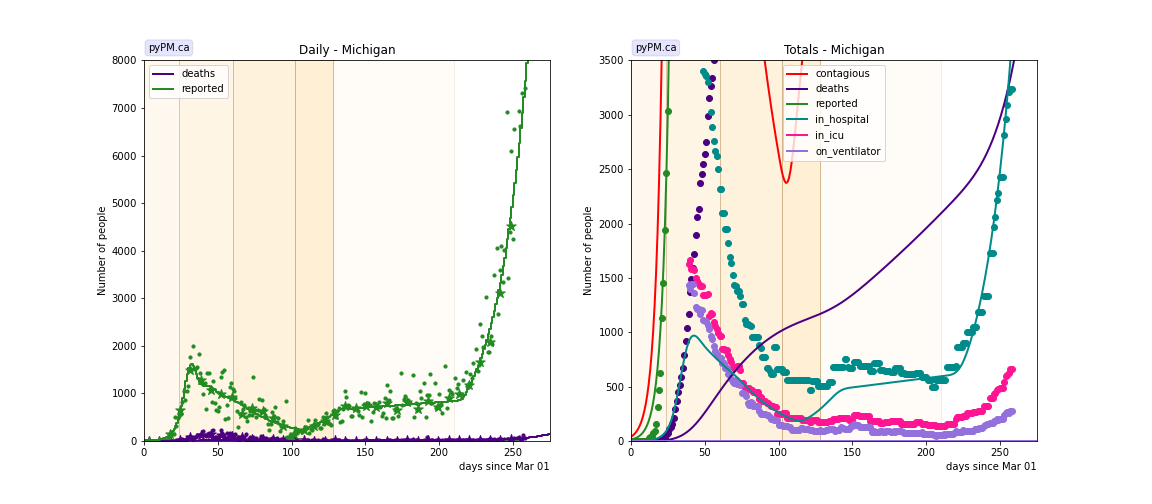
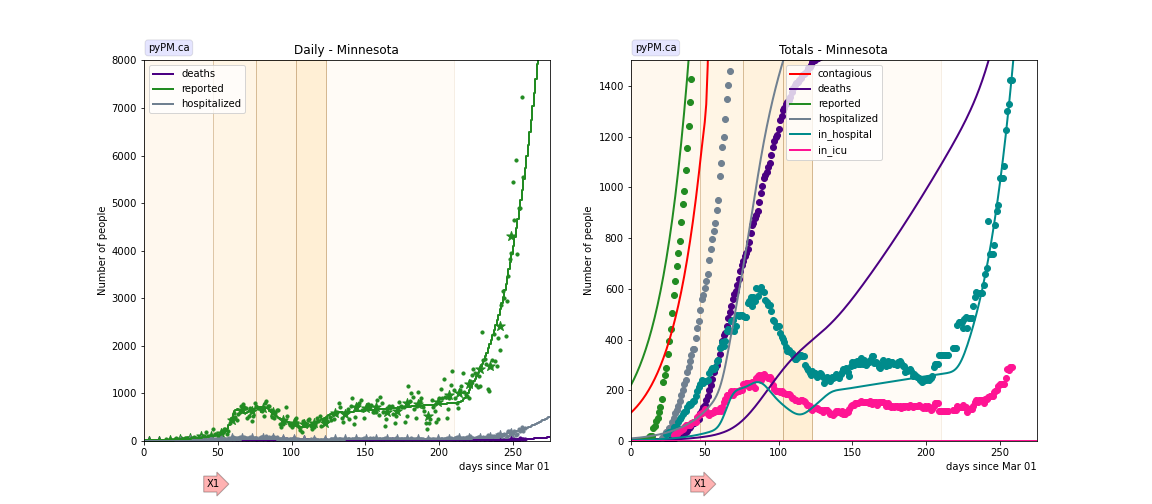
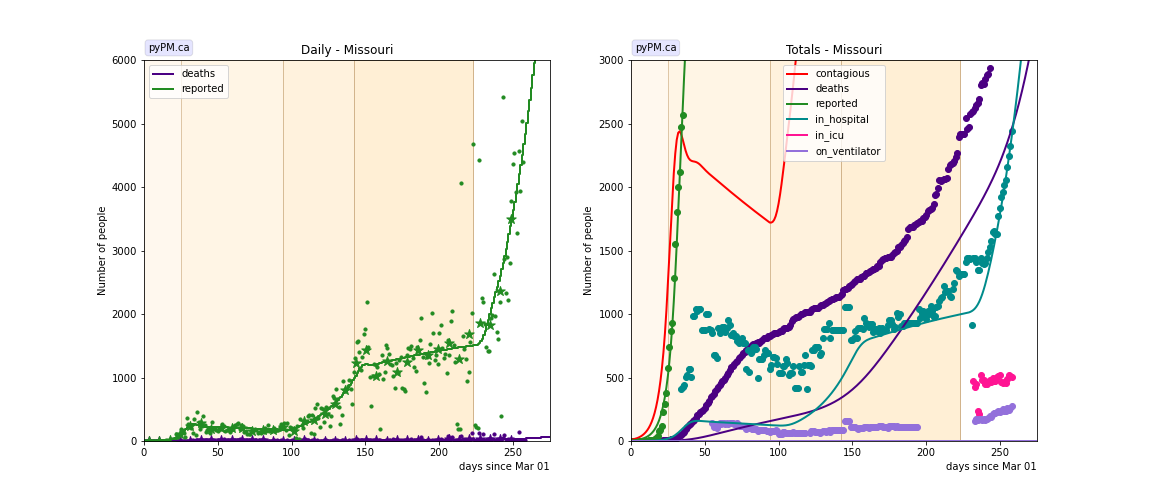
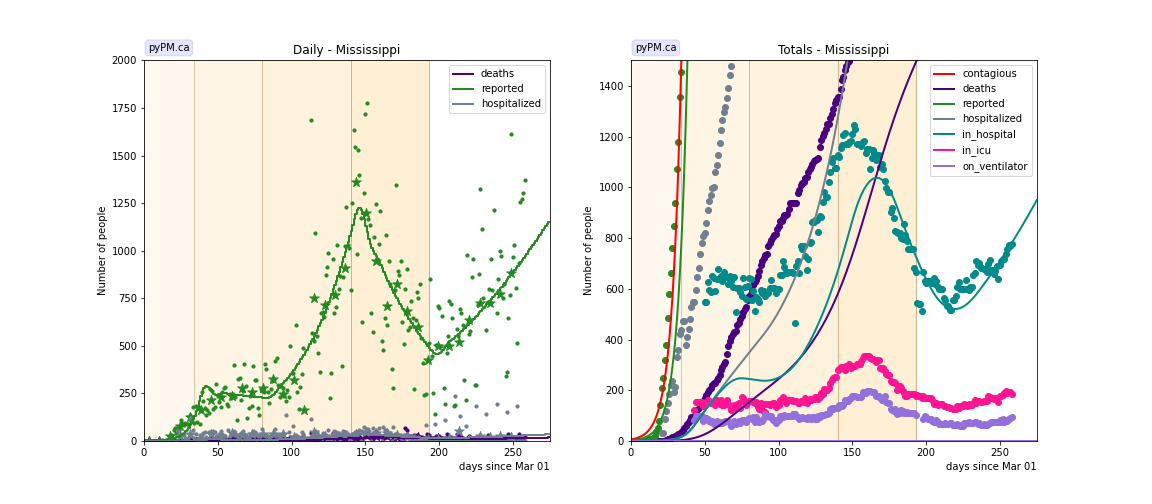
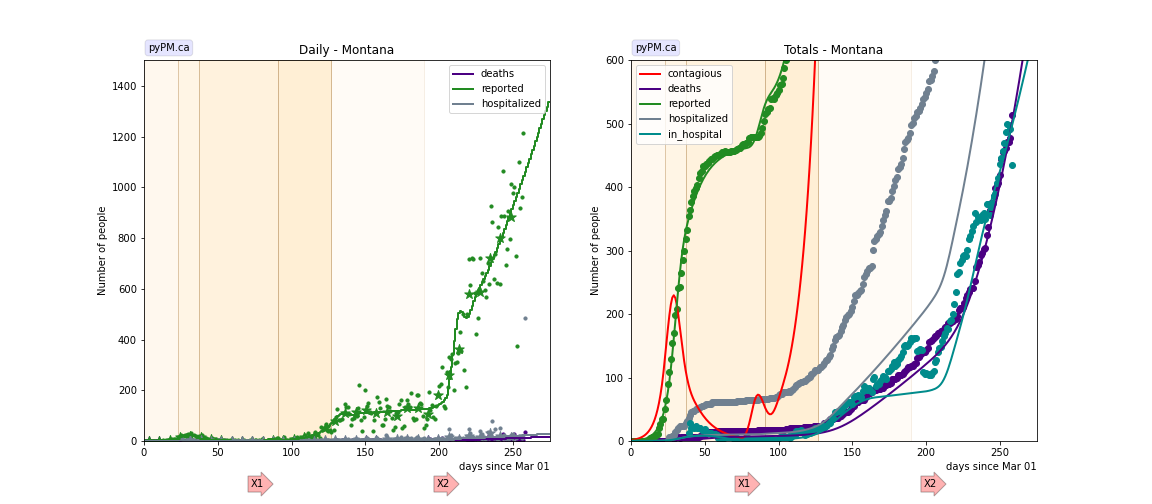
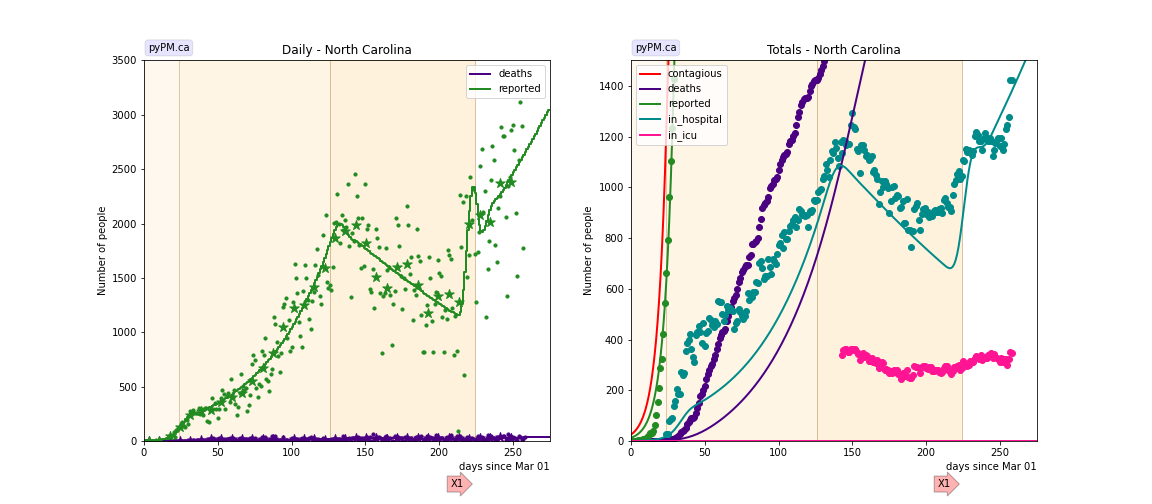
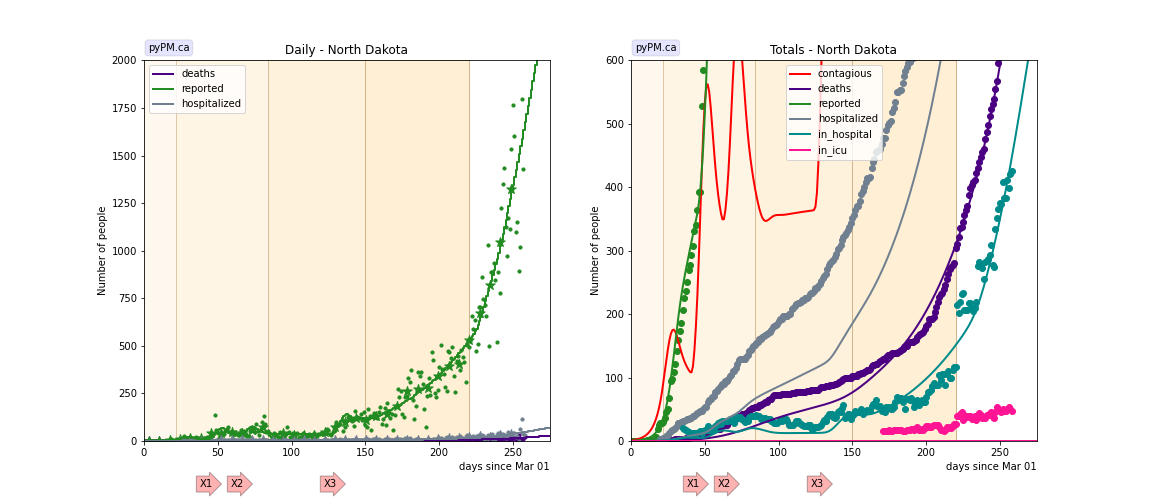
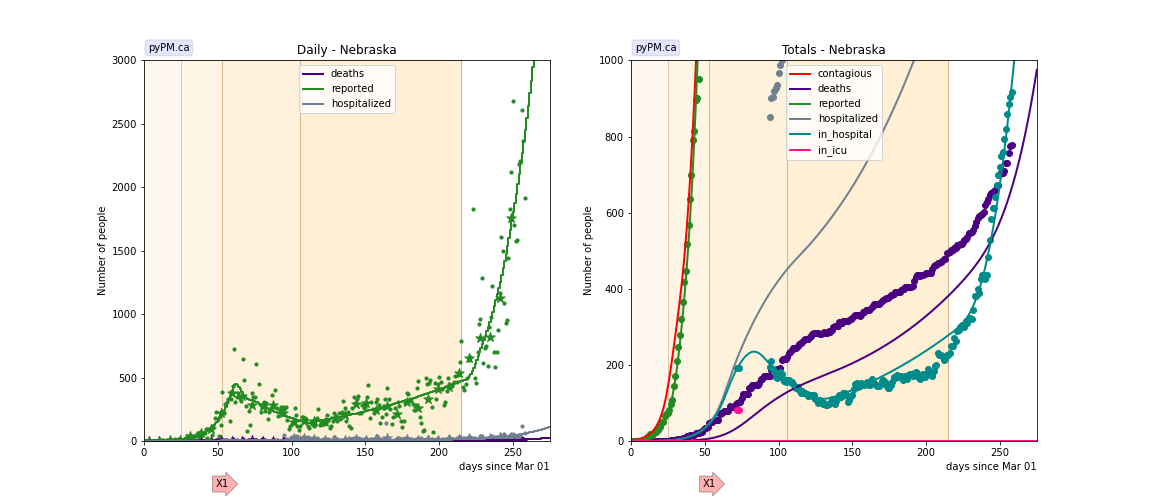
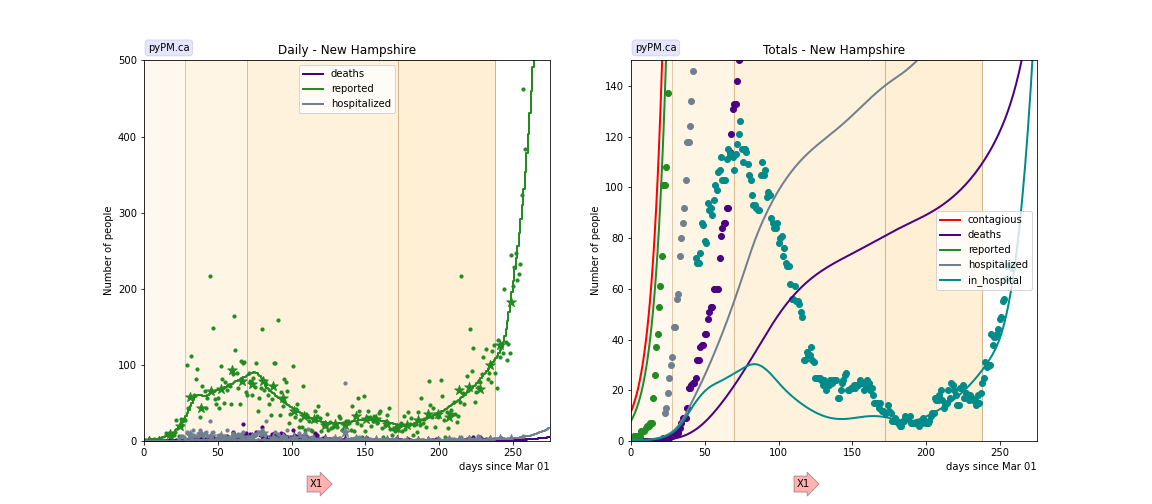
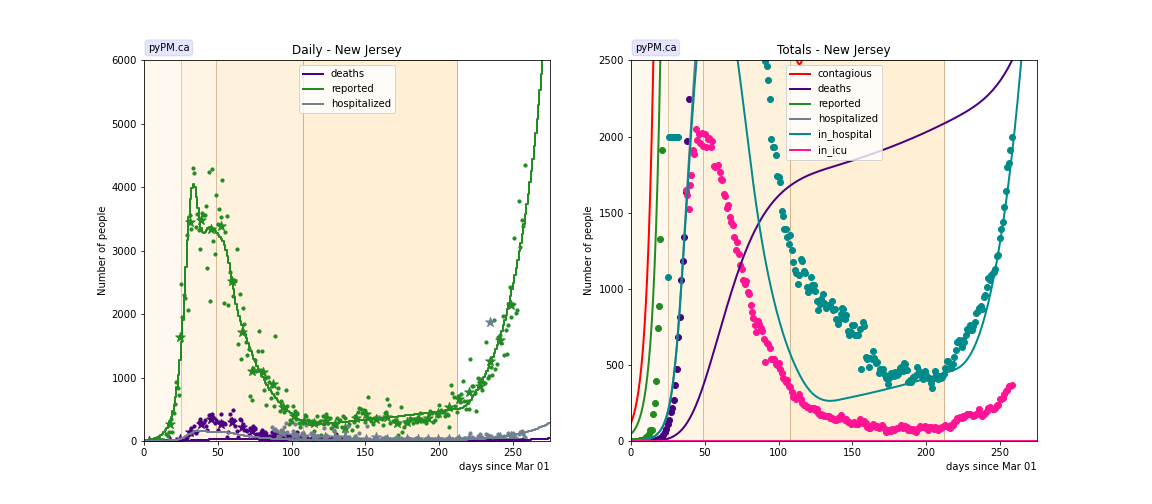
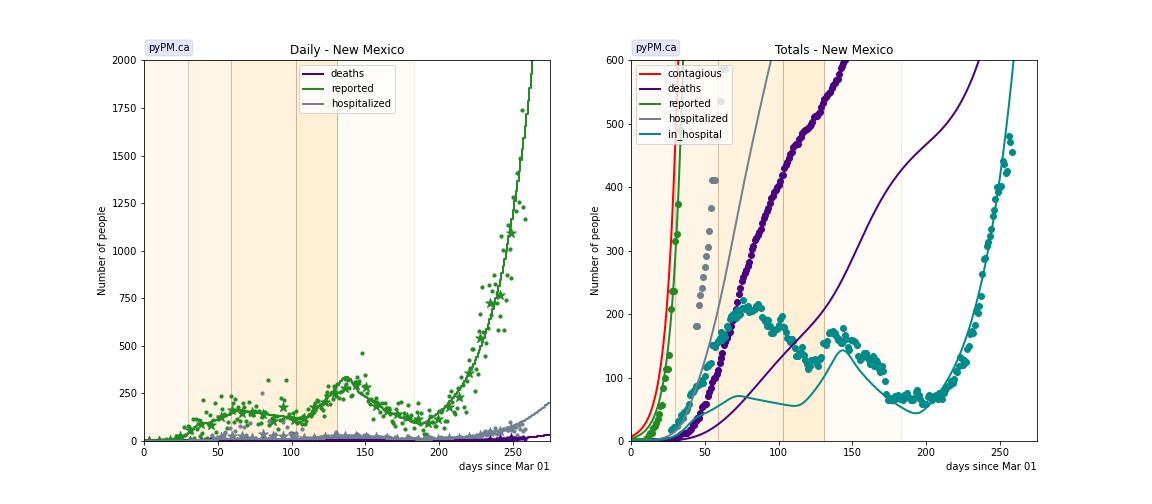
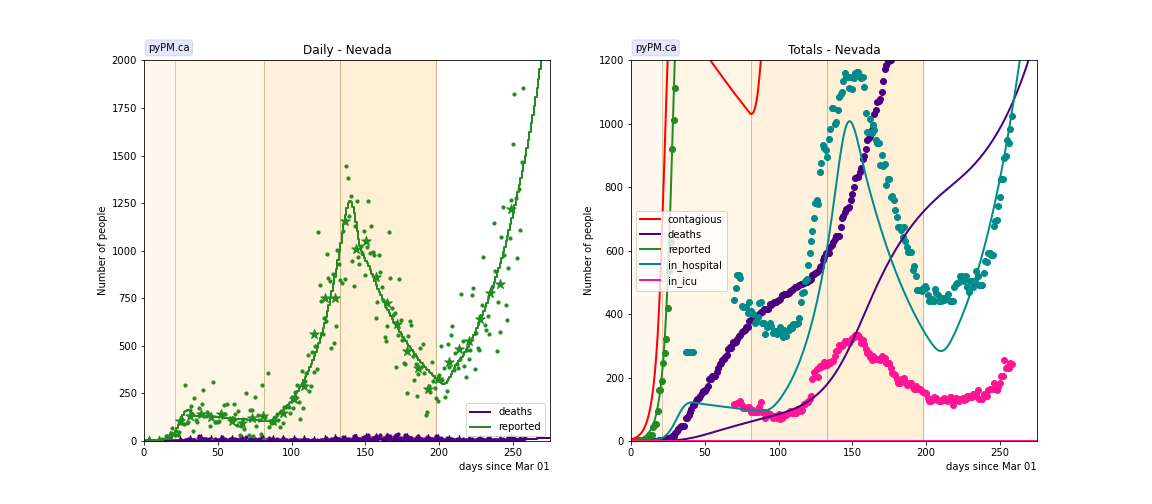
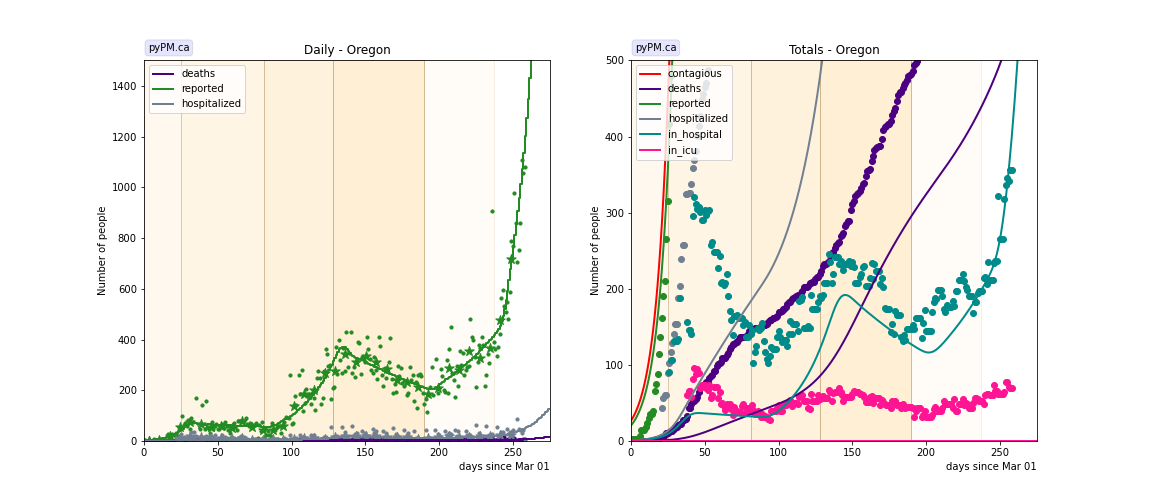
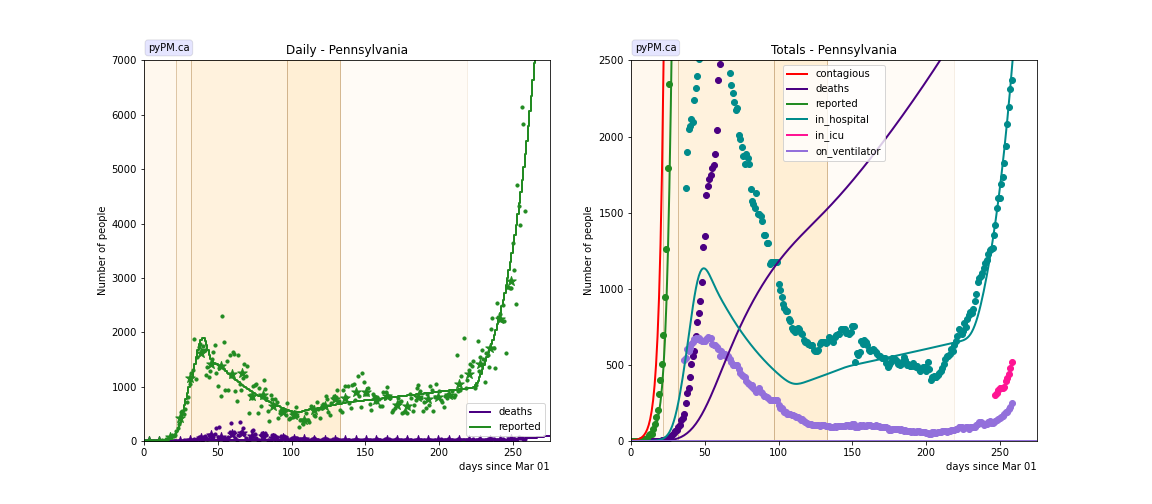
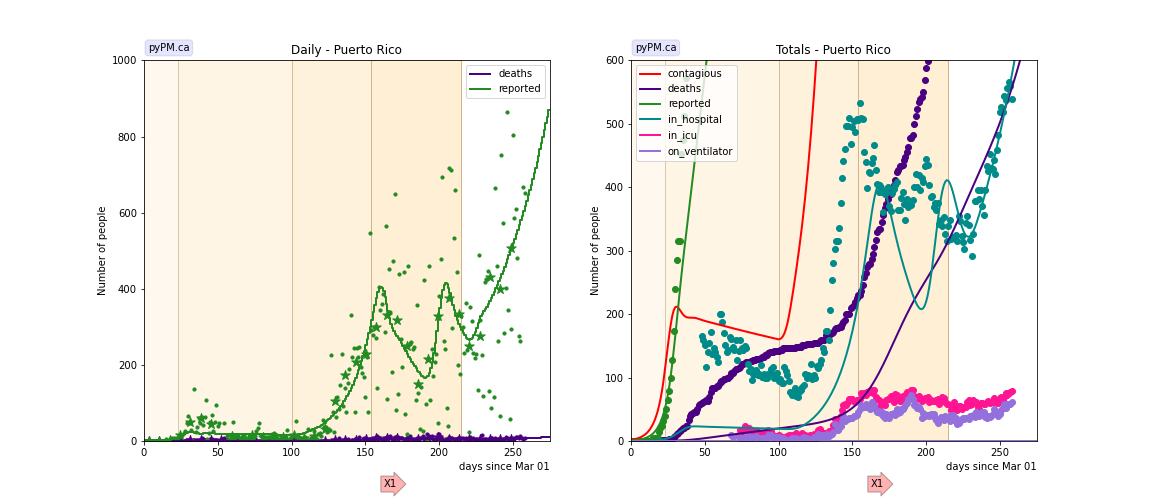
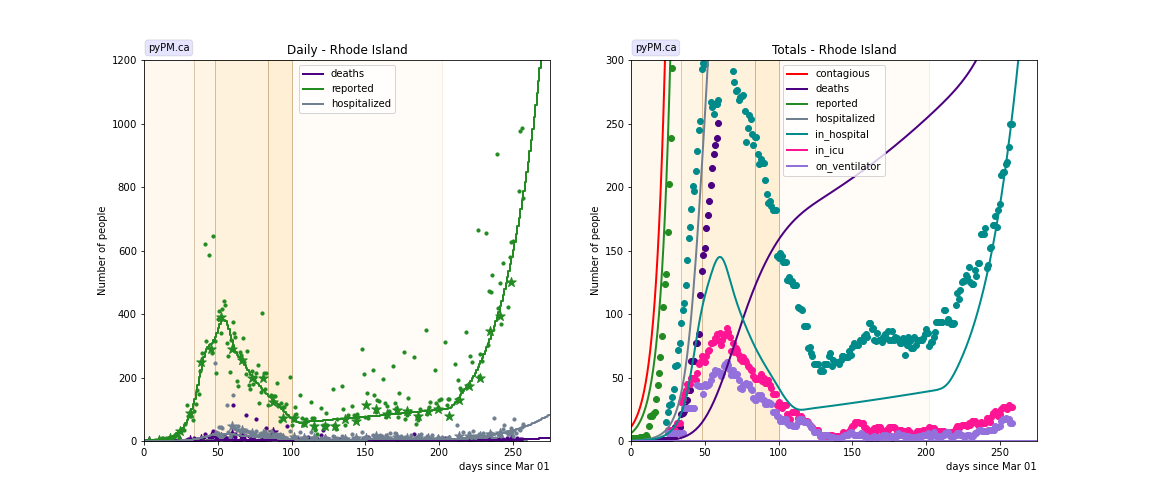
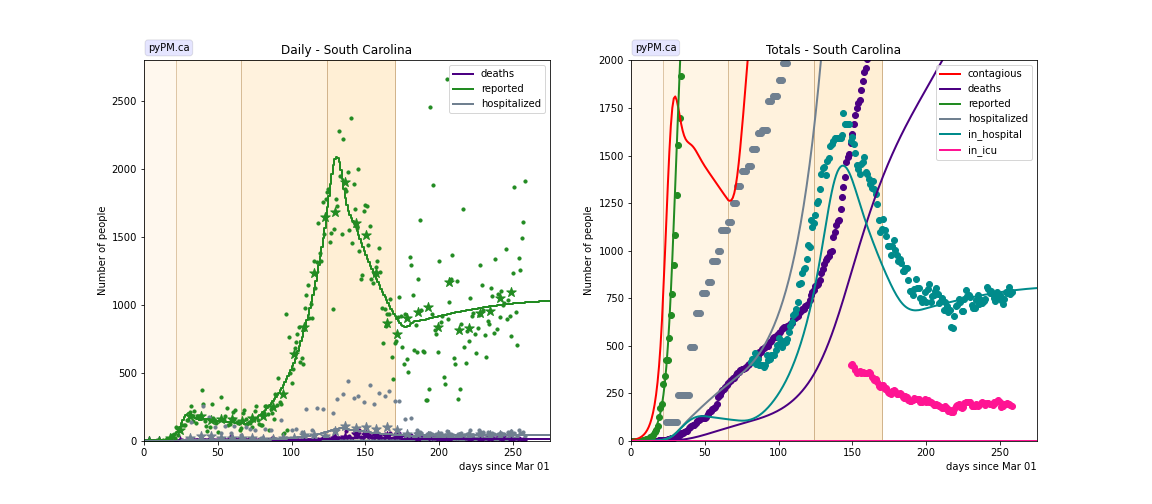
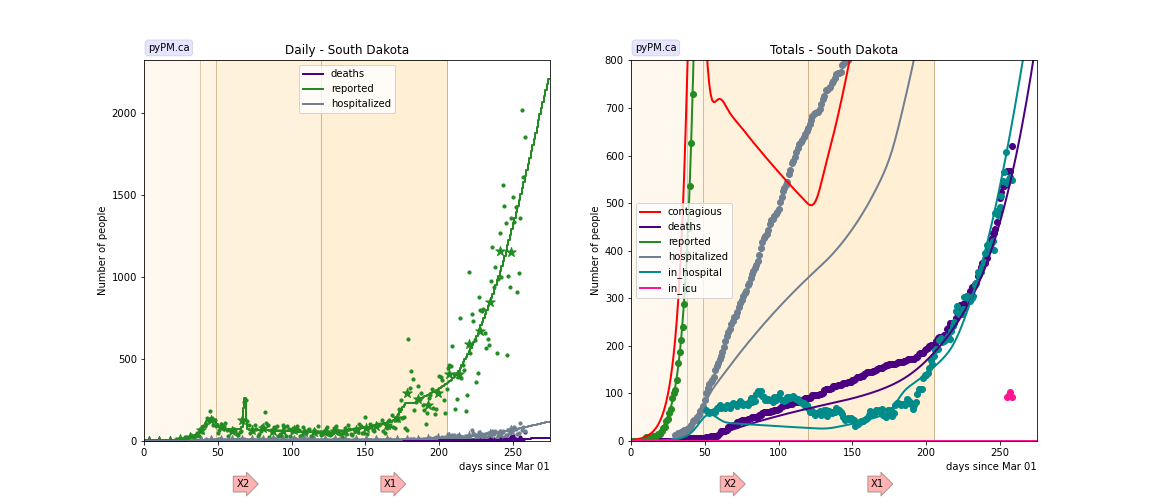
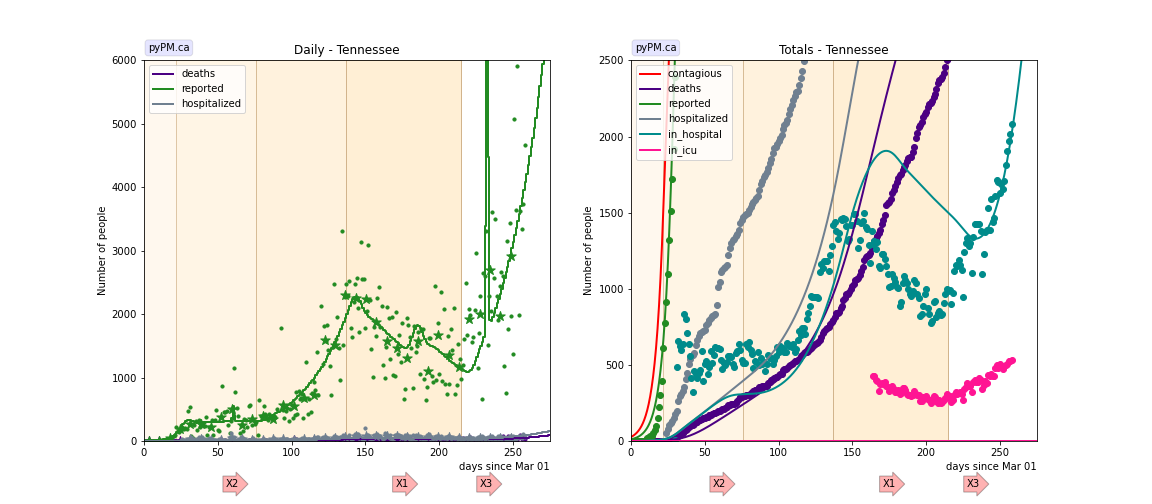
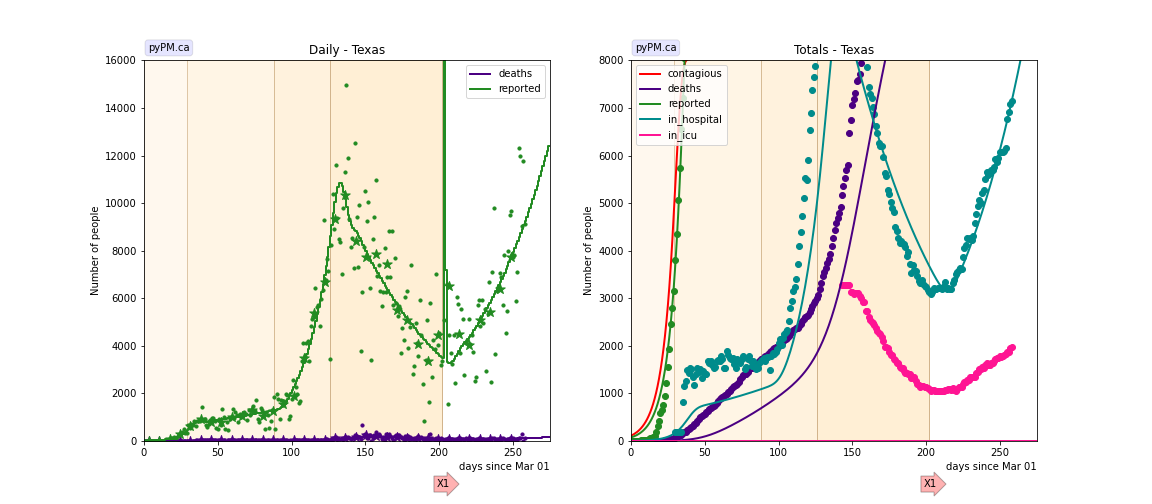
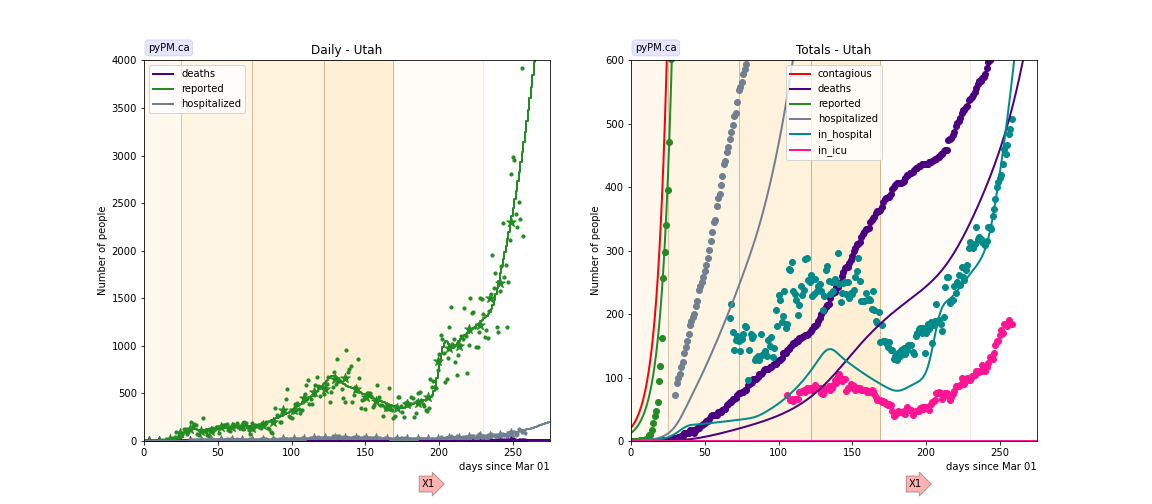
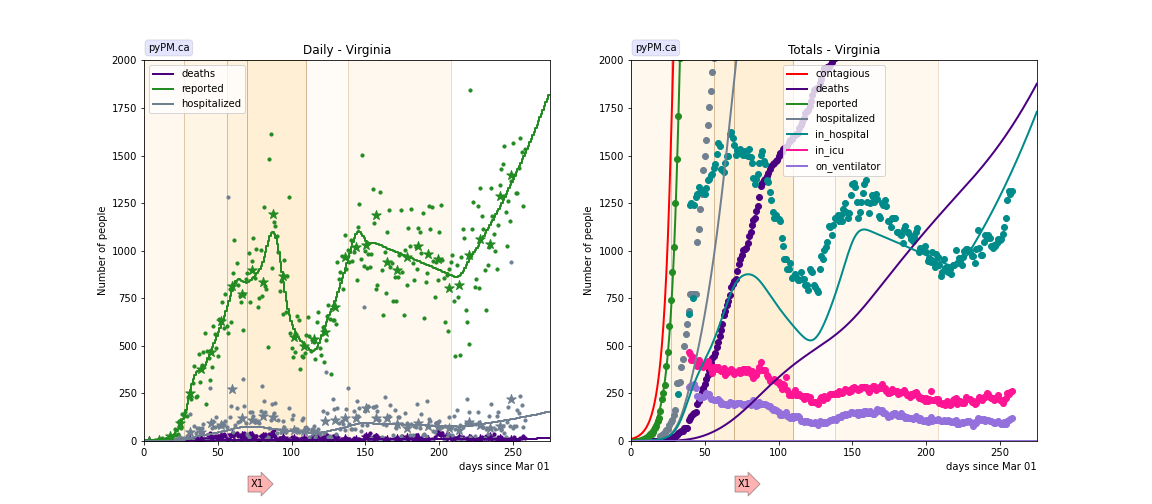
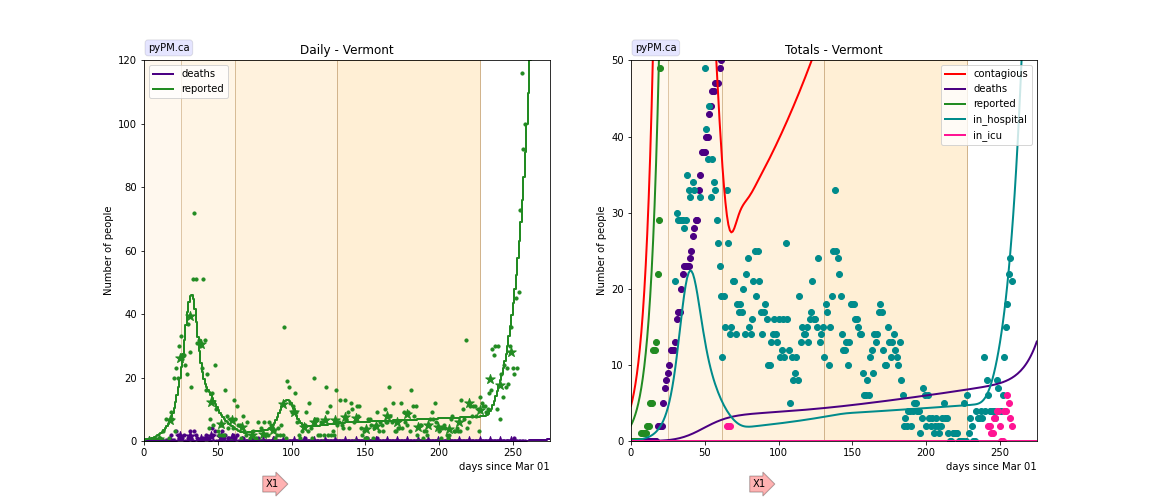
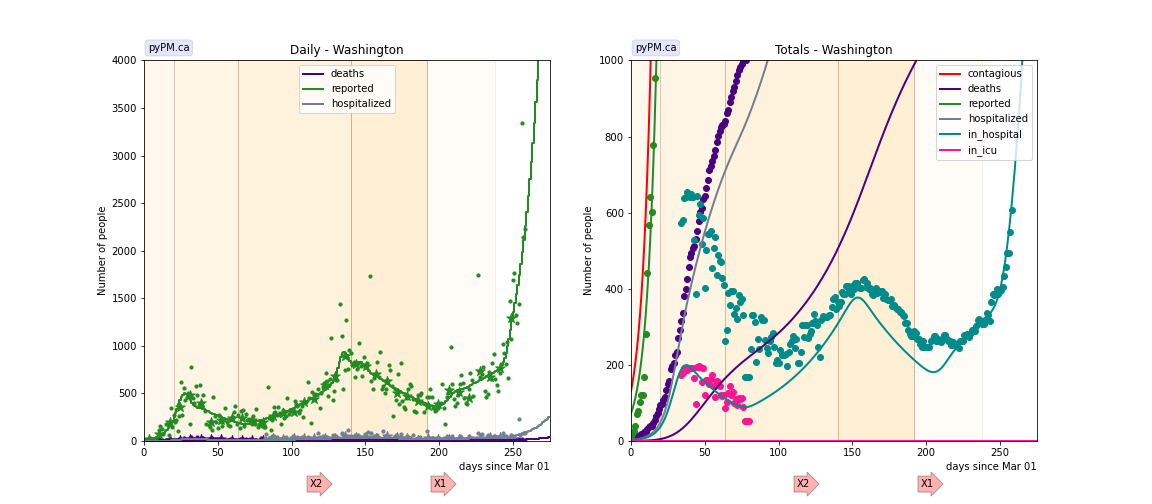
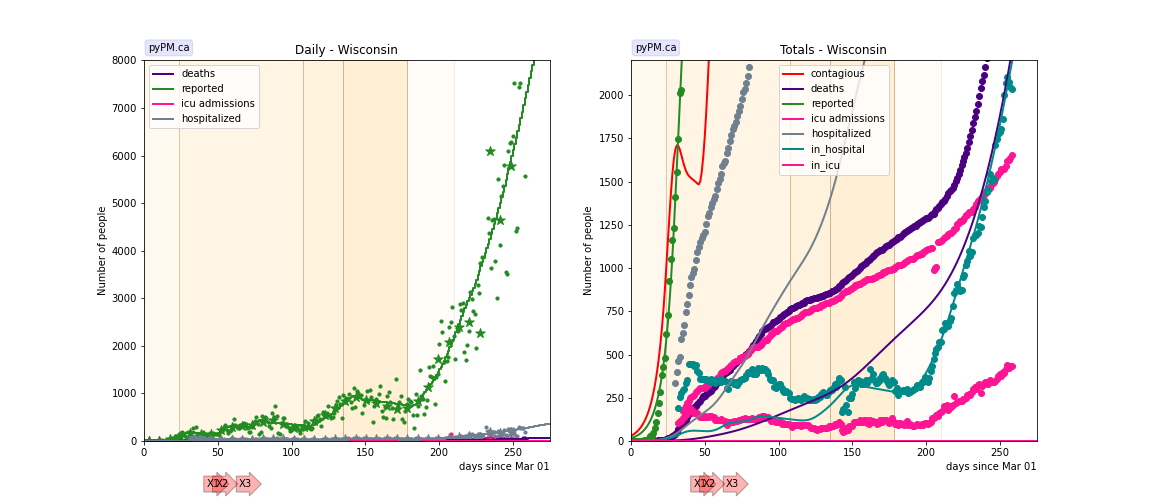
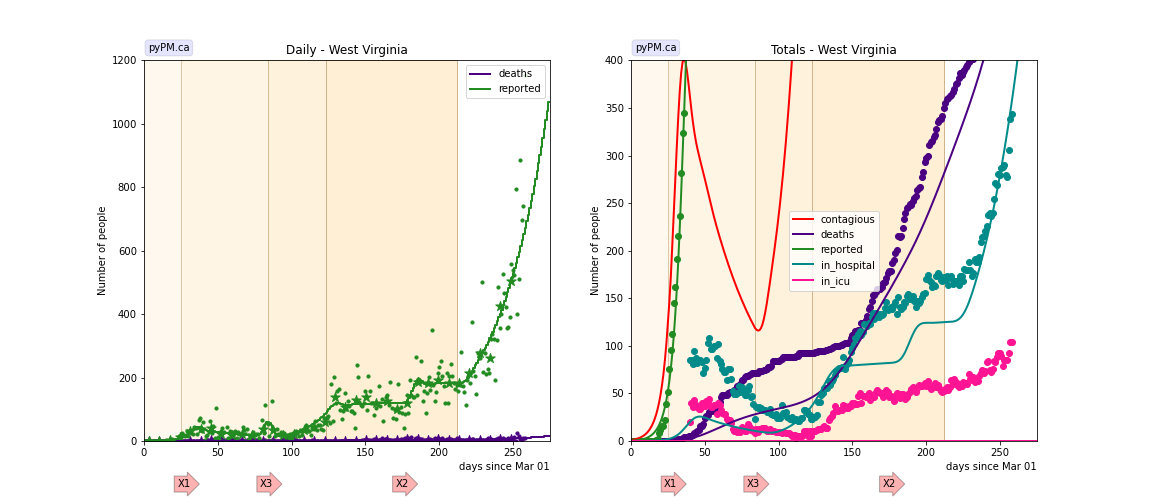
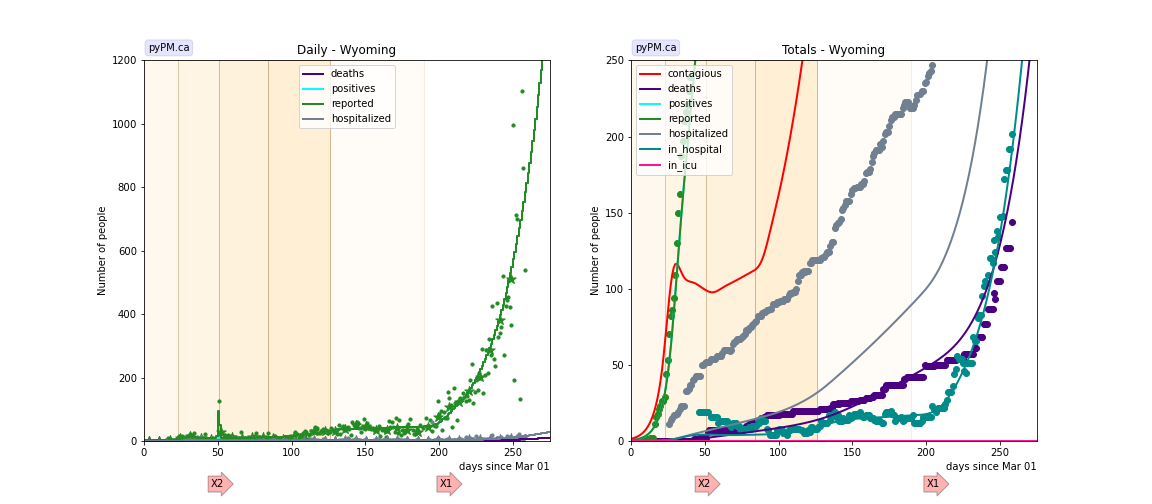
The plots below show the case / hospitalization / deaths data for all 50 states, DC, and PR. The infection trajectory is determined by fits to the cumulative case data. The data fits were done using data up until November 14.
The left figures show the daily cases on a linear scale. The green points are the case data, the stars show the weekly average, and the green curve is the fit of the model to the case data. The right figures show the cumulative cases and other indicators on a linear scale. Note that the recent rapid growth in the in-hospital numbers follows the trajectory determined from the case data, indicating that the case data is a useful predictor for the infection trajectory.
Alaska
Alabama
Arkansas
Arizona
California
Colorado
Connecticut
District Of Columbia
Delaware
Florida
Georgia
Hawaii
Iowa
Idaho
Illinois
Indiana
Kansas
Kentucky
Louisiana
Massachusetts
Maryland
Maine
Michigan
Minnesota
Missouri
Mississippi
Montana
North Carolina
North Dakota
Nebraska
New Hampshire
New Jersey
New Mexico
Nevada
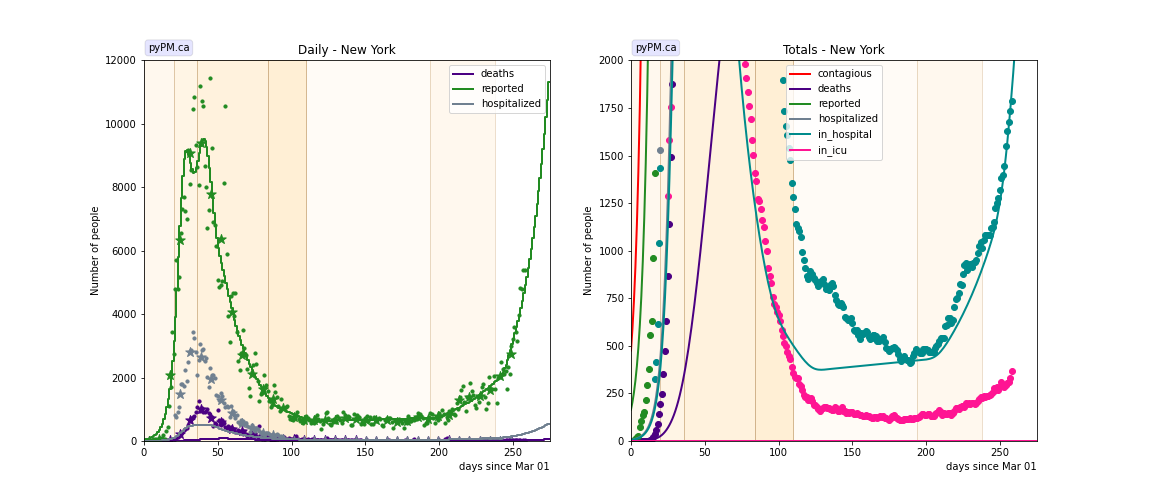
New York
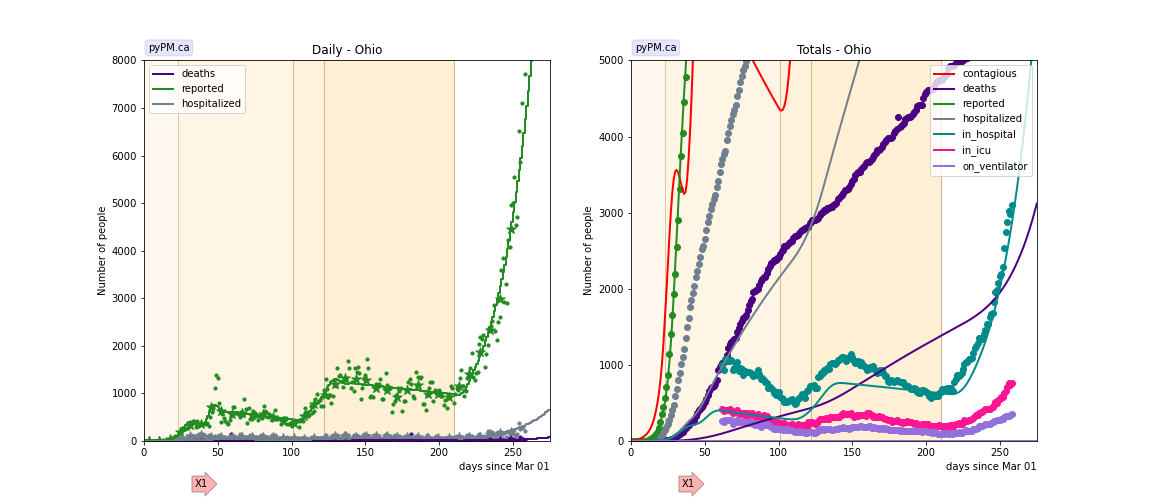
Ohio
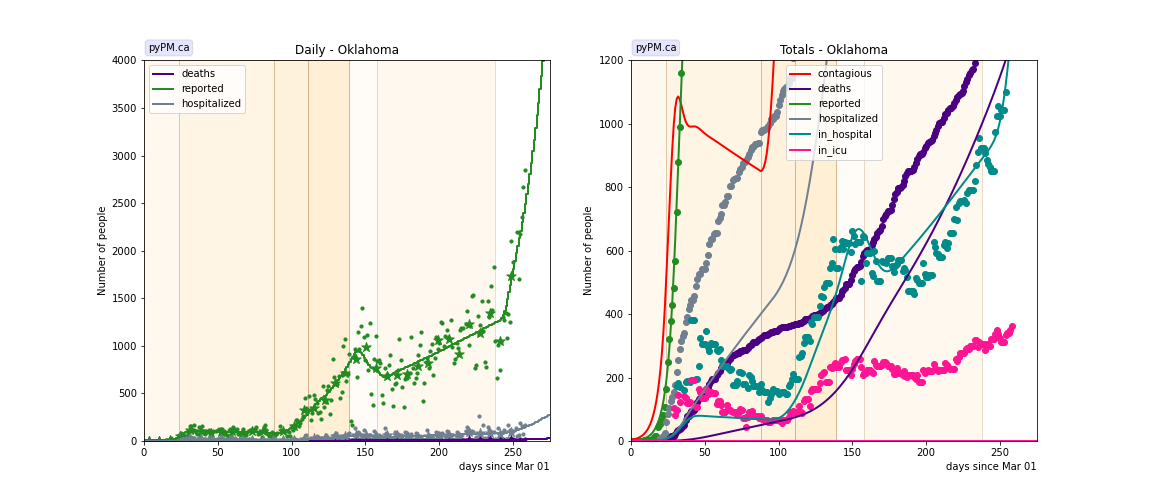
Oklahoma
Oregon
Pennsylvania
Puerto Rico
Rhode Island
South Carolina
South Dakota
Tennessee
Texas
Utah
Virginia
Vermont
Washington
Wisconsin
West Virginia
Wyoming
Tables
The tables below are results from the fits to reference model 2.3. These are shown for purposes of comparison.
Daily fractional growth rates (δ)
| state | δ0 | day 1 | δ1 | day 2 | δ2 | day 3 | δ3 | day 4 | δ4 | ||||
| AK | 11.4 +/- 2.3 | 27 | -4.4 +/- 3.2 | 84 | 4.1 +/- 0.6 | 142 | -0.9 +/- 0.8 | 189 | 3.9 +/- 0.5 | ||||
| AL | 11.3 +/- 0.9 | 32 | 1.6 +/- 0.3 | 84 | 3.1 +/- 0.1 | 136 | -0.9 +/- 0.1 | 195 | 2.0 +/- 0.2 | ||||
| AR | 6.1 +/- 1.2 | 50 | -12.9 +/- 4.5 | 60 | 7.8 +/- 0.6 | 85 | 1.8 +/- 0.1 | 145 | -2.5 +/- 0.5 | 161 | 1.3 +/- 0.1 | 230 | 2.8 +/- 0.3 |
| AZ | 10.0 +/- 0.6 | 26 | 2.5 +/- 0.2 | 84 | 6.9 +/- 0.2 | 113 | -0.9 +/- 0.1 | 141 | -4.1 +/- 0.2 | 191 | 4.4 +/- 0.2 | ||
| CA | 19.7 +/- 1.0 | 27 | 1.0 +/- 0.1 | 84 | 3.4 +/- 0.0 | 131 | -1.2 +/- 0.0 | 215 | 3.2 +/- 0.1 | ||||
| CO | 17.2 +/- 1.3 | 24 | 0.5 +/- 0.3 | 44 | -2.6 +/- 0.4 | 74 | -0.7 +/- 0.2 | 114 | 5.1 +/- 0.4 | 135 | -1.3 +/- 0.3 | 208 | 5.5 +/- 0.1 |
| CT | 25.6 +/- 1.9 | 24 | 5.6 +/- 0.5 | 38 | -2.2 +/- 0.2 | 83 | -4.6 +/- 0.5 | 111 | 1.1 +/- 0.3 | 201 | 5.0 +/- 0.2 | ||
| DC | 18.1 +/- 0.8 | 27 | 1.8 +/- 0.8 | 50 | -1.8 +/- 0.5 | 80 | -3.3 +/- 0.5 | 113 | 3.3 +/- 1.1 | 140 | -0.3 +/- 0.3 | 216 | 3.8 +/- 1.0 |
| FL | 21.2 +/- 1.6 | 25 | -1.3 +/- 0.2 | 63 | 0.9 +/- 0.3 | 84 | 7.1 +/- 0.1 | 126 | -2.0 +/- 0.0 | 185 | -0.3 +/- 0.2 | 210 | 3.0 +/- 0.4 |
| GA | 20.2 +/- 1.7 | 27 | -0.4 +/- 0.1 | 89 | 5.0 +/- 0.2 | 131 | -1.0 +/- 0.1 | 216 | 2.7 +/- 0.3 | ||||
| HI | 15.3 +/- 3.2 | 26 | -9.6 +/- 2.4 | 85 | -0.5 +/- 2.2 | 115 | 8.0 +/- 0.4 | 158 | -3.7 +/- 0.4 | 195 | -0.2 +/- 0.7 | ||
| IA | 23.8 +/- 0.9 | 22 | 7.0 +/- 0.4 | 55 | -1.5 +/- 0.2 | 92 | 2.0 +/- 0.2 | 126 | 0.4 +/- 0.2 | 152 | 1.4 +/- 0.2 | 225 | 7.1 +/- 0.2 |
| ID | 25.7 +/- 1.0 | 24 | -5.5 +/- 0.5 | 49 | 1.1 +/- 0.4 | 96 | 9.5 +/- 0.7 | 125 | -0.7 +/- 0.1 | 191 | 3.3 +/- 0.2 | ||
| IL | 17.5 +/- 1.1 | 26 | 3.0 +/- 0.1 | 60 | -0.8 +/- 0.2 | 76 | -4.7 +/- 0.2 | 100 | 2.1 +/- 0.1 | 170 | -0.1 +/- 0.2 | 209 | 5.3 +/- 0.3 |
| IN | 23.9 +/- 2.1 | 25 | 1.0 +/- 0.2 | 55 | -1.3 +/- 0.2 | 108 | 4.1 +/- 0.3 | 134 | 0.5 +/- 0.2 | 207 | 4.4 +/- 0.3 | ||
| KS | 17.2 +/- 1.3 | 25 | 2.9 +/- 1.0 | 41 | -0.4 +/- 0.6 | 81 | 4.6 +/- 0.4 | 115 | 1.1 +/- 0.1 | 225 | 5.3 +/- 0.8 | ||
| KY | 23.5 +/- 2.1 | 22 | 5.7 +/- 1.6 | 40 | 0.3 +/- 0.2 | 109 | 4.4 +/- 0.3 | 140 | -0.9 +/- 0.2 | 190 | 2.6 +/- 0.3 | ||
| LA | 26.0 +/- 1.5 | 26 | -4.3 +/- 0.3 | 50 | 1.1 +/- 0.2 | 88 | 6.2 +/- 0.2 | 135 | -1.5 +/- 0.1 | 170 | 0.5 +/- 0.3 | 201 | 3.0 +/- 0.4 |
| MA | 16.3 +/- 1.4 | 28 | 3.1 +/- 0.4 | 46 | -3.5 +/- 0.2 | 84 | -7.2 +/- 0.9 | 100 | 1.4 +/- 0.1 | 220 | 5.4 +/- 0.2 | ||
| MD | 13.4 +/- 0.6 | 34 | 1.4 +/- 0.1 | 74 | -2.6 +/- 0.3 | 116 | 4.8 +/- 0.5 | 140 | -1.3 +/- 0.2 | 206 | 2.3 +/- 0.2 | 238 | 5.9 +/- 0.7 |
| ME | 22.1 +/- 7.3 | 16 | 1.1 +/- 0.5 | 84 | -1.3 +/- 0.3 | 143 | 1.0 +/- 0.4 | 230 | 8.7 +/- 0.9 | ||||
| MI | 24.1 +/- 0.3 | 24 | -1.5 +/- 0.1 | 60 | -2.6 +/- 0.2 | 102 | 4.2 +/- 0.4 | 128 | 0.6 +/- 0.1 | 210 | 5.4 +/- 0.2 | ||
| MN | 5.0 +/- 2.8 | 47 | 1.5 +/- 0.4 | 76 | -3.2 +/- 0.2 | 103 | 3.7 +/- 0.7 | 123 | 0.7 +/- 0.1 | 210 | 5.0 +/- 0.1 | ||
| MO | 21.2 +/- 3.1 | 25 | -0.3 +/- 0.2 | 94 | 4.1 +/- 0.2 | 142 | 0.7 +/- 0.1 | 223 | 4.4 +/- 0.2 | ||||
| MS | 17.6 +/- 1.2 | 34 | -0.1 +/- 0.3 | 80 | 3.1 +/- 0.3 | 140 | -1.3 +/- 0.3 | 193 | 2.0 +/- 0.3 | ||||
| MT | 21.5 +/- 2.4 | 23 | -8.6 +/- 5.5 | 37 | -7.0 +/- 1.9 | 91 | 9.2 +/- 1.4 | 127 | 0.6 +/- 0.4 | 190 | 2.5 +/- 0.2 | ||
| NC | 17.6 +/- 1.1 | 24 | 2.3 +/- 0.1 | 126 | -0.3 +/- 0.1 | 224 | 1.5 +/- 0.3 | ||||||
| ND | 21.8 +/- 14.9 | 22 | -3.5 +/- 0.7 | 84 | 0.3 +/- 0.7 | 150 | 2.7 +/- 0.1 | 220 | 4.4 +/- 0.1 | ||||
| NE | 18.1 +/- 3.2 | 25 | 9.6 +/- 0.5 | 53 | -1.8 +/- 0.2 | 106 | 1.5 +/- 0.2 | 215 | 4.9 +/- 0.5 | ||||
| NH | 12.9 +/- 2.0 | 28 | 1.4 +/- 0.6 | 70 | -2.5 +/- 0.2 | 172 | 3.0 +/- 0.5 | 238 | 7.0 +/- 2.1 | ||||
| NJ | 22.3 +/- 0.6 | 25 | -0.2 +/- 0.2 | 49 | -3.7 +/- 0.1 | 108 | 1.1 +/- 0.2 | 212 | 5.2 +/- 0.3 | ||||
| NM | 15.0 +/- 1.9 | 30 | 2.7 +/- 0.6 | 59 | -0.5 +/- 0.4 | 103 | 3.9 +/- 0.6 | 131 | -2.2 +/- 0.2 | 183 | 4.6 +/- 0.3 | ||
| NV | 26.0 +/- 4.8 | 21 | -0.4 +/- 0.4 | 81 | 5.0 +/- 0.3 | 133 | -1.7 +/- 0.1 | 198 | 3.5 +/- 0.8 | ||||
| NY | 24.3 +/- 0.9 | 20 | 1.6 +/- 0.2 | 36 | -3.8 +/- 0.1 | 84 | -1.8 +/- 0.2 | 110 | 0.6 +/- 0.1 | 194 | 2.9 +/- 0.1 | 238 | 6.0 +/- 0.4 |
| OH | 26.1 +/- 1.9 | 23 | -0.6 +/- 0.2 | 101 | 5.2 +/- 0.5 | 122 | -0.0 +/- 0.1 | 210 | 4.8 +/- 0.3 | ||||
| OK | 23.2 +/- 3.0 | 24 | -0.2 +/- 0.1 | 88 | 6.5 +/- 0.7 | 111 | 3.5 +/- 0.2 | 139 | -1.5 +/- 0.4 | 158 | 1.2 +/- 0.1 | 238 | 4.9 +/- 0.5 |
| OR | 12.0 +/- 2.5 | 25 | -0.2 +/- 0.4 | 81 | 4.1 +/- 0.5 | 128 | -0.7 +/- 0.1 | 190 | 1.9 +/- 0.3 | 237 | 6.2 +/- 0.8 | ||
| PA | 36.6 +/- 1.3 | 22 | 11.9 +/- 0.5 | 32 | -1.6 +/- 0.1 | 97 | 1.1 +/- 0.2 | 133 | 0.7 +/- 0.1 | 219 | 5.2 +/- 0.2 | ||
| PR | 19.5 +/- 4.6 | 23 | -0.2 +/- 1.2 | 100 | 6.1 +/- 1.5 | 154 | -2.6 +/- 0.3 | 215 | 2.3 +/- 0.2 | ||||
| RI | 15.4 +/- 0.9 | 34 | 3.7 +/- 3.5 | 48 | -2.7 +/- 0.3 | 84 | -4.2 +/- 1.3 | 100 | 0.9 +/- 0.3 | 202 | 4.6 +/- 0.3 | ||
| SC | 27.0 +/- 1.8 | 22 | -0.7 +/- 0.5 | 66 | 5.0 +/- 0.2 | 124 | -1.5 +/- 0.1 | 170 | 0.8 +/- 0.1 | ||||
| SD | 17.1 +/- 3.8 | 38 | -5.2 +/- 4.7 | 49 | -0.4 +/- 0.3 | 120 | 2.2 +/- 0.2 | 205 | 3.9 +/- 0.2 | ||||
| TN | 20.3 +/- 3.7 | 22 | 0.3 +/- 0.3 | 76 | 3.4 +/- 0.1 | 137 | -0.8 +/- 0.2 | 215 | 4.1 +/- 0.2 | ||||
| TX | 13.9 +/- 2.1 | 29 | 1.1 +/- 0.1 | 88 | 5.7 +/- 0.1 | 126 | -1.1 +/- 0.0 | 202 | 2.6 +/- 0.3 | ||||
| UT | 14.9 +/- 1.7 | 25 | 1.0 +/- 0.2 | 73 | 3.1 +/- 0.2 | 122 | -1.1 +/- 0.2 | 169 | 1.7 +/- 0.2 | 230 | 4.5 +/- 0.4 | ||
| VA | 20.4 +/- 1.8 | 27 | 3.8 +/- 0.2 | 56 | 0.4 +/- 0.6 | 70 | -1.2 +/- 0.1 | 110 | 3.2 +/- 0.1 | 138 | 0.0 +/- 0.1 | 208 | 1.6 +/- 0.5 |
| VT | 17.4 +/- 2.8 | 25 | -7.0 +/- 2.6 | 62 | 1.1 +/- 3.3 | 131 | 0.4 +/- 2.0 | 228 | 9.7 +/- 4.1 | ||||
| WA | 16.4 +/- 0.8 | 20 | -2.1 +/- 0.3 | 64 | 2.2 +/- 0.2 | 140 | -1.3 +/- 0.3 | 192 | 1.6 +/- 0.2 | 238 | 7.1 +/- 0.7 | ||
| WI | 15.9 +/- 1.2 | 24 | -0.6 +/- 0.2 | 108 | 4.1 +/- 0.6 | 135 | -0.2 +/- 0.3 | 178 | 4.3 +/- 0.4 | 210 | 3.1 +/- 0.1 | ||
| WV | 20.6 +/- 2.2 | 25 | -2.2 +/- 0.9 | 84 | 6.0 +/- 3.3 | 123 | 0.3 +/- 0.2 | 212 | 3.4 +/- 0.6 | ||||
| WY | 18.1 +/- 3.5 | 23 | -0.4 +/- 1.2 | 51 | 0.6 +/- 1.1 | 84 | 2.8 +/- 0.8 | 126 | 0.6 +/- 0.5 | 190 | 4.7 +/- 0.4 |
- δ0: initial daily fractional growth parameter (in percent)
- day 1: days after March 1, 2020 when transmission rate changed
- transition day 84 (May 23) was forced in some cases: used to estimate growth following Memorial day weekend
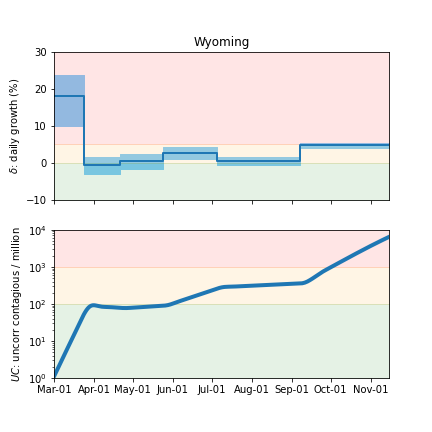
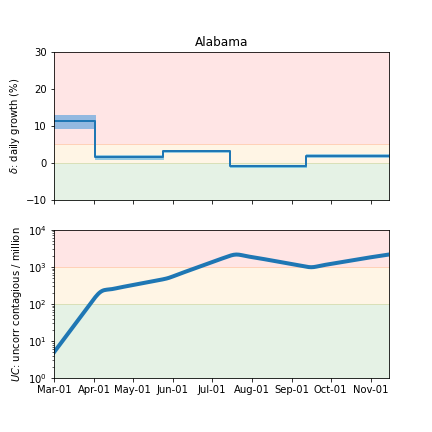
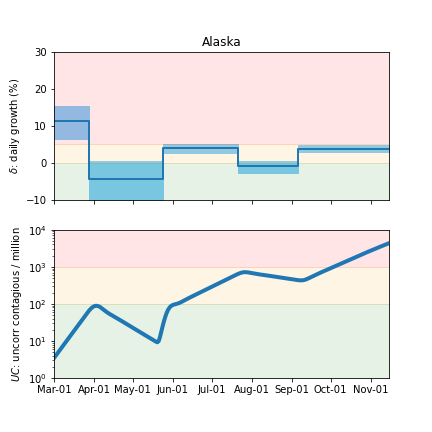
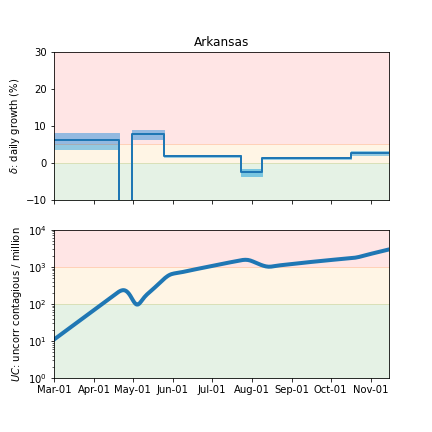
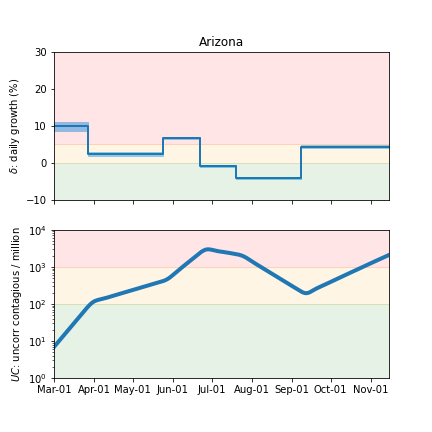
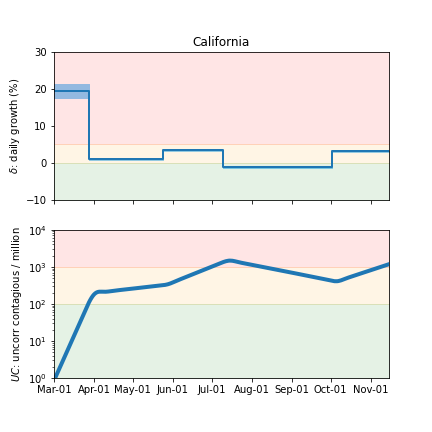
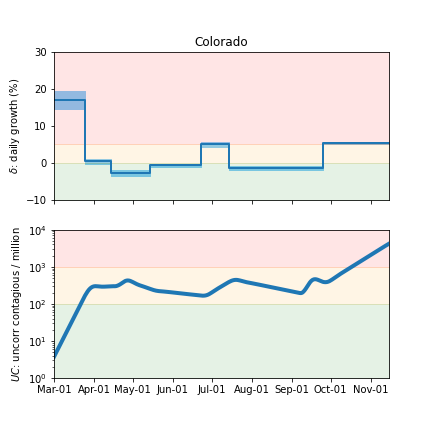
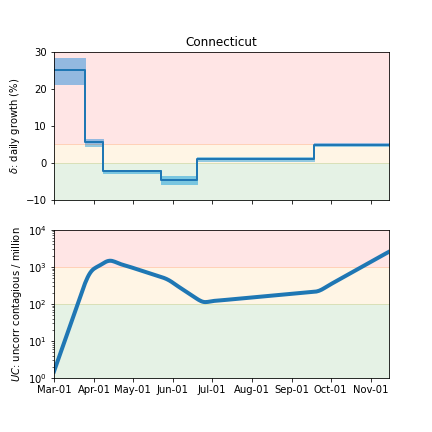
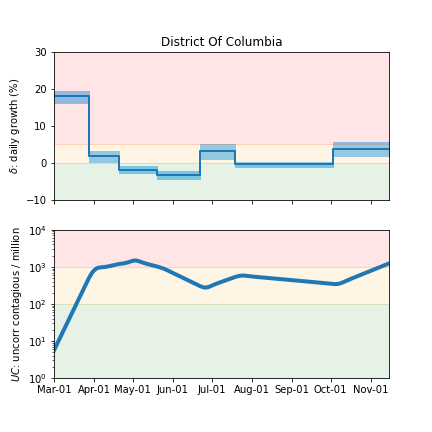
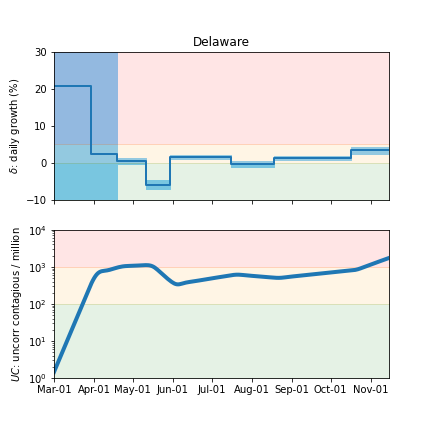
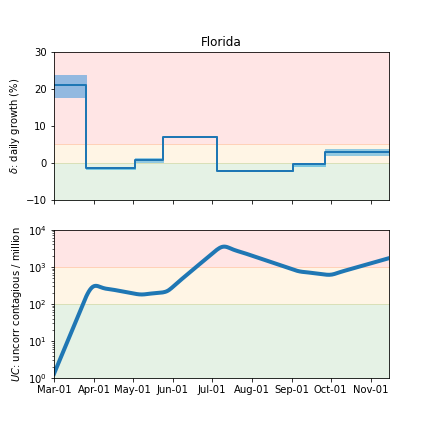
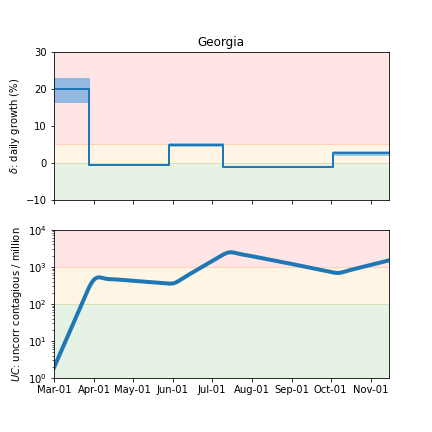
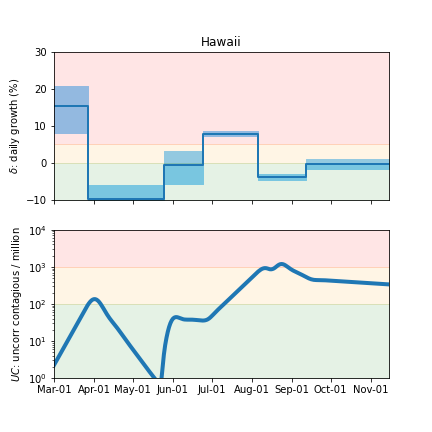
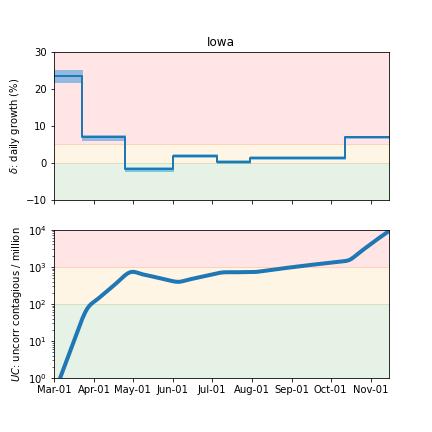
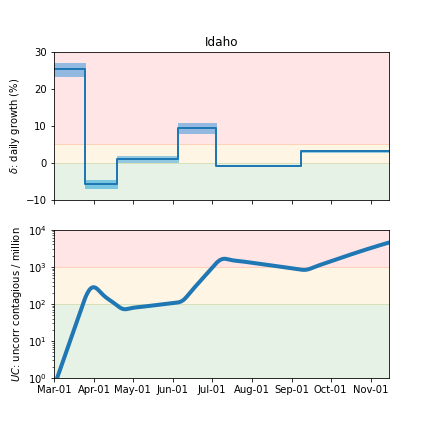
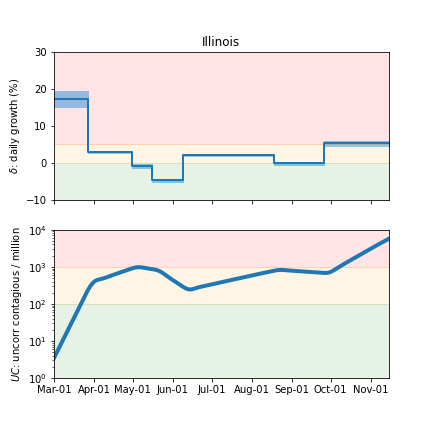
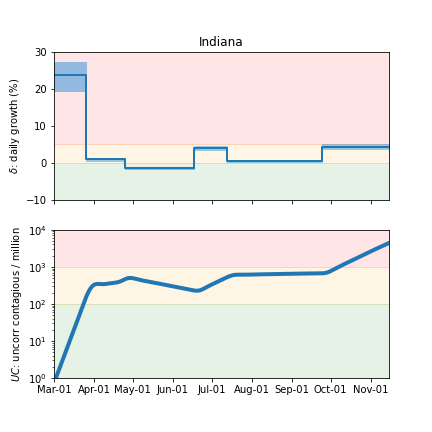
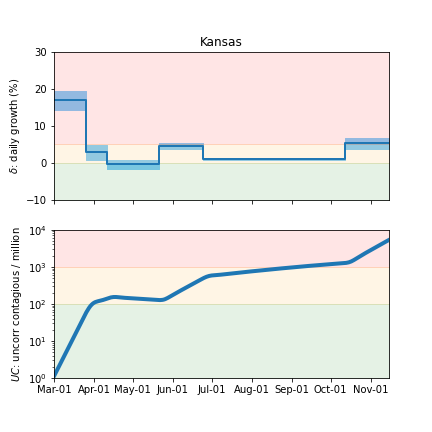
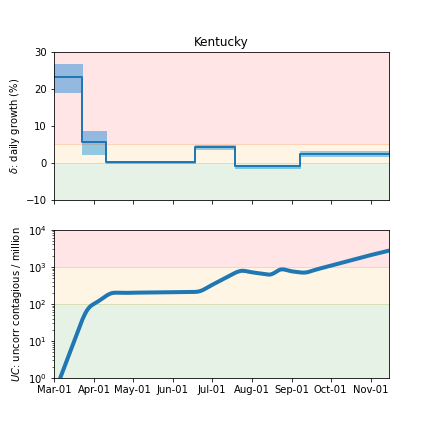
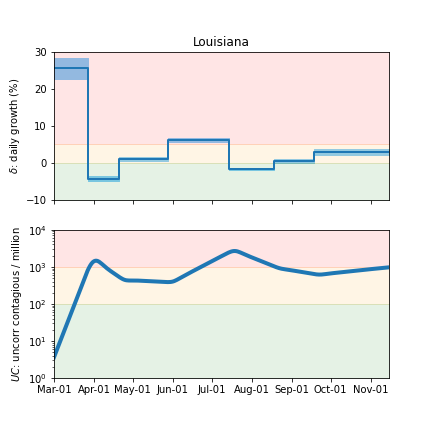
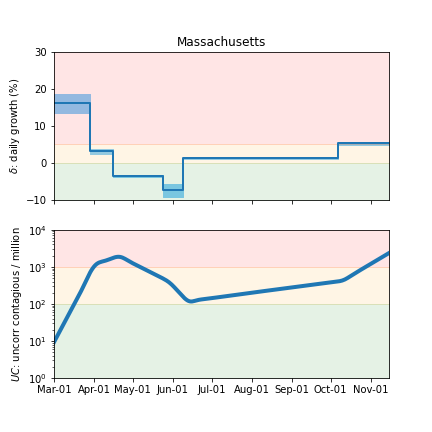
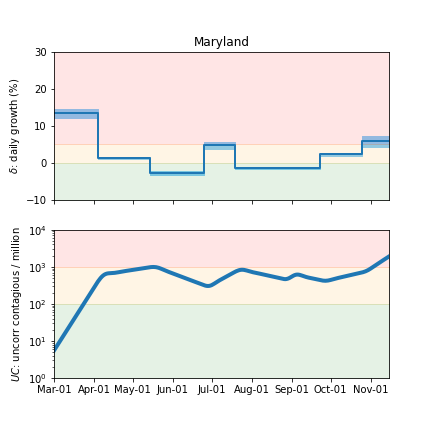
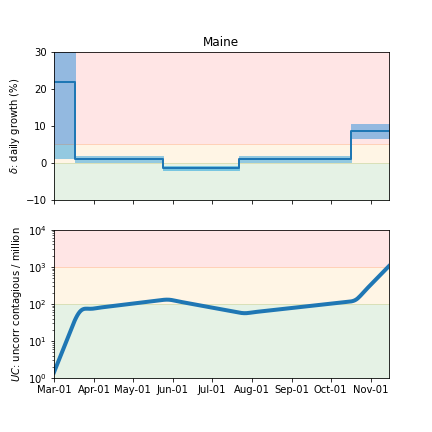
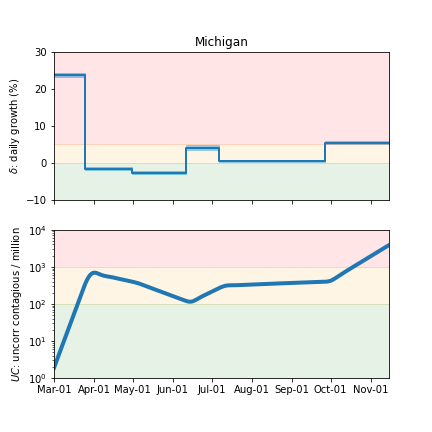
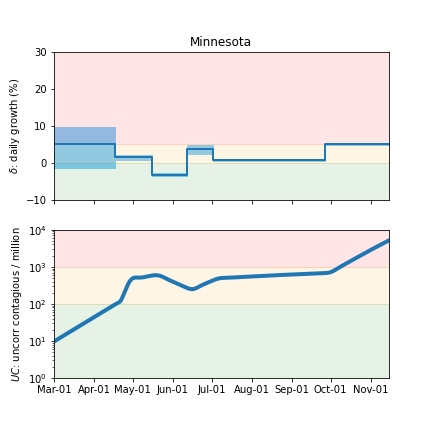
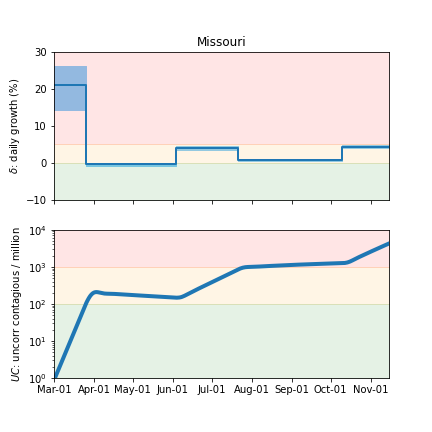
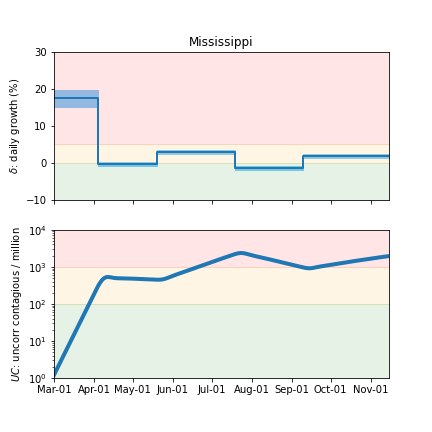
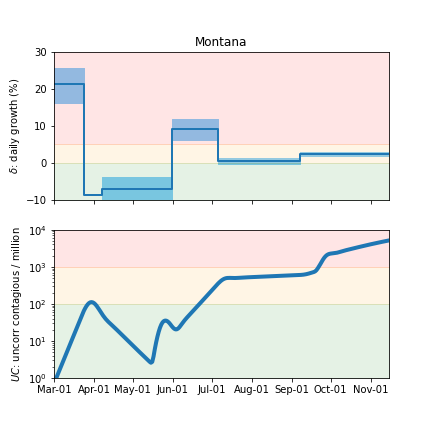
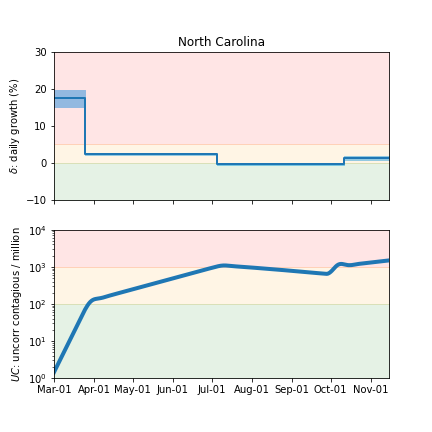
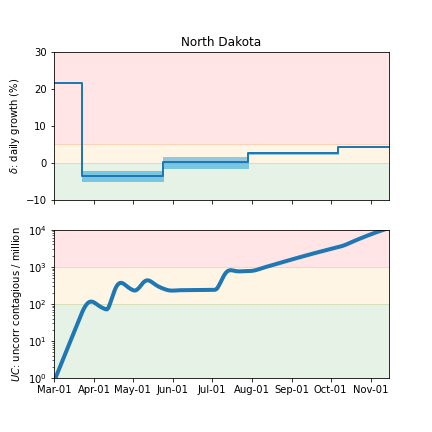
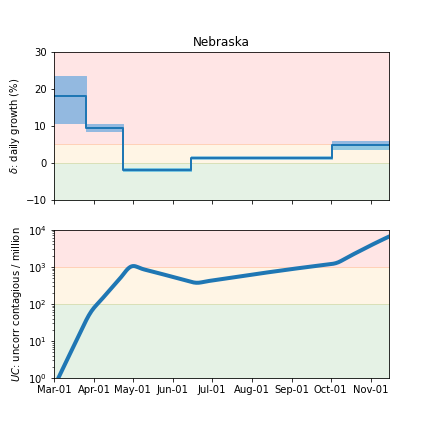
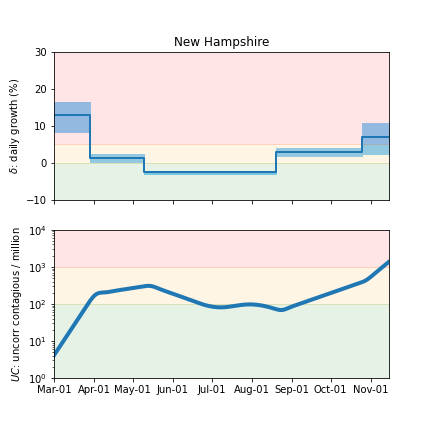
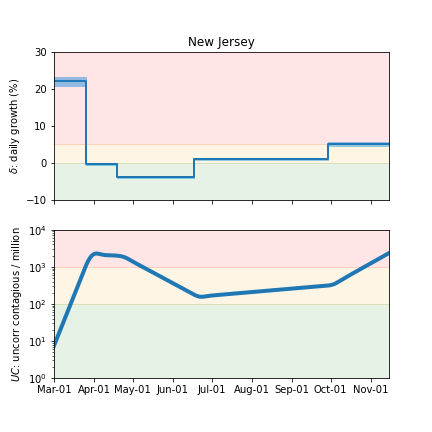
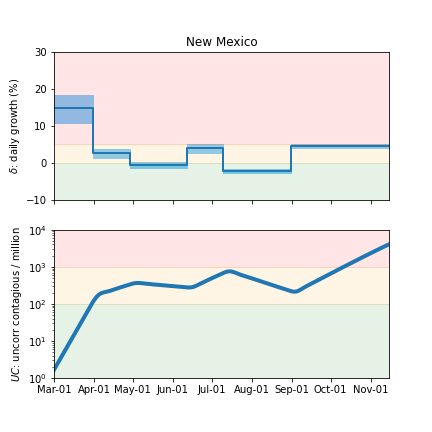
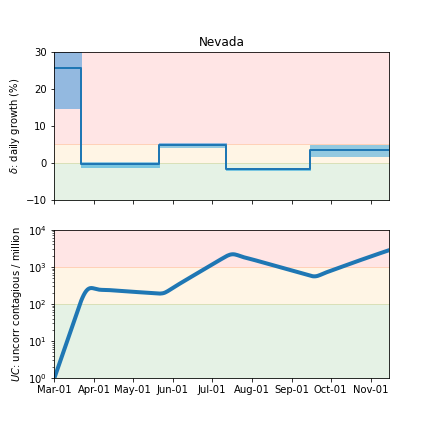
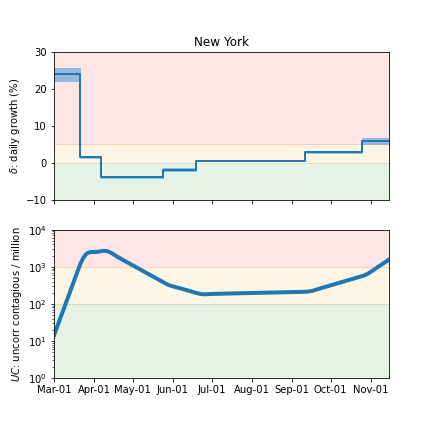
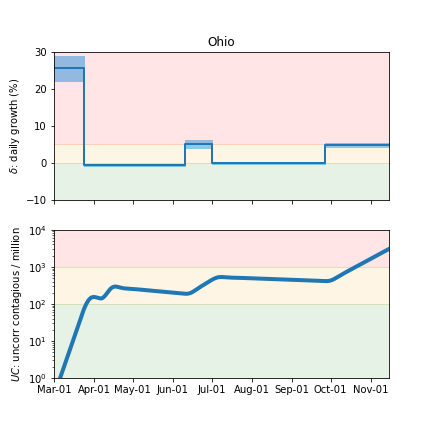
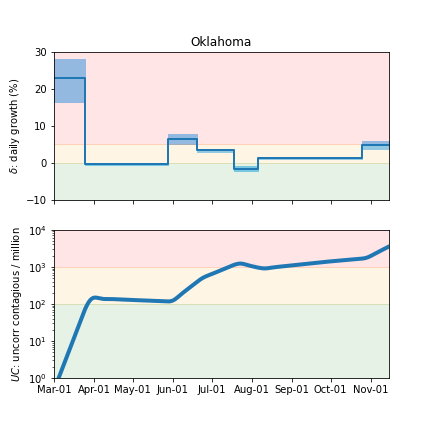
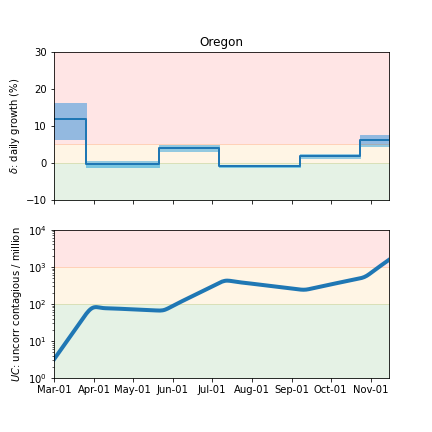
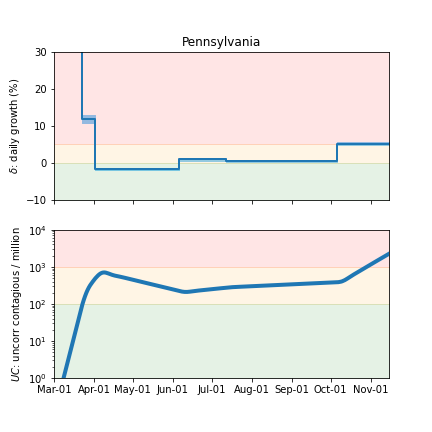
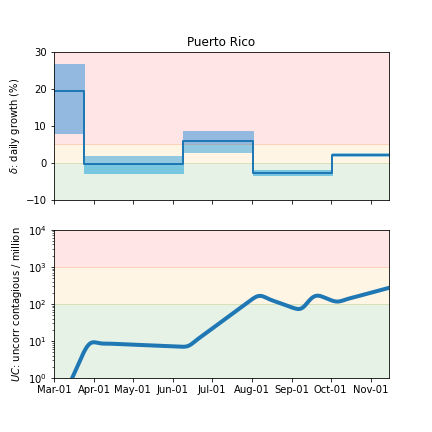
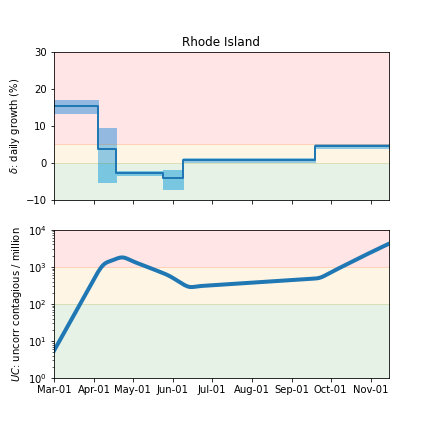
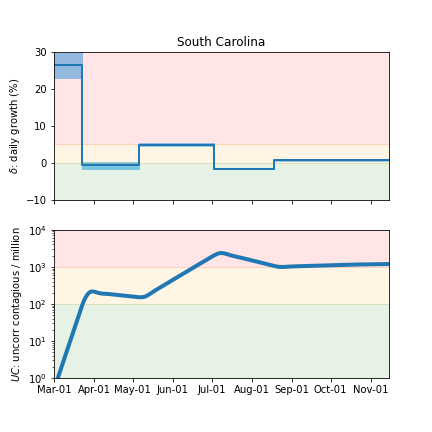
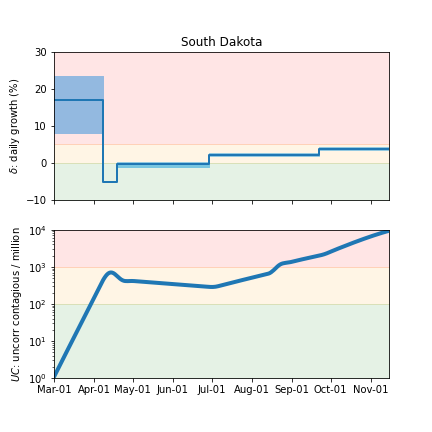
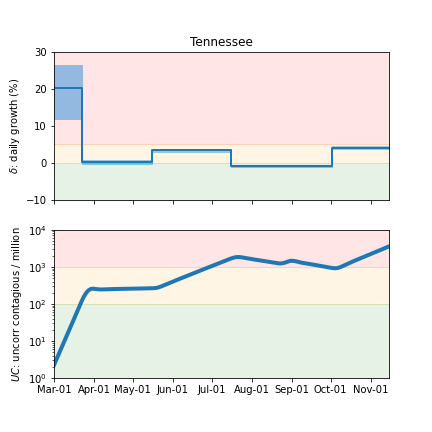
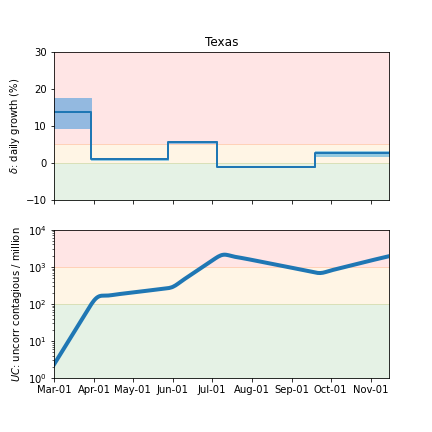
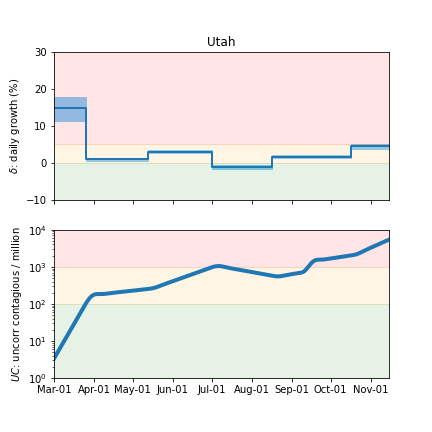
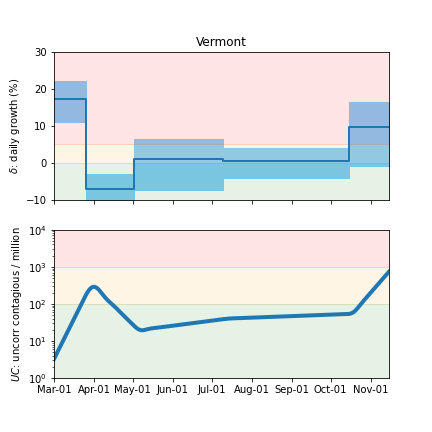
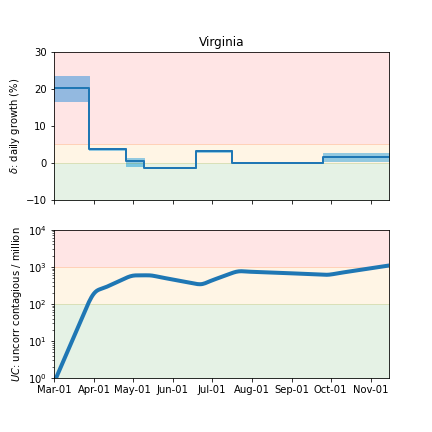
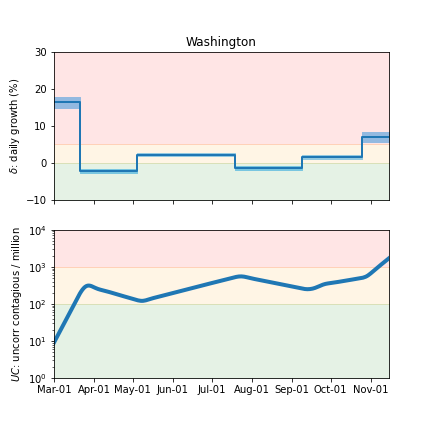
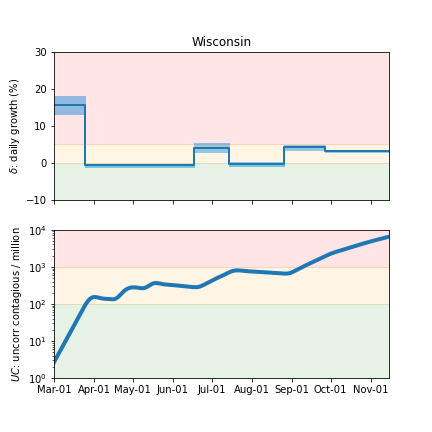
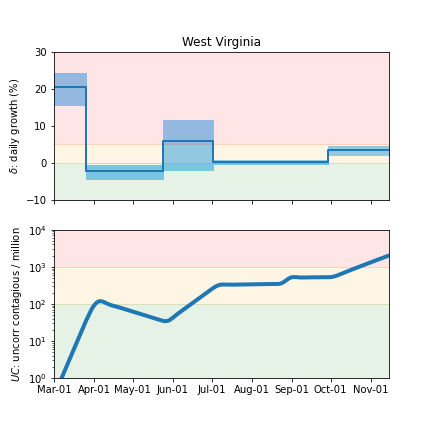
Infection status
The following plots summarize the infection history. The upper plot shows the daily growth/decline from the fit. Bands show approximate 95% CL intervals. The lower plot shows the size of the infection: the uncorrected circulating contagious population per million.
Alabama
Alaska
Arkansas
Arizona
California
Colorado
Connecticut
District Of Columbia
Delaware
Florida
Georgia
Hawaii
Iowa
Idaho
Illinois
Indiana
Kansas
Kentucky
Louisiana
Massachusetts
Maryland
Maine
Michigan
Minnesota
Missouri
Mississippi
Montana
North Carolina
North Dakota
Nebraska
New Hampshire
New Jersey
New Mexico
Nevada
New York
Ohio
Oklahoma
Oregon
Pennsylvania
Puerto Rico
Rhode Island
South Carolina
South Dakota
Tennessee
Texas
Utah
Vermont
Virginia
Washington
Wisconsin
West Virginia
Wyoming