July 8, 2020 Analysis of USA state data
Summary
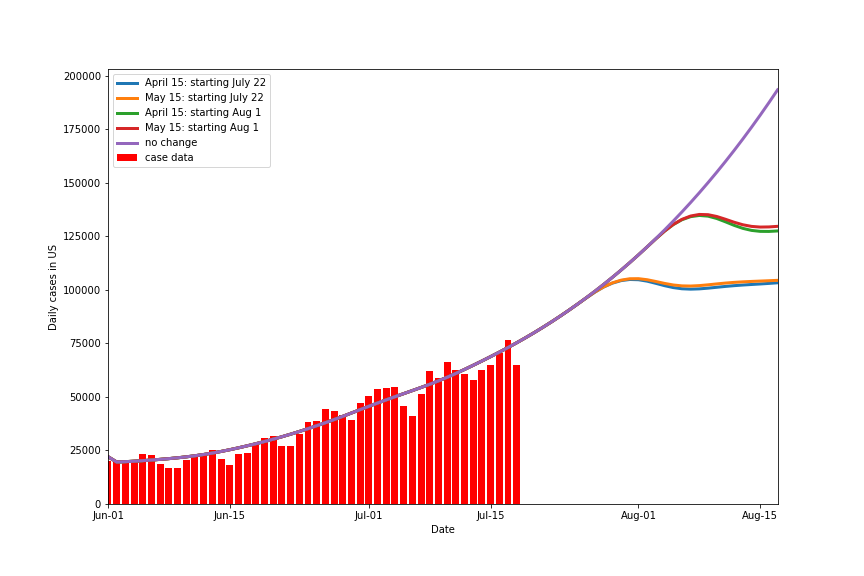
The histogram shows the daily cases for the 50 states and DC. The curve labelled “no change” shows the expected daily cases by adding the expectations from all of the individual state models fit to the state data, as shown below. Also shown are projections, if measures are taken to reduce transmission rates, back to April 15 or May 15 levels, with the public policy change being made on July 22 or August 1. Model fits use data March 1 - July 19.
Individual state fits
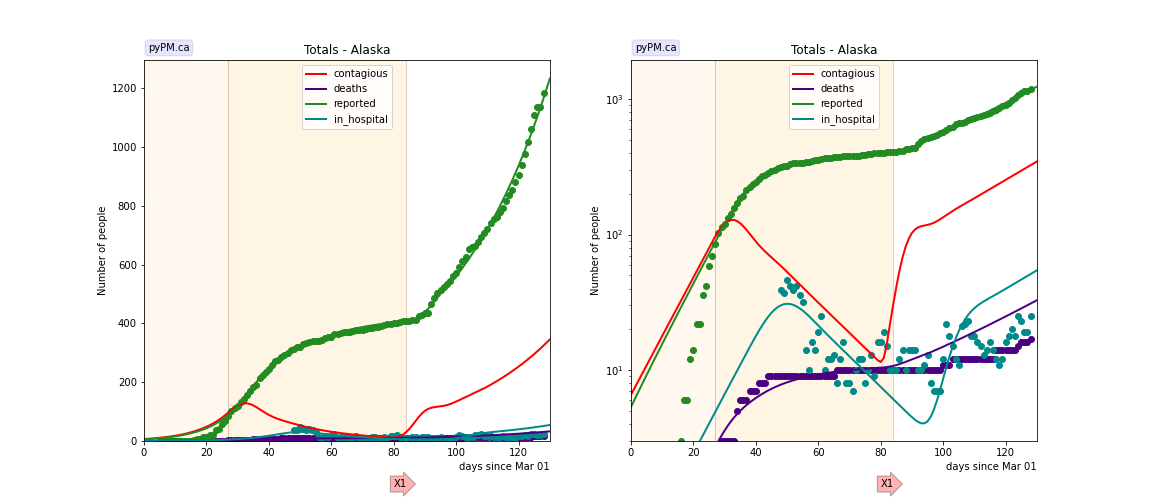
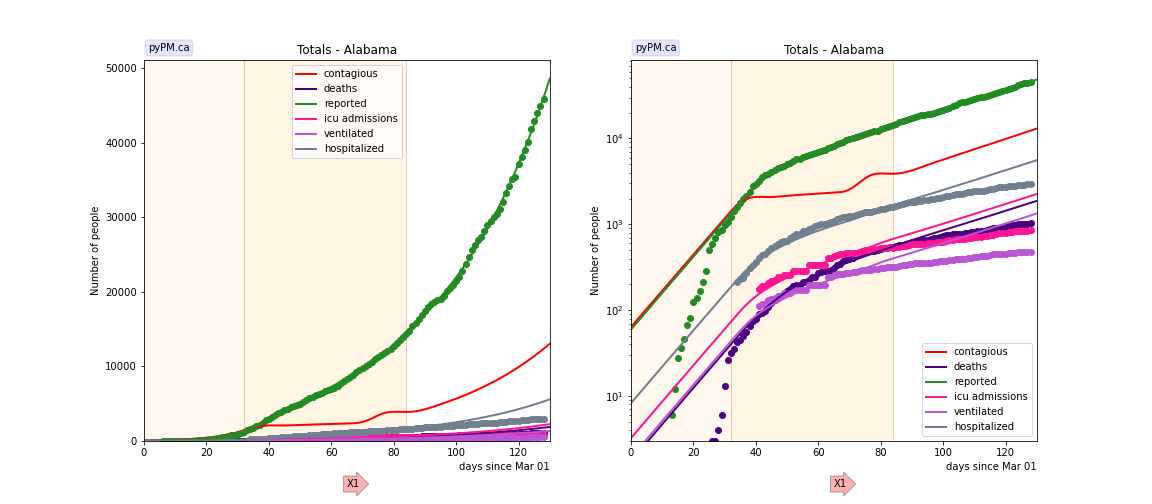
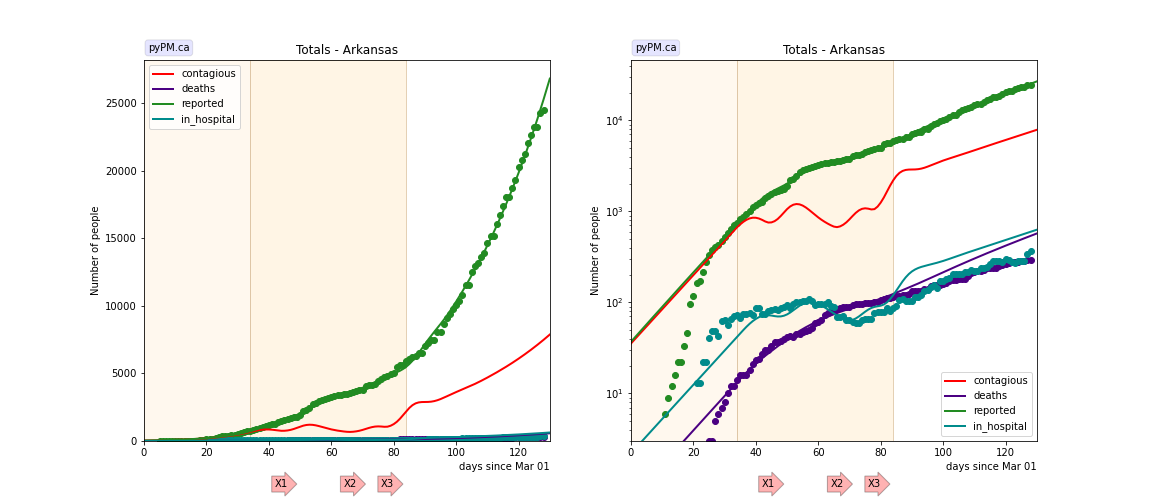
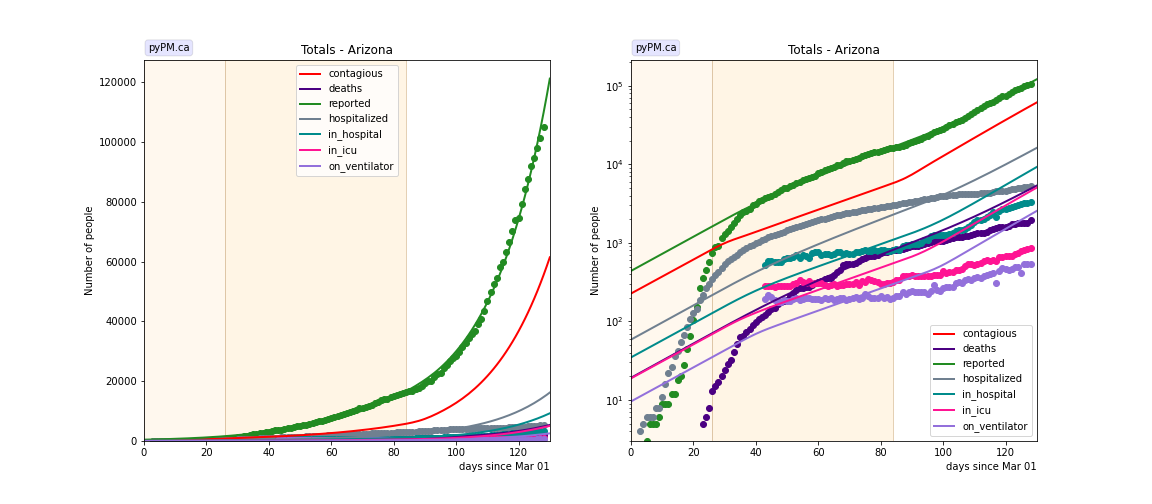
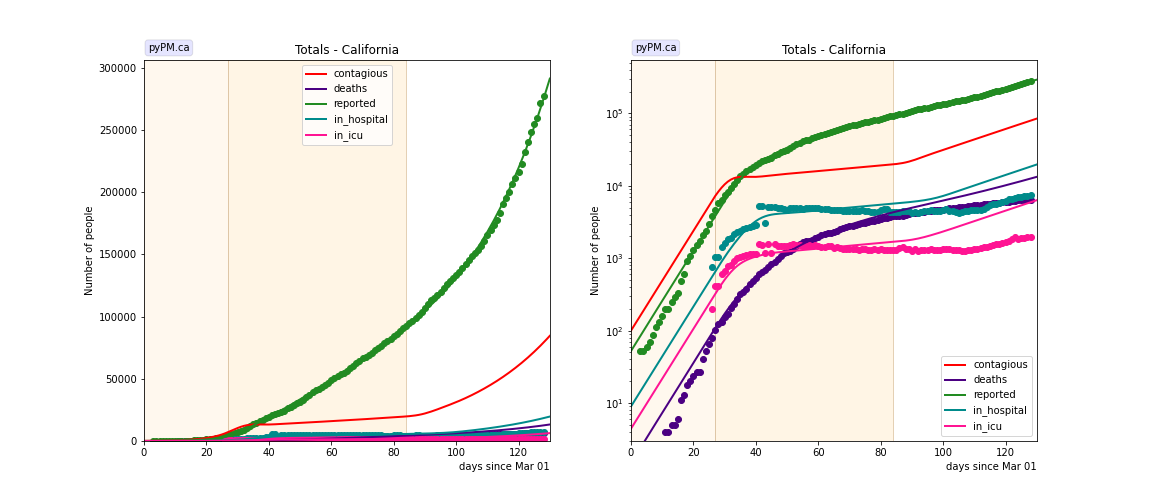
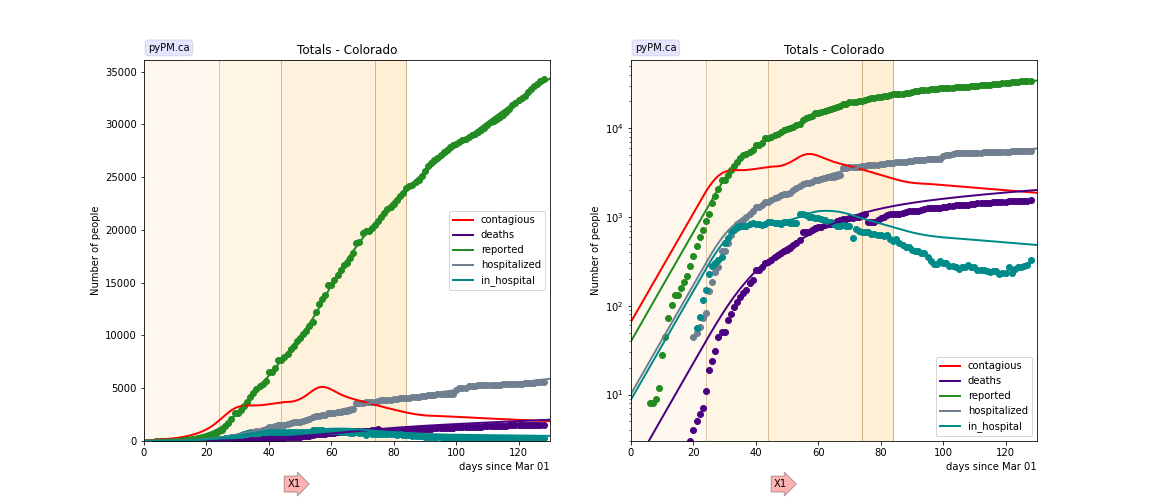
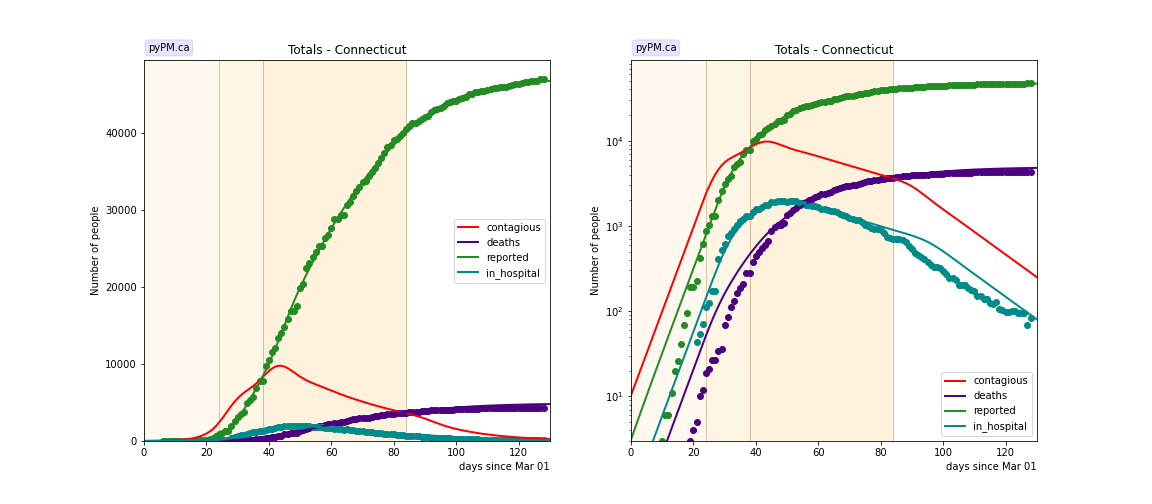
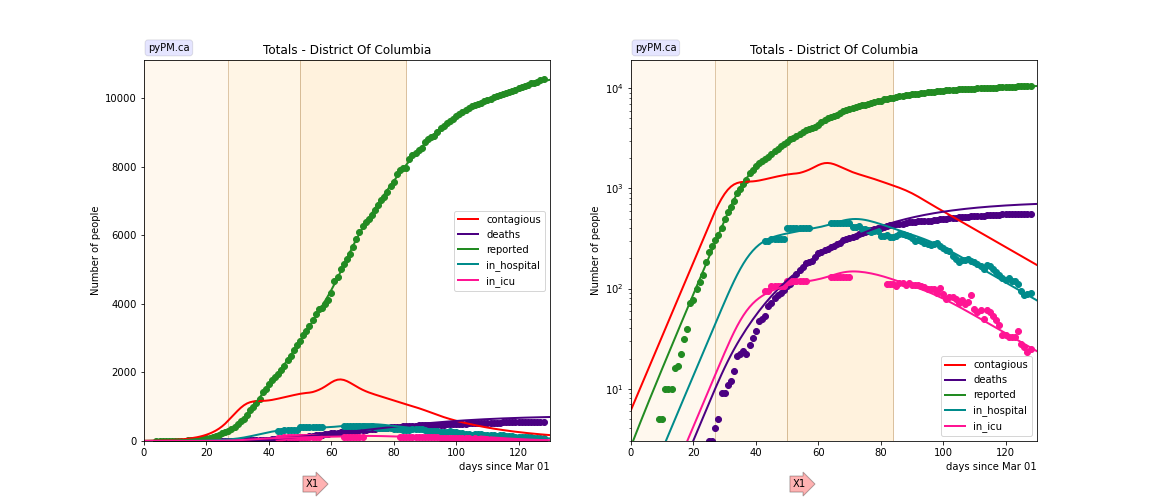
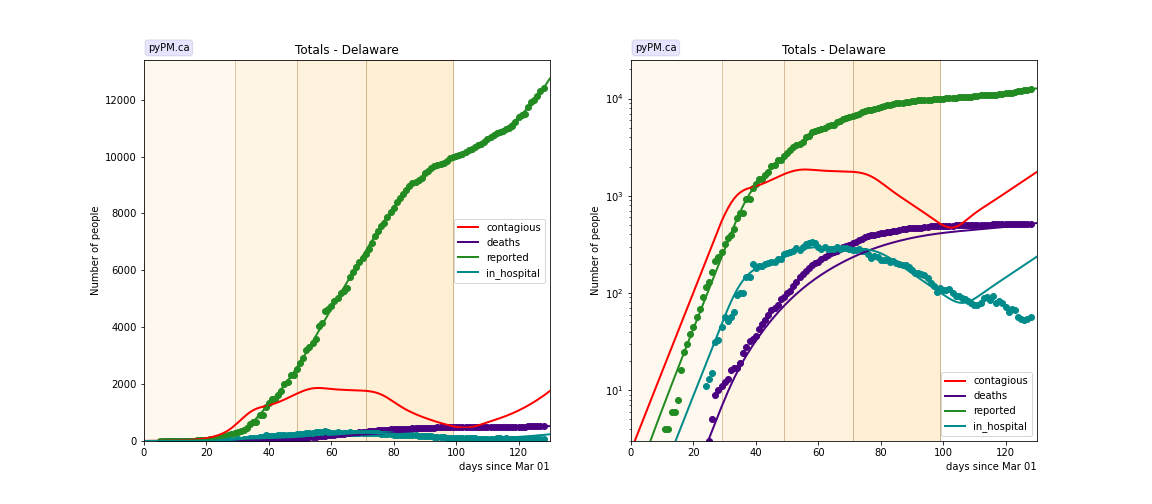
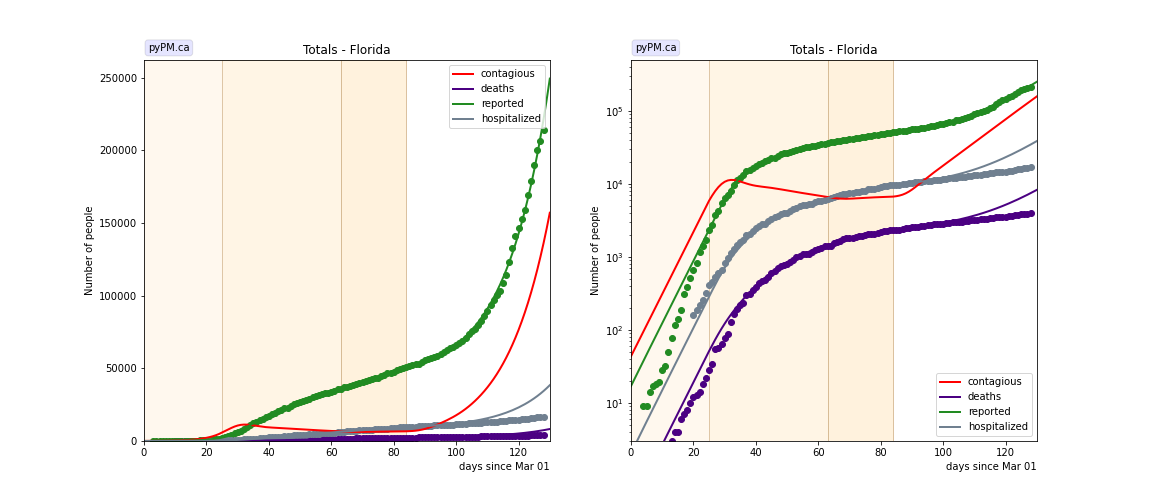
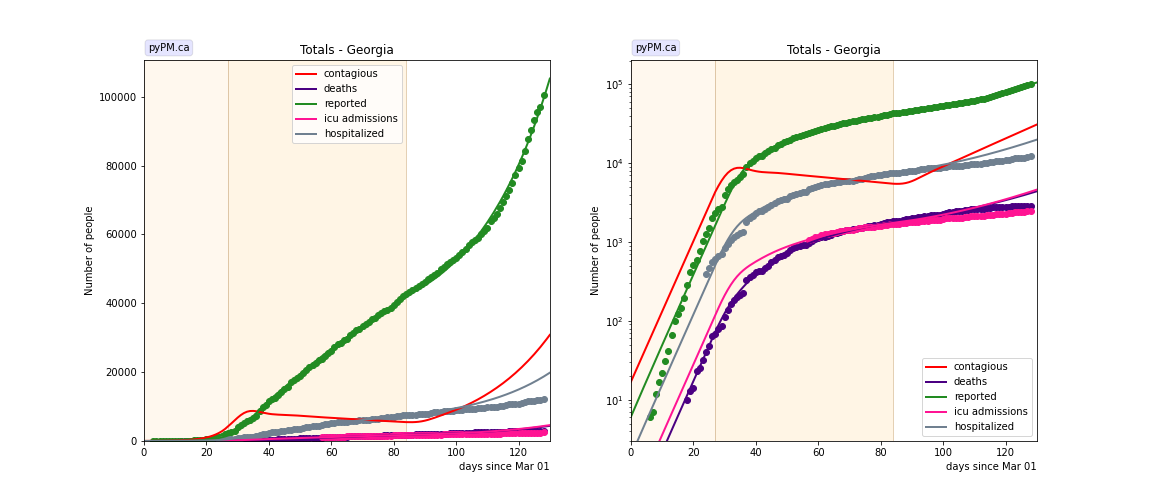
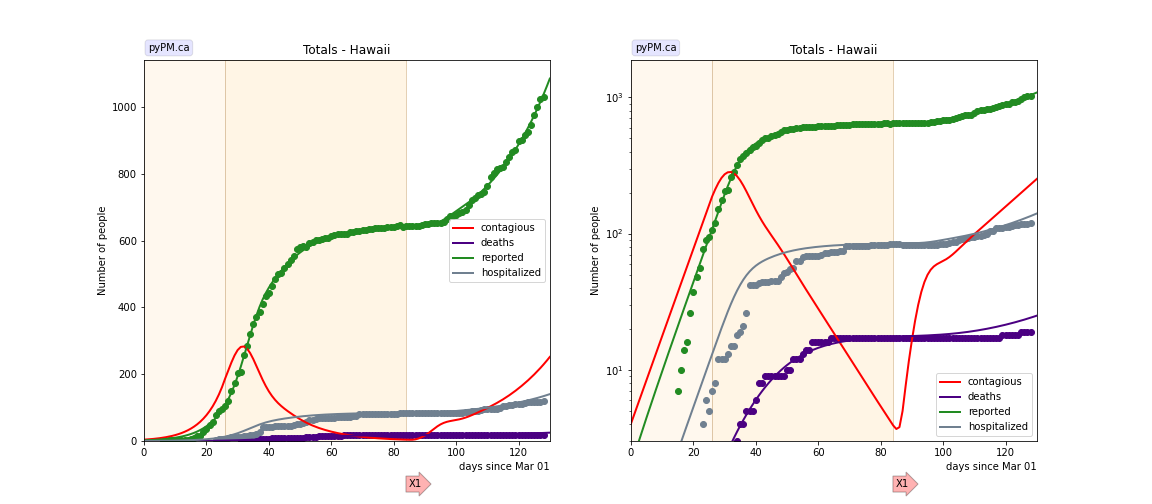
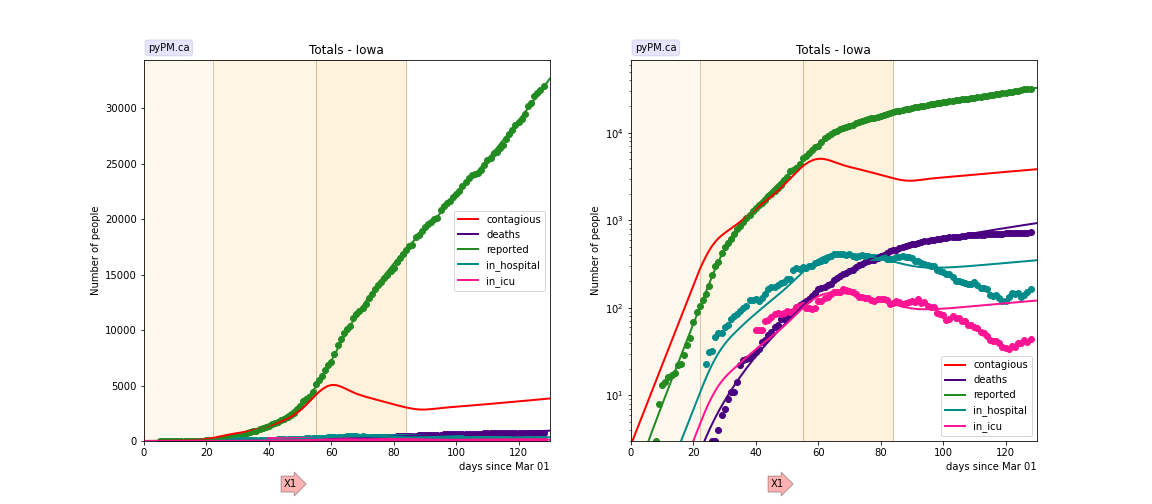
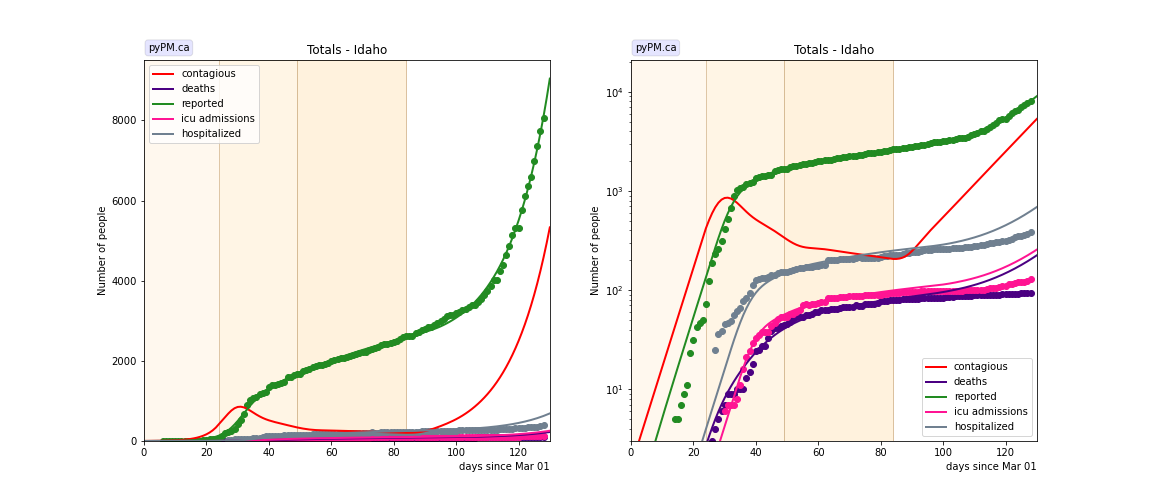
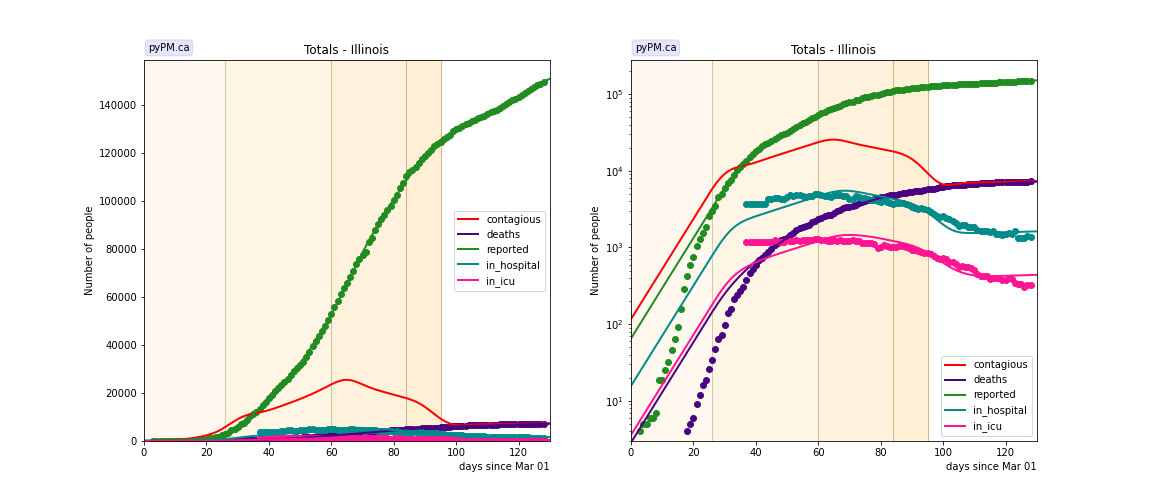
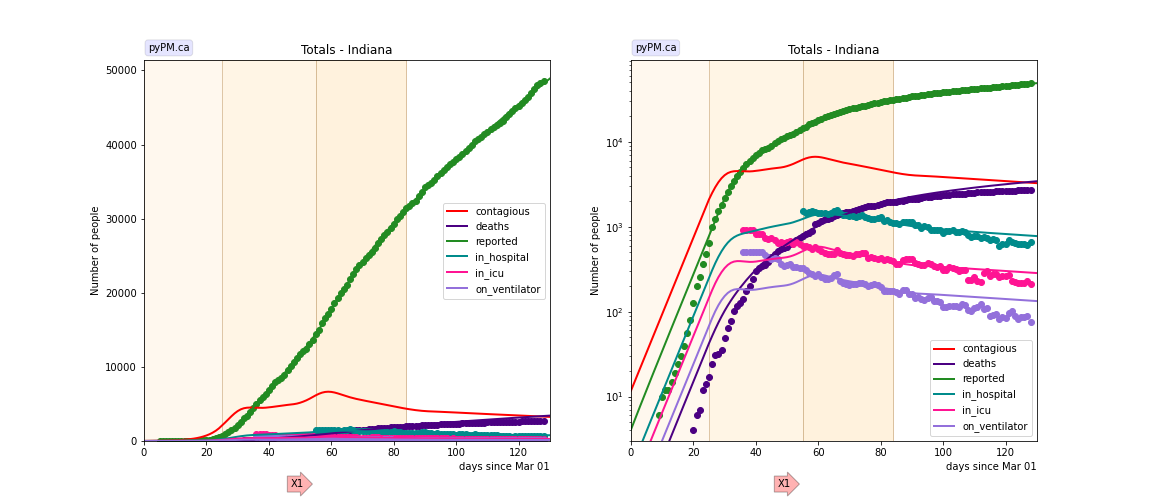
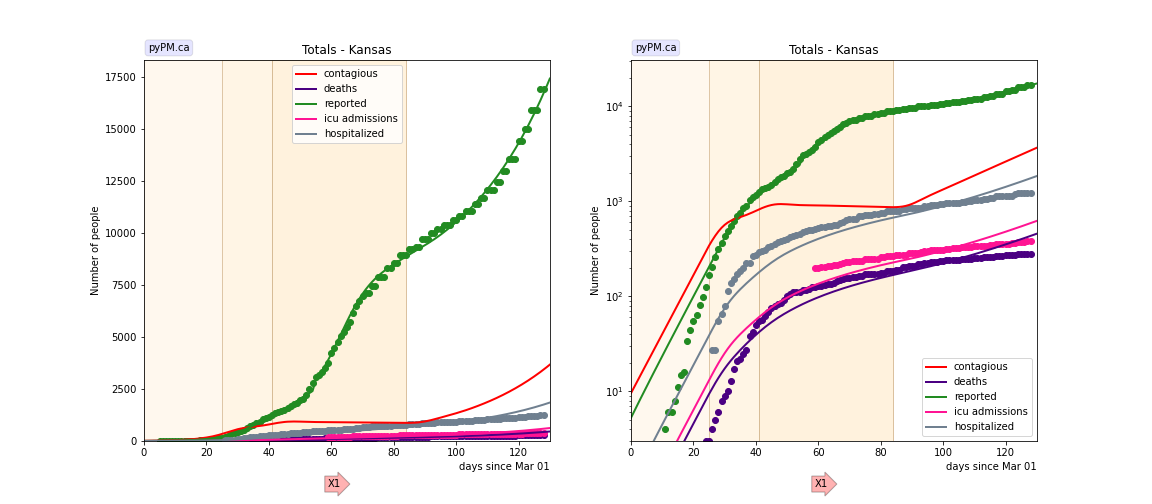
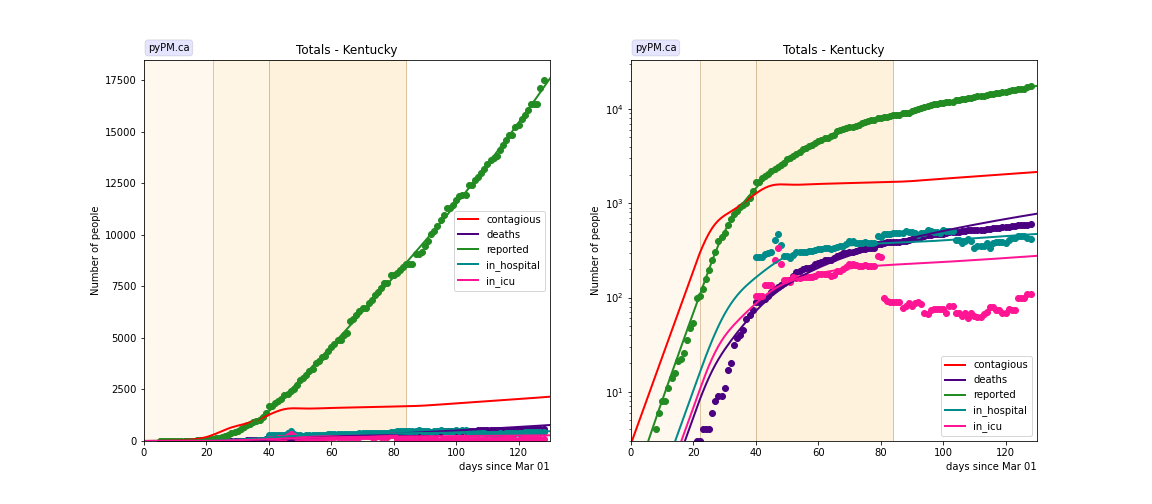
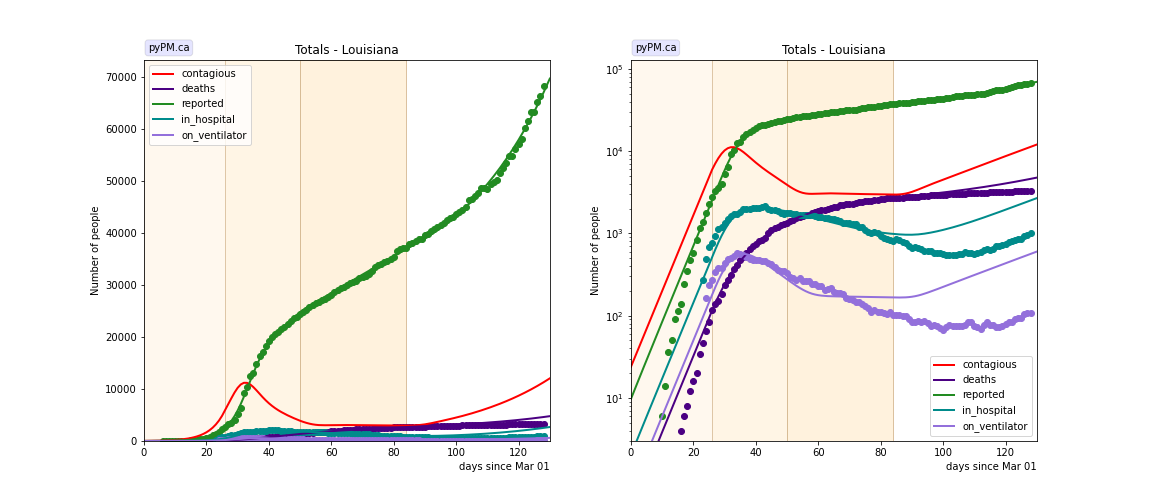
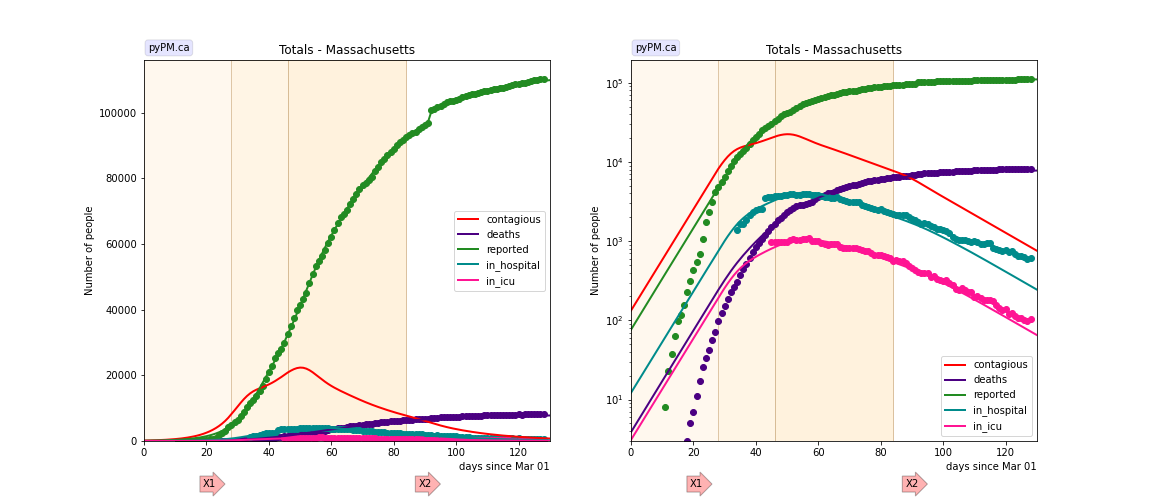
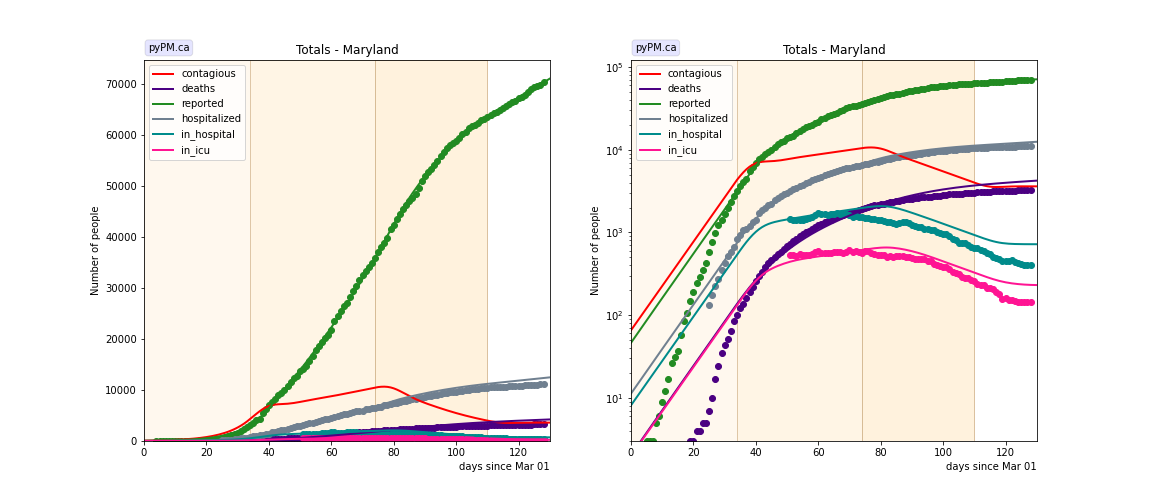
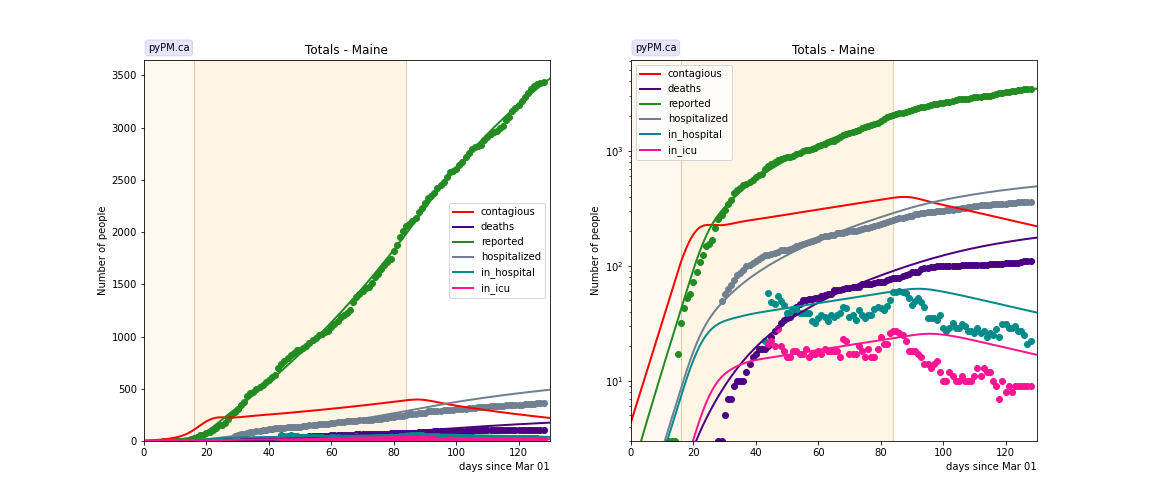
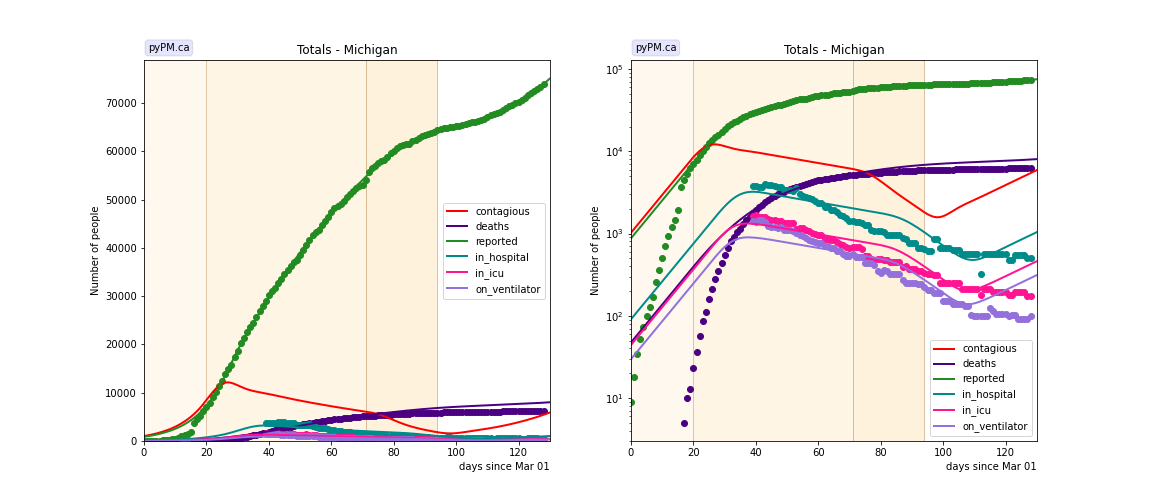
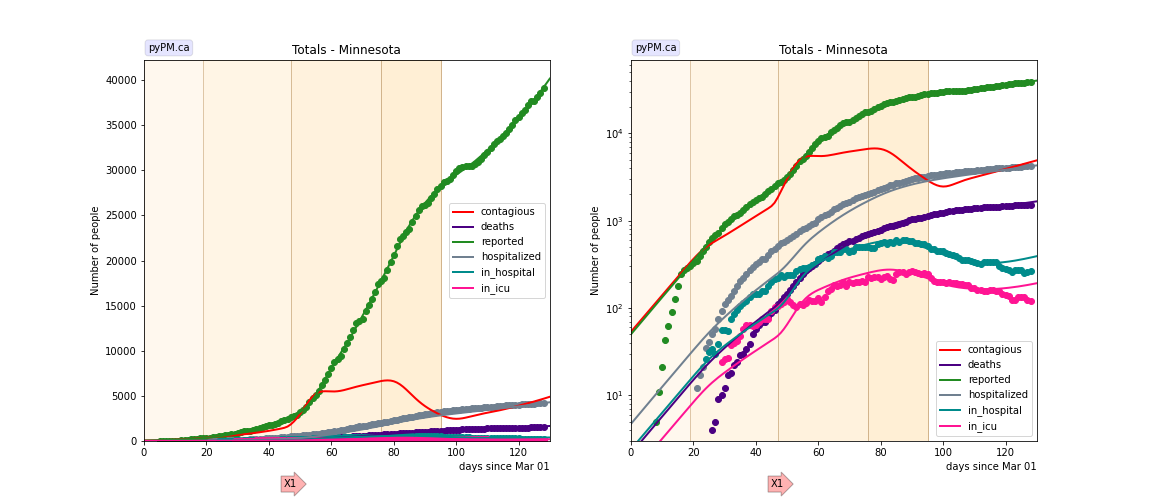
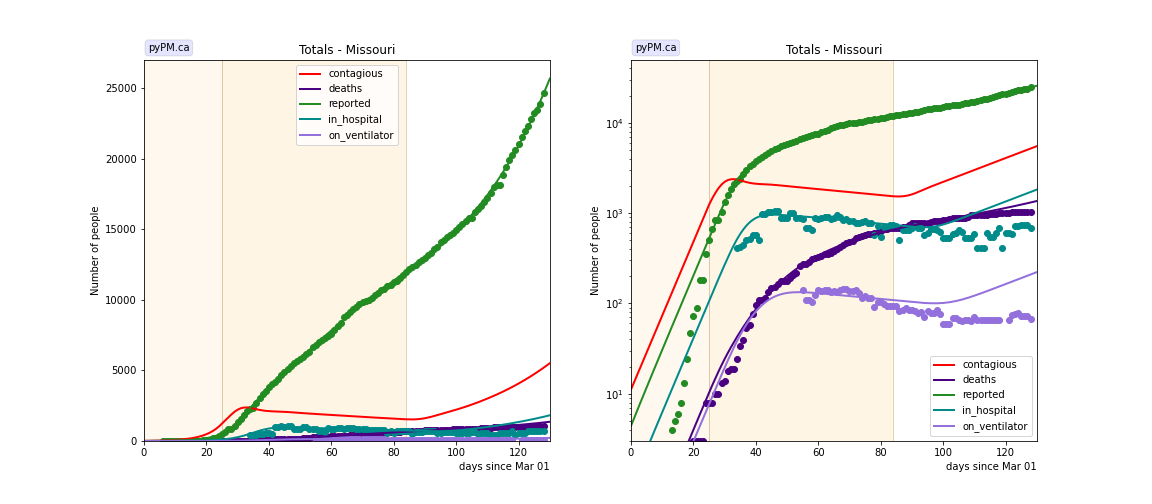
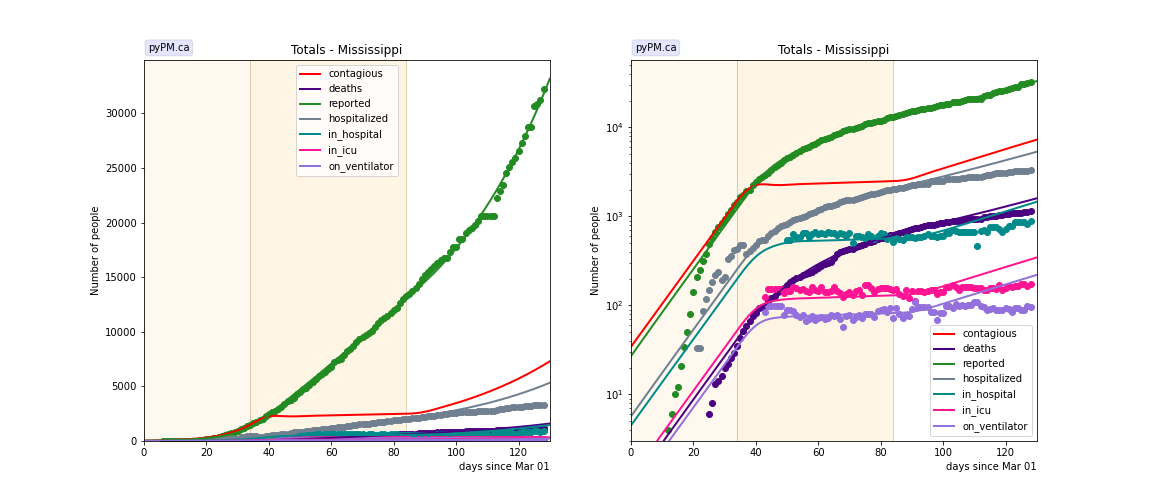
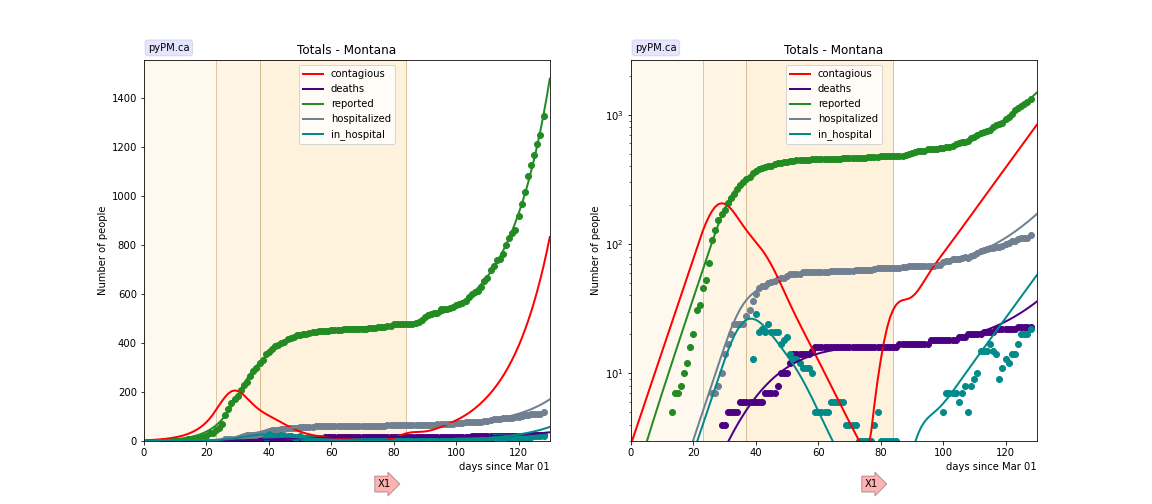
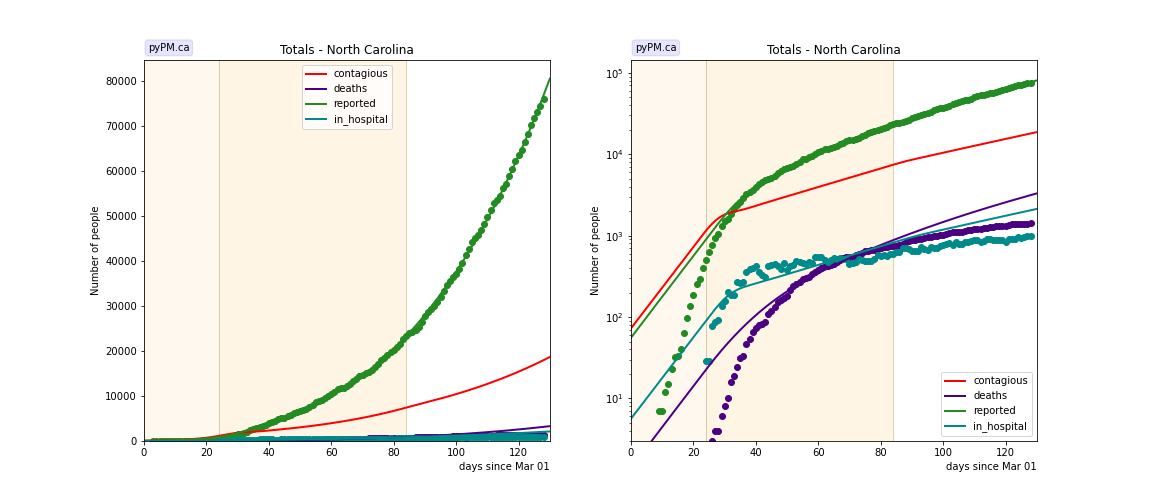
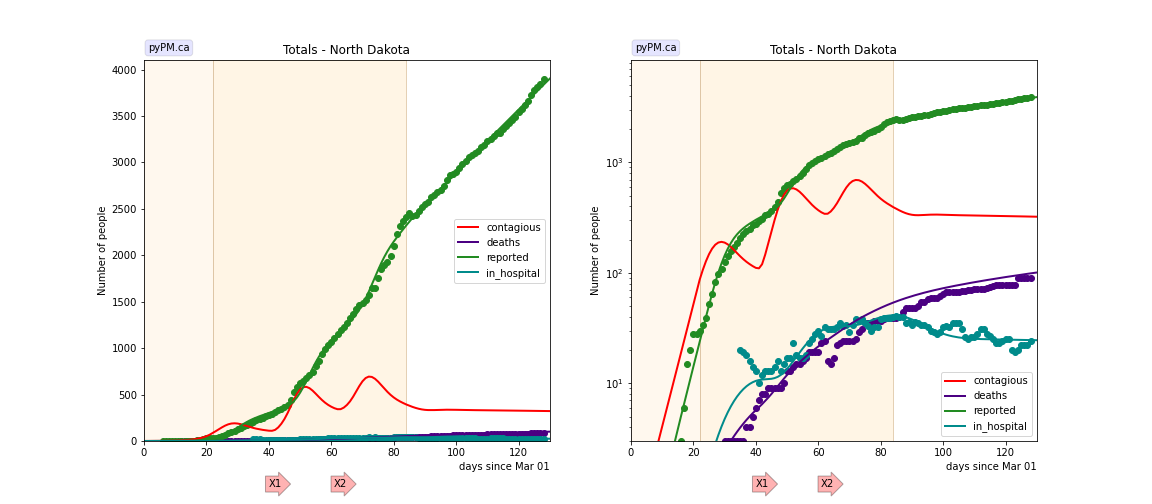
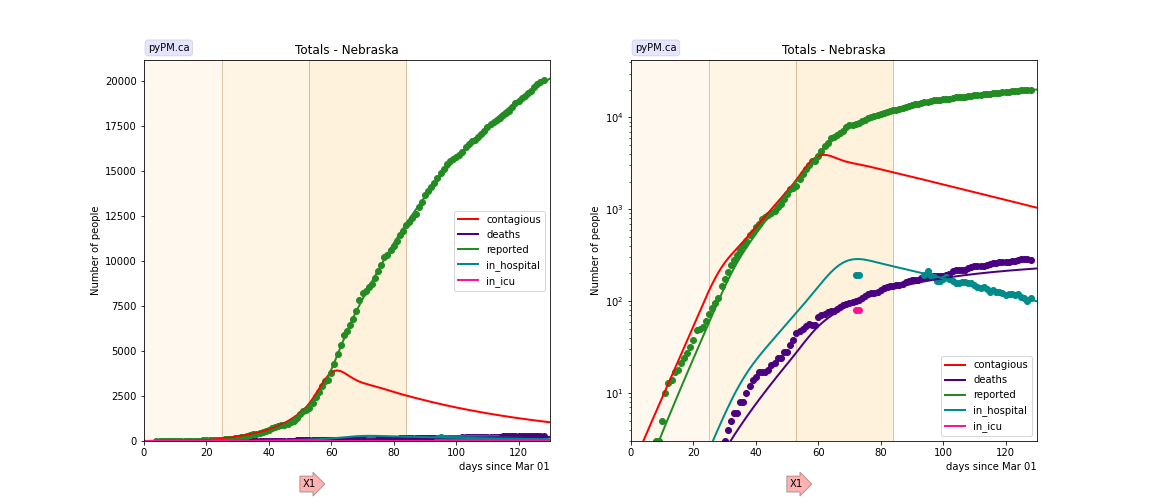
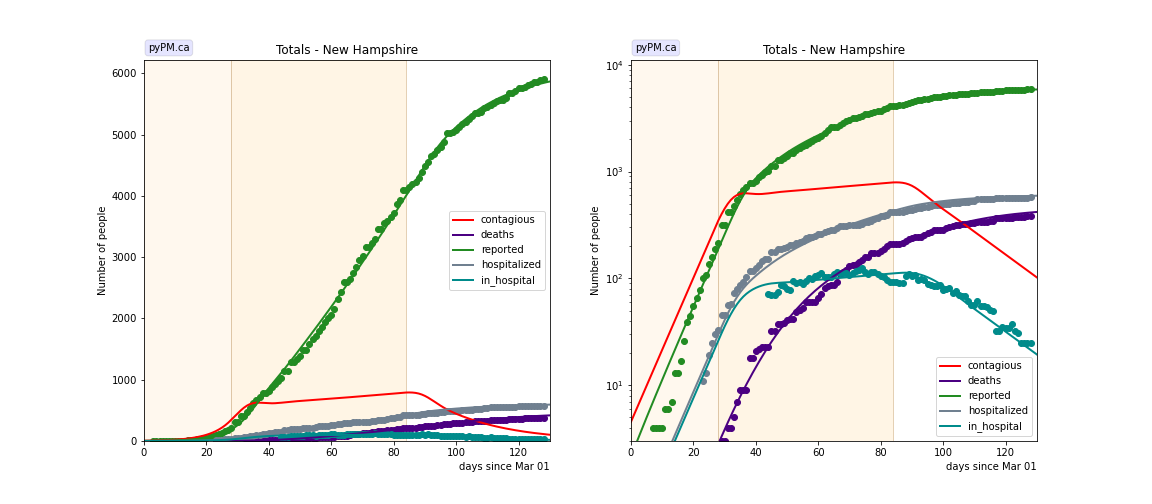
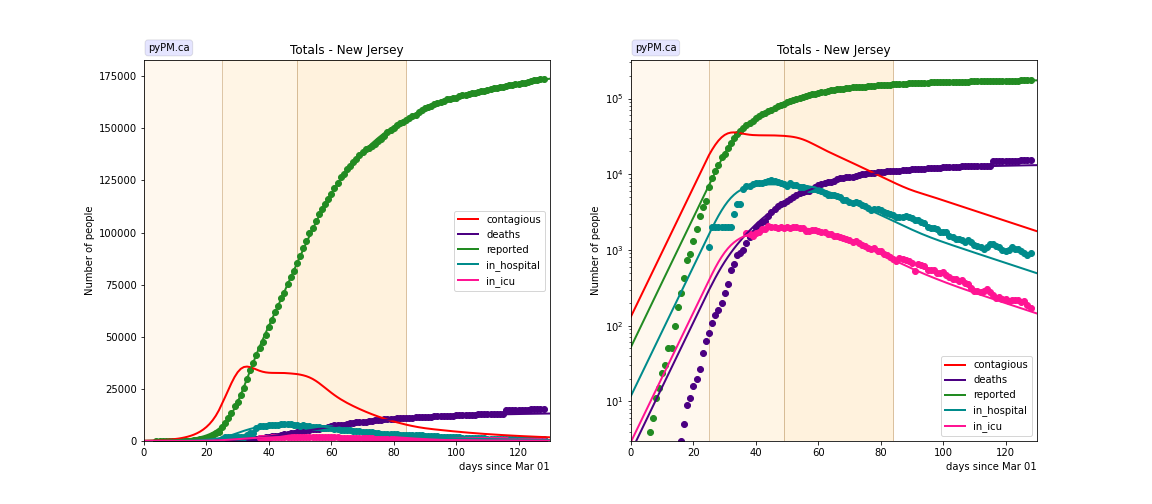
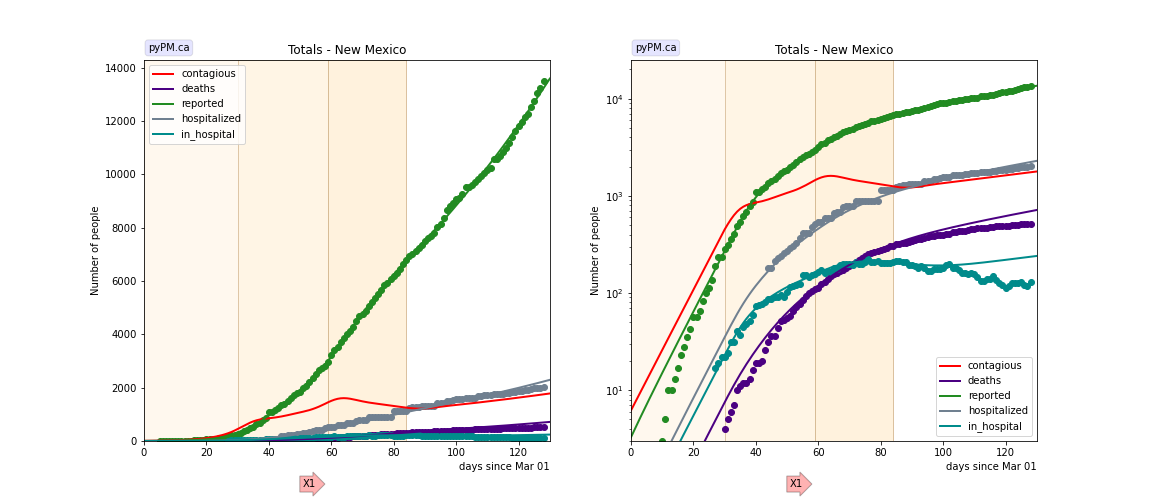
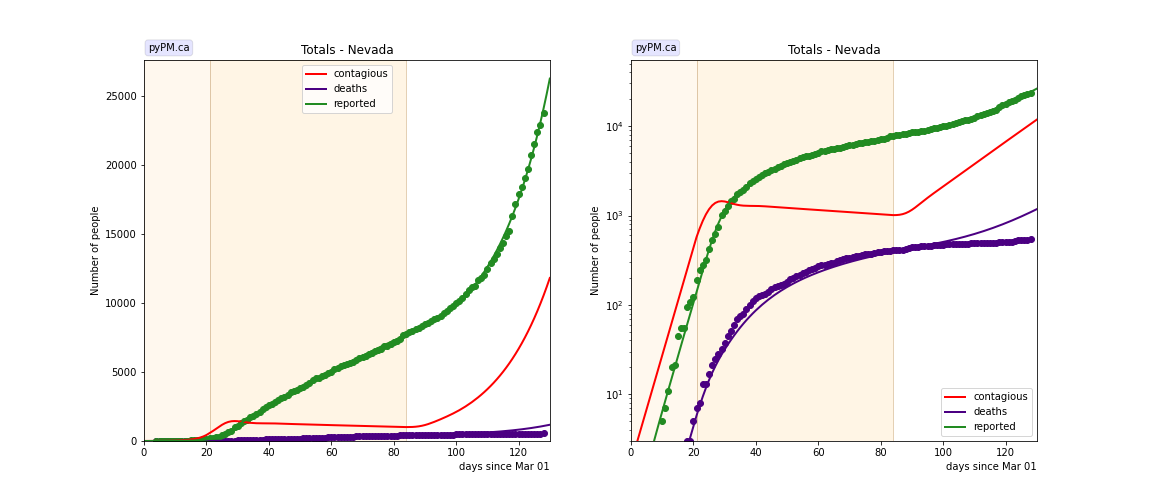
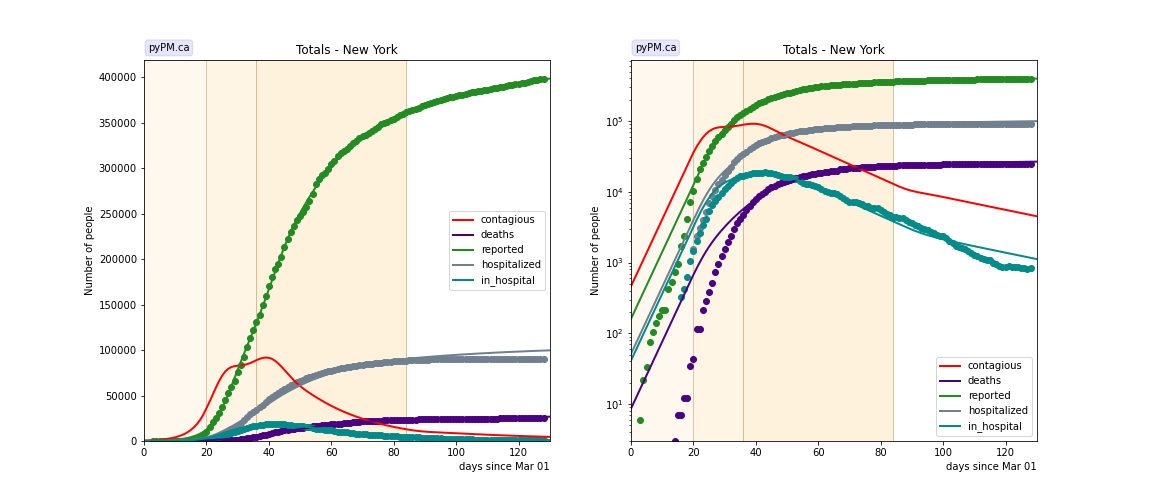
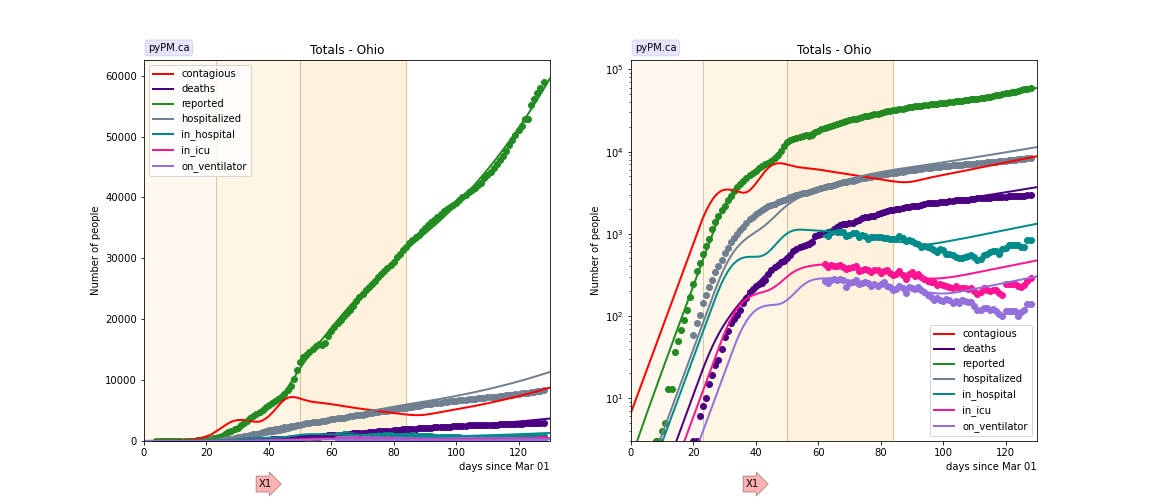
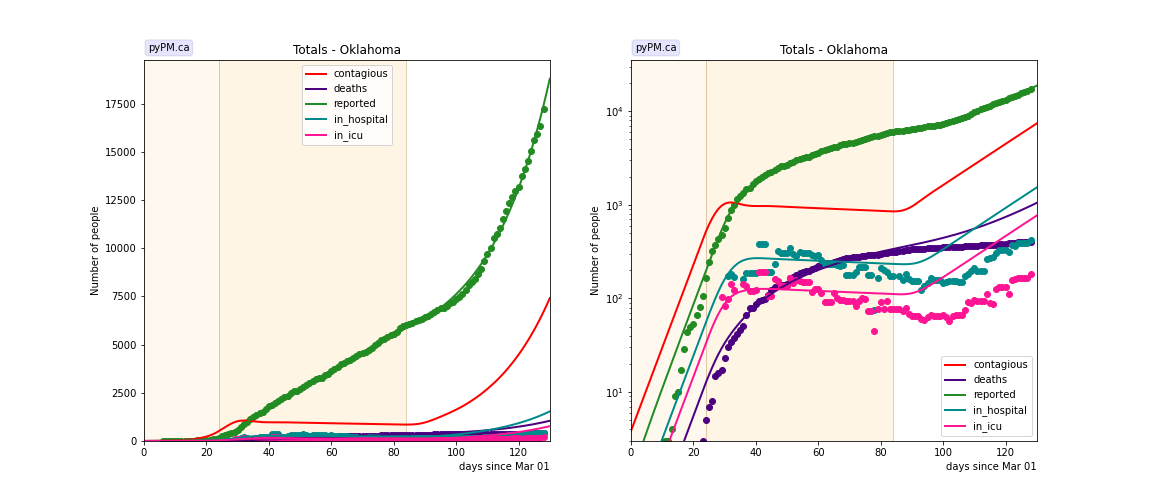
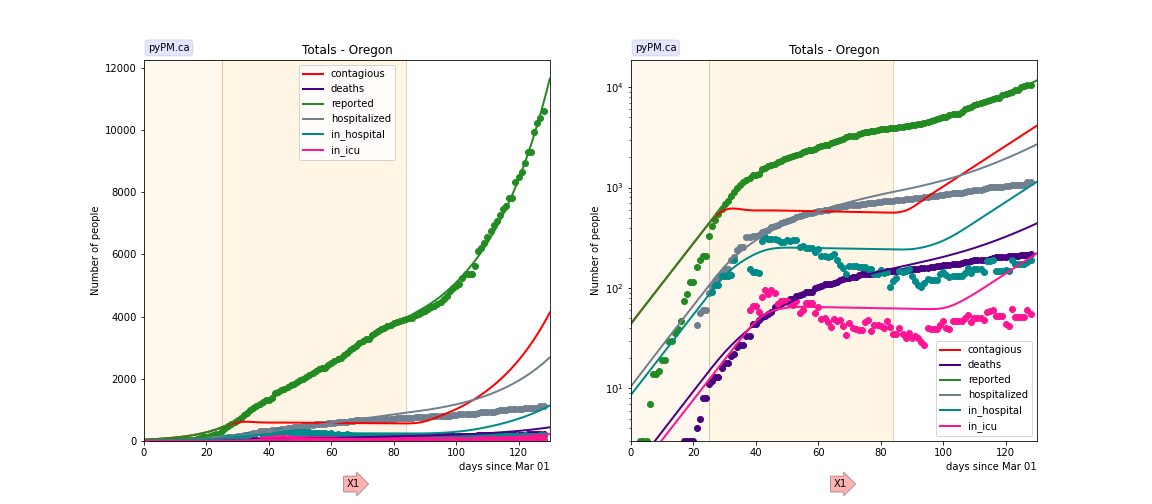
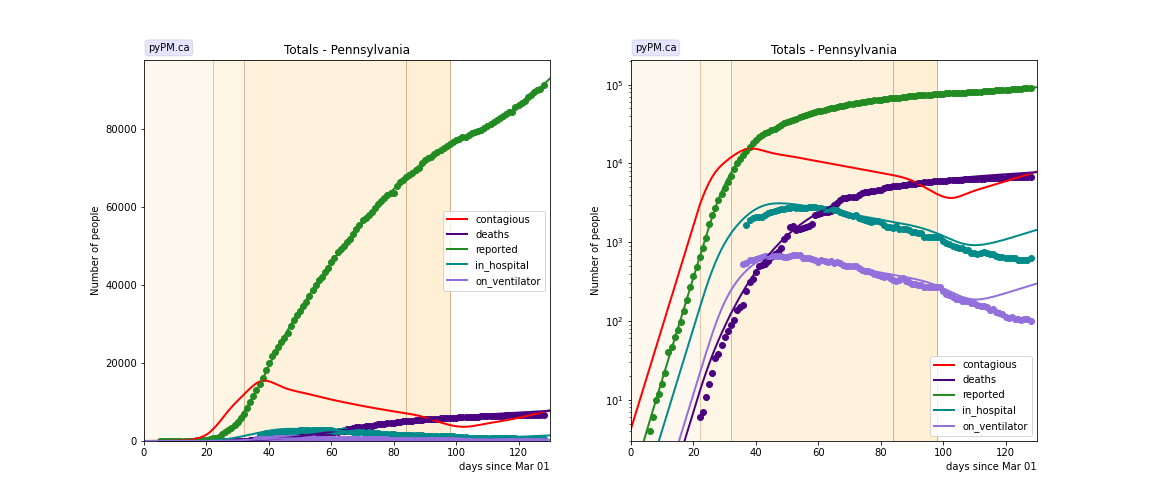
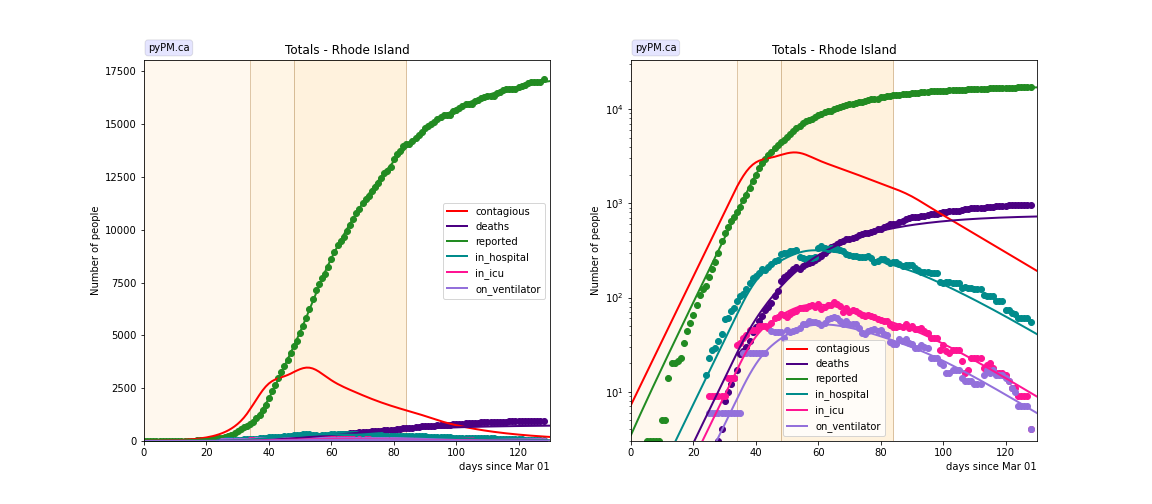
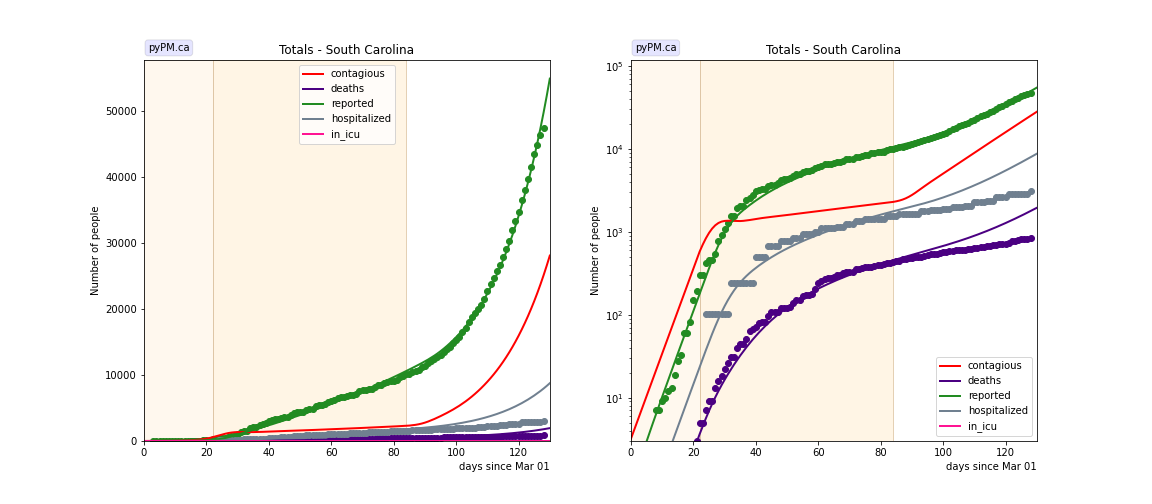
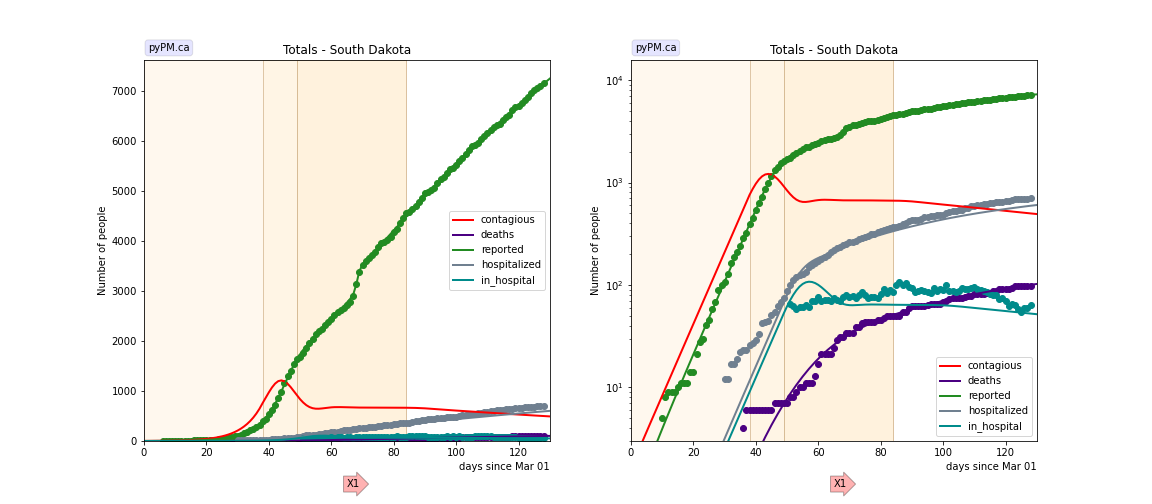
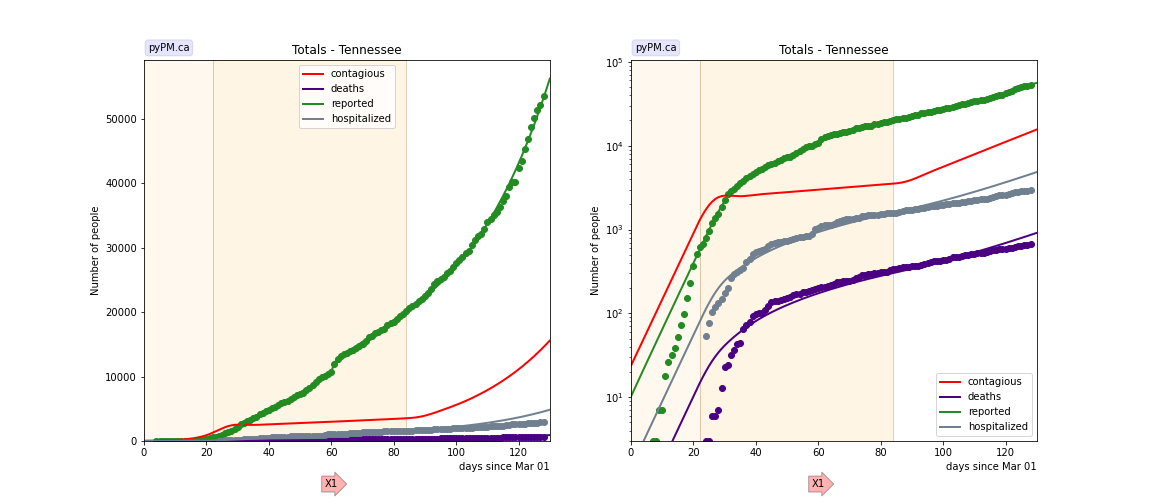
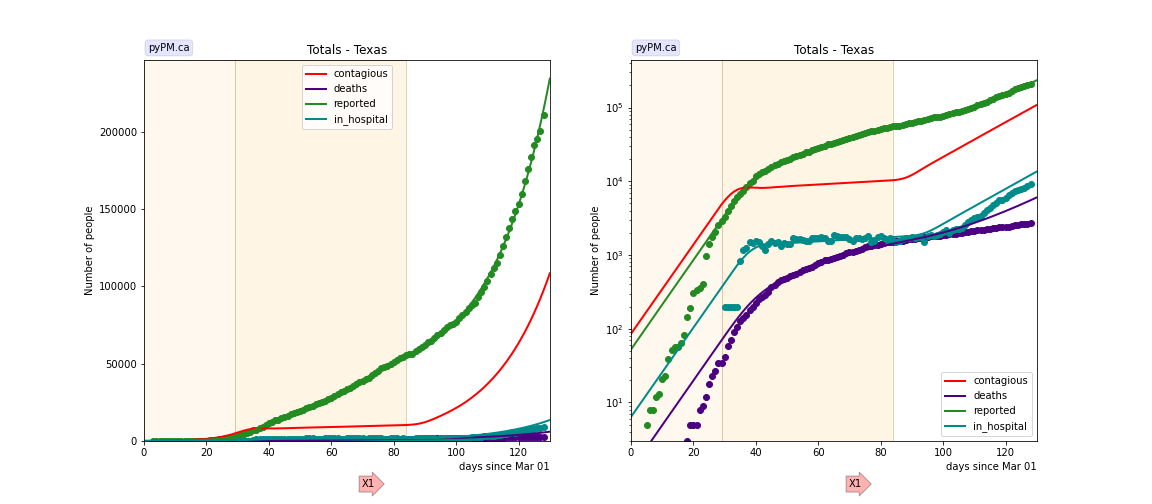
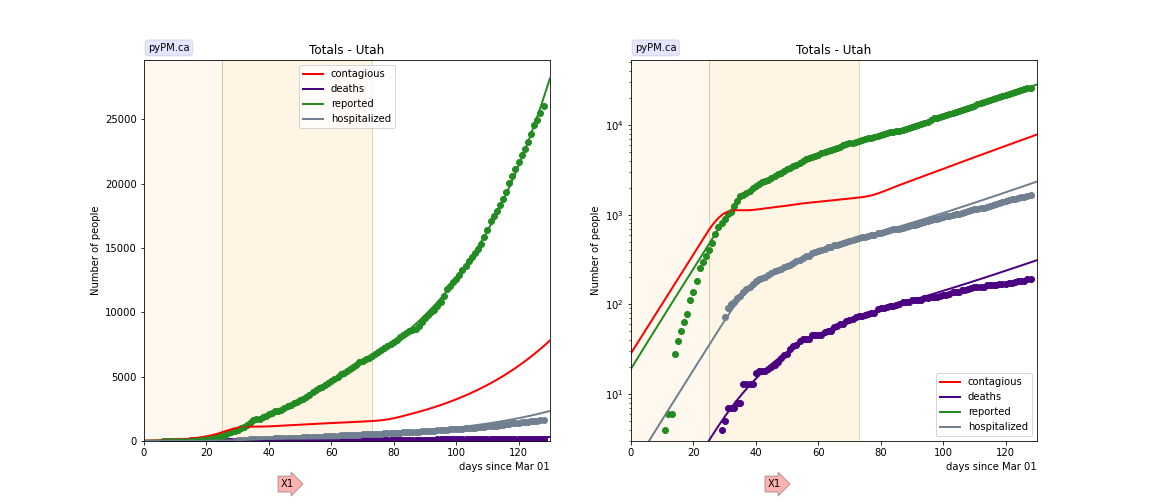
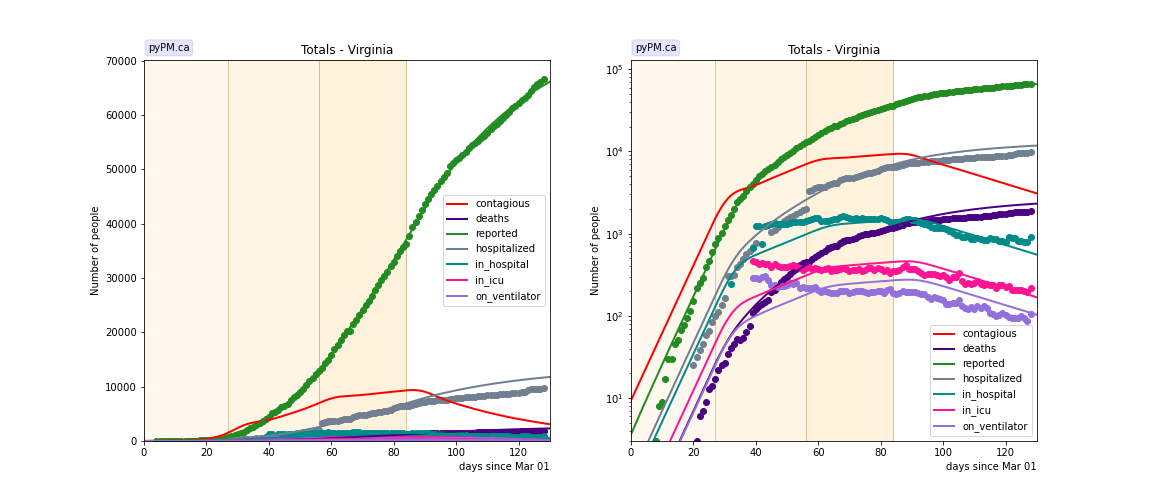
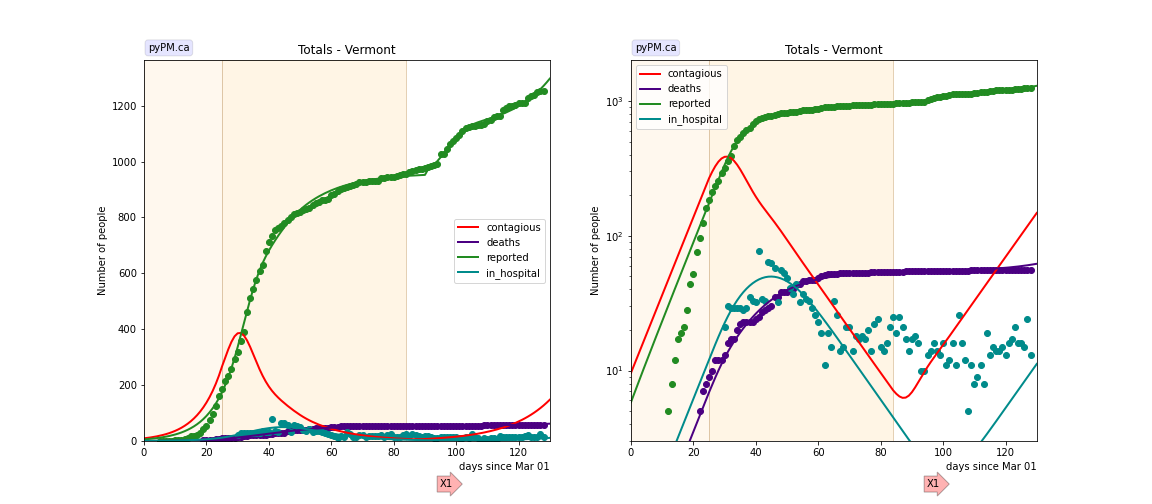
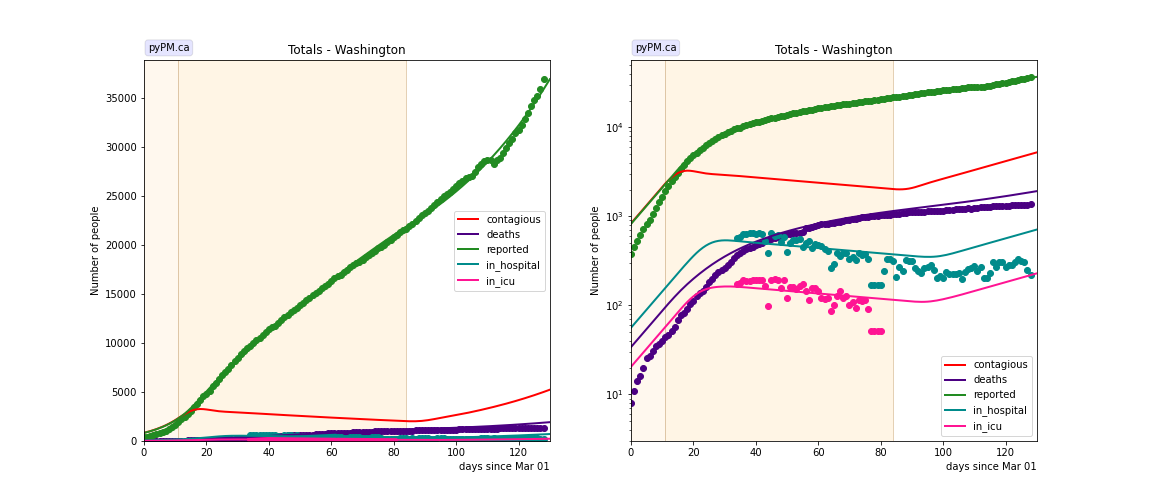
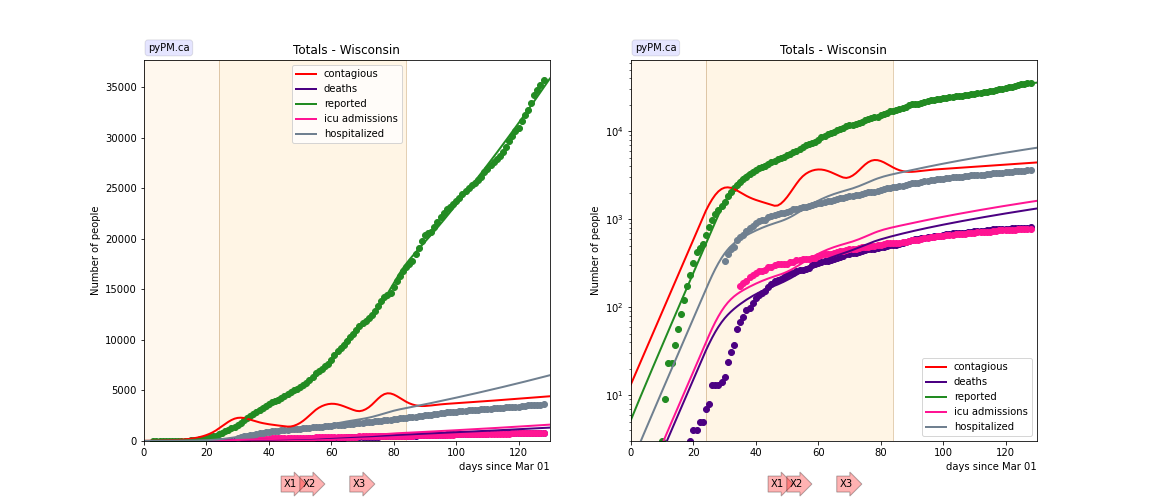
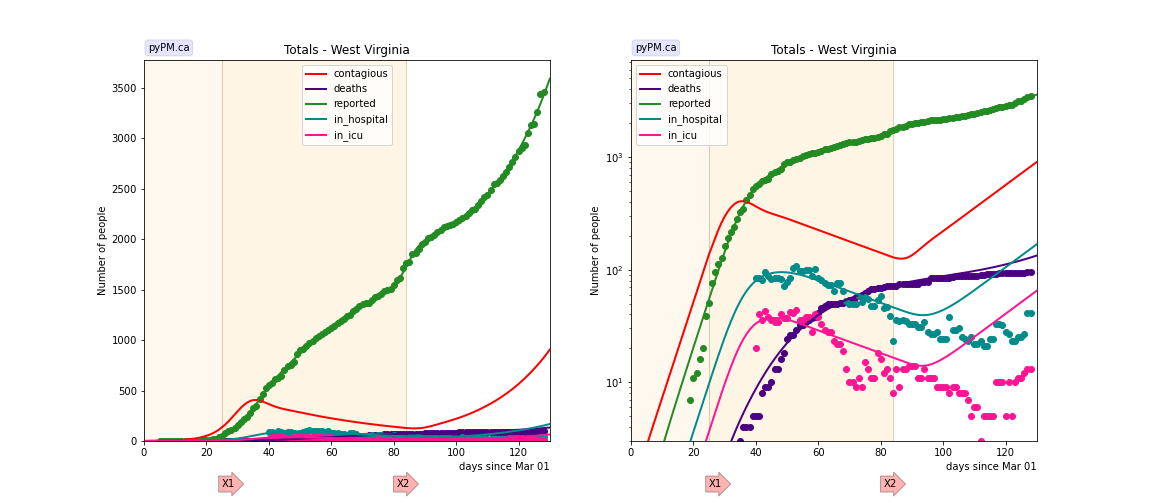
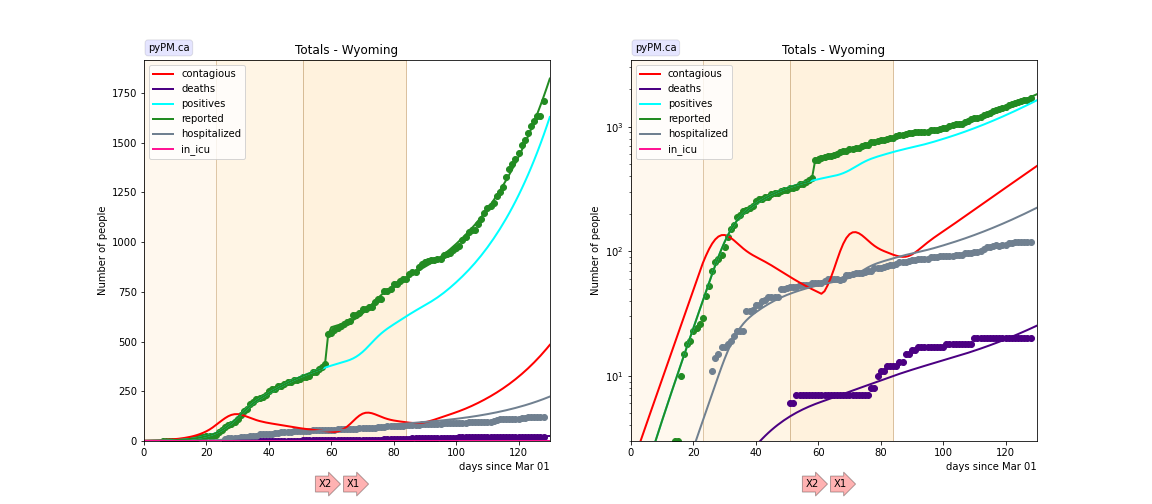
The plots below show the case / hospitalization / deaths data for all 50 states and DC. The infection trajectory is determined by fits to the cumulative case data. For most states, case data can be well described by a constant transmission rate since Memorial day weekend (day 84).
The red curves (contagious population) is the inferred contagious population. Its shape is determined from the case data. Its scale is not well known.
The data fits were done using data up until July 7.
Alaska
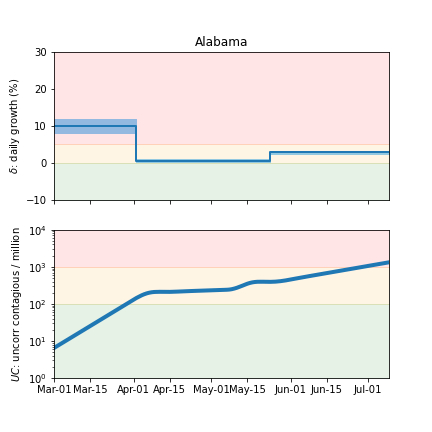
Alabama
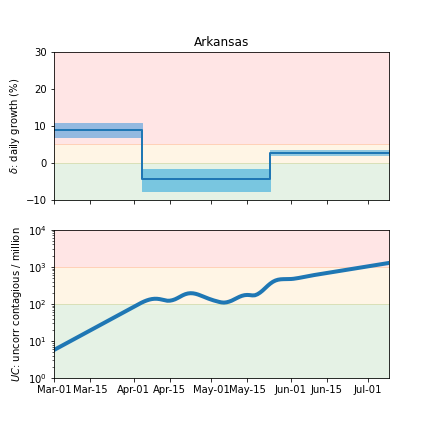
Arkansas
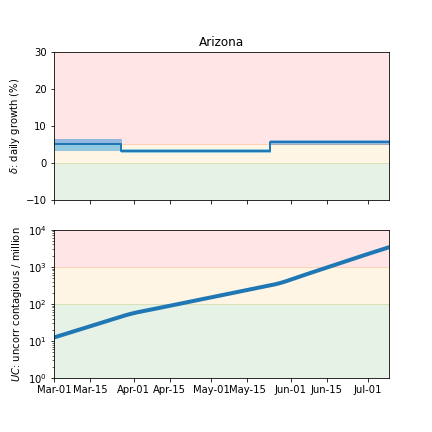
Arizona
California
Colorado
Connecticut
District Of Columbia
Delaware
Florida
Georgia
Hawaii
Iowa
Idaho
Illinois
Indiana
Kansas
Kentucky
Louisiana
Massachusetts
Maryland
Maine
Michigan
Minnesota
Missouri
Mississippi
Montana
North Carolina
North Dakota
Nebraska
New Hampshire
New Jersey
New Mexico
Nevada
New York
Ohio
Oklahoma
Oregon
Pennsylvania
Rhode Island
South Carolina
South Dakota
Tennessee
Texas
Utah
Virginia
Vermont
Washington
Wisconsin
West Virginia
Wyoming
Tables
The tables below are results from the fits to reference model 2.3. These are shown for purposes of comparison.
Daily fractional growth rates (δ)
| state | δ0 | day 1 | δ1 | day 2 | δ2 | day 3 | δ3 | day 4 | δ4 |
|---|---|---|---|---|---|---|---|---|---|
| AL | 0.102 +/- 0.009 | 32 | 0.007 +/- 0.002 | 84 | 0.030 +/- 0.002 | ||||
| AR | 0.090 +/- 0.010 | 34 | -0.041 +/- 0.014 | 84 | 0.028 +/- 0.003 | ||||
| AZ | 0.051 +/- 0.008 | 26 | 0.034 +/- 0.002 | 84 | 0.056 +/- 0.003 | ||||
| CA | 0.172 +/- 0.011 | 27 | 0.010 +/- 0.001 | 84 | 0.035 +/- 0.001 | ||||
| CO | 0.151 +/- 0.014 | 24 | 0.011 +/- 0.006 | 44 | -0.020 +/- 0.004 | 74 | -0.021 +/- 0.006 | 84 | -0.004 +/- 0.004 |
| CT | 0.254 +/- 0.019 | 24 | 0.056 +/- 0.005 | 38 | -0.021 +/- 0.001 | 84 | -0.053 +/- 0.004 | ||
| DC | 0.185 +/- 0.019 | 27 | 0.016 +/- 0.006 | 50 | -0.020 +/- 0.002 | 84 | -0.035 +/- 0.002 | ||
| DE | 0.205 +/- 0.012 | 29 | 0.033 +/- 0.004 | 49 | -0.001 +/- 0.003 | 71 | -0.044 +/- 0.008 | 99 | 0.053 +/- 0.008 |
| FL | 0.217 +/- 0.015 | 25 | -0.014 +/- 0.002 | 63 | 0.006 +/- 0.003 | 84 | 0.077 +/- 0.002 | ||
| GA | 0.228 +/- 0.015 | 27 | -0.006 +/- 0.001 | 84 | 0.043 +/- 0.002 | ||||
| HI | 0.159 +/- 0.021 | 26 | -0.074 +/- 0.015 | 84 | 0.048 +/- 0.015 | ||||
| IA | 0.232 +/- 0.009 | 22 | 0.069 +/- 0.004 | 55 | -0.019 +/- 0.001 | 84 | 0.010 +/- 0.002 | ||
| ID | 0.259 +/- 0.018 | 24 | -0.044 +/- 0.008 | 49 | -0.008 +/- 0.007 | 84 | 0.080 +/- 0.004 | ||
| IL | 0.162 +/- 0.010 | 26 | 0.032 +/- 0.002 | 60 | -0.016 +/- 0.001 | 84 | -0.077 +/- 0.004 | 95 | 0.006 +/- 0.003 |
| IN | 0.230 +/- 0.022 | 25 | 0.011 +/- 0.002 | 55 | -0.014 +/- 0.002 | 84 | -0.003 +/- 0.003 | ||
| KS | 0.154 +/- 0.020 | 25 | 0.035 +/- 0.016 | 41 | -0.000 +/- 0.008 | 84 | 0.035 +/- 0.008 | ||
| KY | 0.235 +/- 0.021 | 22 | 0.058 +/- 0.007 | 40 | 0.004 +/- 0.003 | 84 | 0.007 +/- 0.004 | ||
| LA | 0.267 +/- 0.013 | 26 | -0.047 +/- 0.004 | 50 | 0.013 +/- 0.004 | 84 | 0.052 +/- 0.003 | ||
| MA | 0.159 +/- 0.014 | 28 | 0.033 +/- 0.004 | 46 | -0.028 +/- 0.002 | 84 | -0.045 +/- 0.002 | ||
| MD | 0.131 +/- 0.006 | 34 | 0.015 +/- 0.001 | 74 | -0.027 +/- 0.002 | 110 | 0.003 +/- 0.016 | ||
| ME | 0.221 +/- 0.073 | 16 | 0.011 +/- 0.005 | 84 | -0.012 +/- 0.005 | ||||
| MI | 0.112 +/- 0.005 | 20 | -0.012 +/- 0.001 | 71 | -0.054 +/- 0.005 | 94 | 0.044 +/- 0.005 | ||
| MN | 0.101 +/- 0.016 | 19 | 0.053 +/- 0.006 | 47 | 0.014 +/- 0.002 | 76 | -0.052 +/- 0.003 | 95 | 0.025 +/- 0.003 |
| MO | 0.207 +/- 0.032 | 25 | -0.006 +/- 0.004 | 84 | 0.032 +/- 0.003 | ||||
| MS | 0.118 +/- 0.008 | 34 | 0.004 +/- 0.004 | 84 | 0.027 +/- 0.002 | ||||
| MT | 0.179 +/- 0.033 | 23 | -0.054 +/- 0.020 | 37 | -0.097 +/- 0.045 | 84 | 0.080 +/- 0.013 | ||
| NC | 0.122 +/- 0.017 | 24 | 0.027 +/- 0.001 | 84 | 0.021 +/- 0.001 | ||||
| ND | 0.289 +/- 0.108 | 22 | -0.040 +/- 0.004 | 84 | 0.001 +/- 0.004 | ||||
| NE | 0.196 +/- 0.024 | 25 | 0.094 +/- 0.034 | 53 | -0.015 +/- 0.005 | 84 | -0.016 +/- 0.004 | ||
| NH | 0.168 +/- 0.029 | 28 | 0.007 +/- 0.010 | 84 | -0.044 +/- 0.020 | ||||
| NJ | 0.217 +/- 0.006 | 25 | -0.001 +/- 0.001 | 49 | -0.038 +/- 0.001 | 84 | -0.025 +/- 0.002 | ||
| NM | 0.153 +/- 0.024 | 30 | 0.025 +/- 0.009 | 59 | -0.010 +/- 0.005 | 84 | 0.011 +/- 0.005 | ||
| NV | 0.318 +/- 0.042 | 21 | -0.004 +/- 0.004 | 84 | 0.060 +/- 0.003 | ||||
| NY | 0.243 +/- 0.008 | 20 | 0.020 +/- 0.002 | 36 | -0.039 +/- 0.000 | 84 | -0.016 +/- 0.002 | ||
| OH | 0.267 +/- 0.031 | 23 | -0.005 +/- 0.008 | 50 | -0.011 +/- 0.002 | 84 | 0.019 +/- 0.002 | ||
| OK | 0.226 +/- 0.039 | 24 | -0.002 +/- 0.003 | 84 | 0.053 +/- 0.003 | ||||
| OR | 0.096 +/- 0.022 | 25 | 0.000 +/- 0.006 | 84 | 0.048 +/- 0.003 | ||||
| PA | 0.343 +/- 0.017 | 22 | 0.088 +/- 0.012 | 32 | -0.014 +/- 0.001 | 84 | -0.042 +/- 0.005 | 98 | 0.030 +/- 0.004 |
| RI | 0.170 +/- 0.008 | 34 | 0.028 +/- 0.009 | 48 | -0.024 +/- 0.005 | 84 | -0.039 +/- 0.009 | ||
| SC | 0.266 +/- 0.031 | 22 | 0.012 +/- 0.002 | 84 | 0.060 +/- 0.002 | ||||
| SD | 0.175 +/- 0.022 | 38 | -0.063 +/- 0.025 | 49 | 0.001 +/- 0.012 | 84 | -0.005 +/- 0.029 | ||
| TN | 0.199 +/- 0.038 | 22 | 0.008 +/- 0.001 | 84 | 0.036 +/- 0.002 | ||||
| TX | 0.149 +/- 0.008 | 29 | 0.007 +/- 0.001 | 84 | 0.057 +/- 0.001 | ||||
| UT | 0.135 +/- 0.019 | 25 | 0.010 +/- 0.005 | 73 | 0.031 +/- 0.002 | ||||
| VA | 0.208 +/- 0.011 | 27 | 0.037 +/- 0.002 | 56 | 0.008 +/- 0.002 | 84 | -0.023 +/- 0.002 | ||
| VT | 0.142 +/- 0.028 | 25 | -0.067 +/- 0.015 | 84 | 0.078 +/- 0.036 | ||||
| WA | 0.098 +/- 0.011 | 11 | -0.005 +/- 0.001 | 84 | 0.024 +/- 0.004 | ||||
| WI | 0.208 +/- 0.019 | 24 | -0.027 +/- 0.003 | 84 | 0.008 +/- 0.002 | ||||
| WV | 0.216 +/- 0.045 | 25 | -0.021 +/- 0.010 | 84 | 0.049 +/- 0.014 | ||||
| WY | 0.179 +/- 0.045 | 23 | -0.031 +/- 0.057 | 51 | -0.026 +/- 0.020 | 84 | 0.042 +/- 0.011 |
- δ0: initial daily fractional growth parameter
- day 1: days after March 1, 2020 when transmission rate changed
- transition day 84 (May 23) forced: used to estimate growth following Memorial day weekend
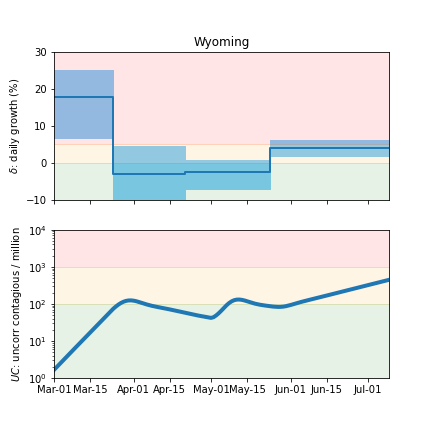
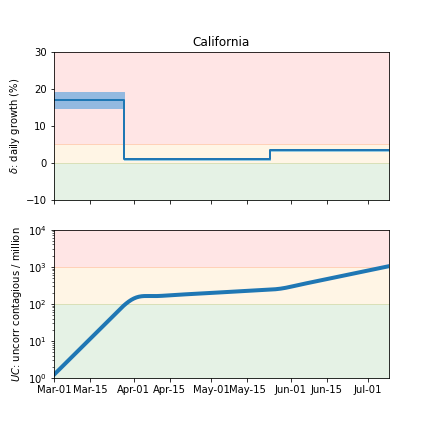
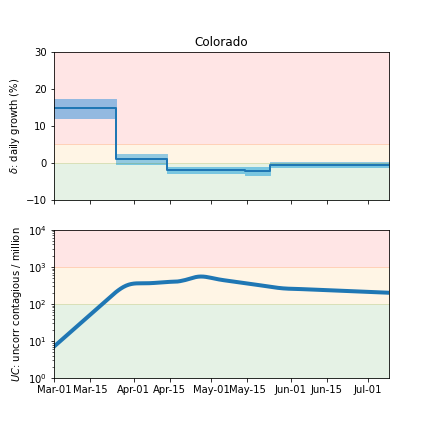
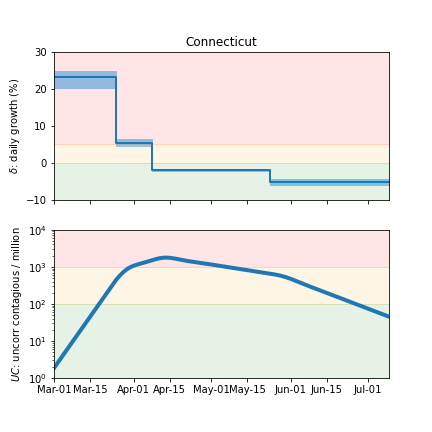
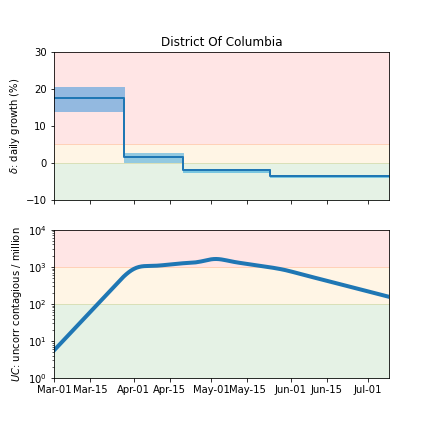
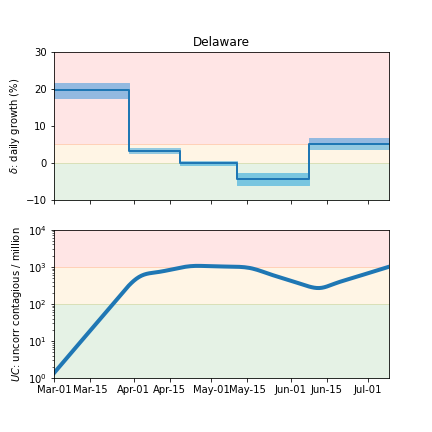
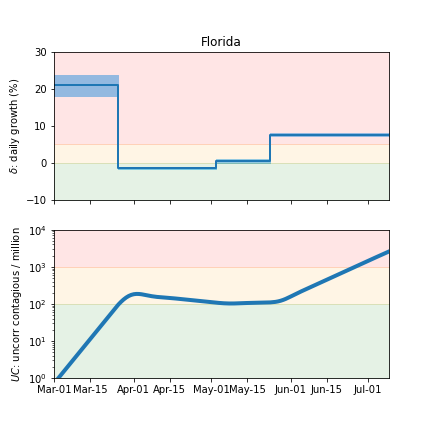
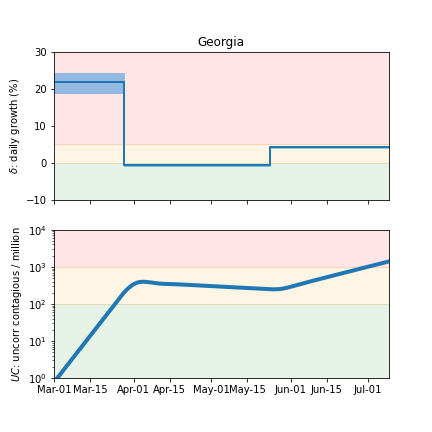
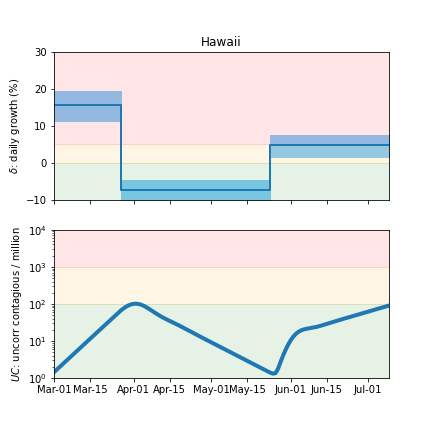
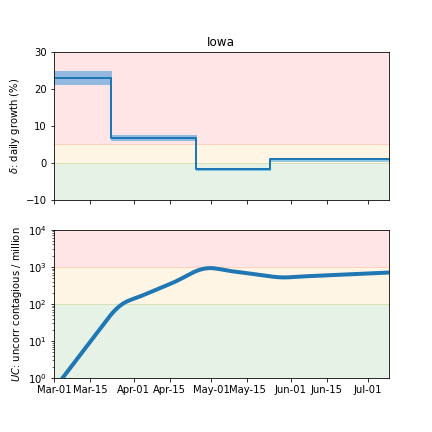
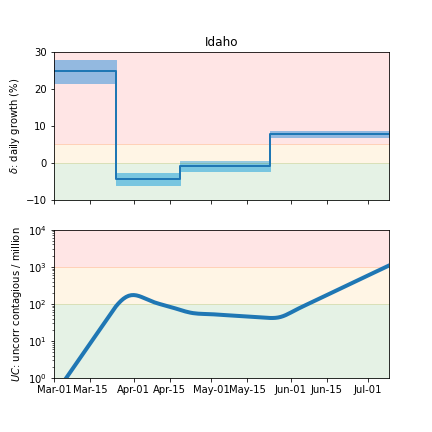
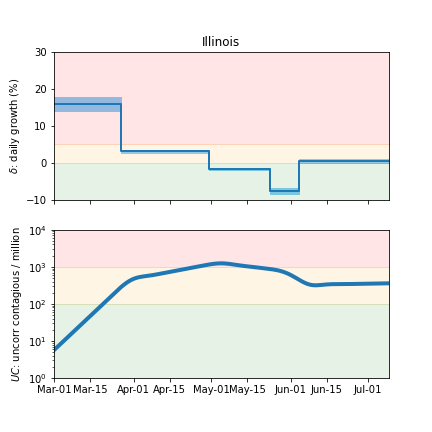
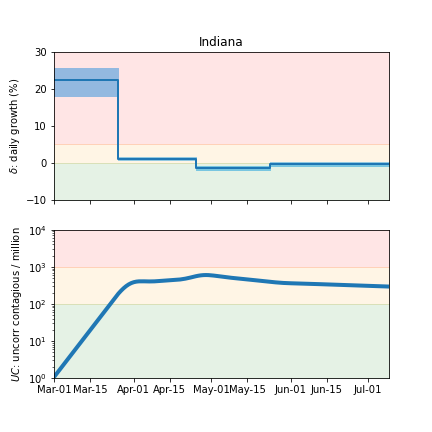
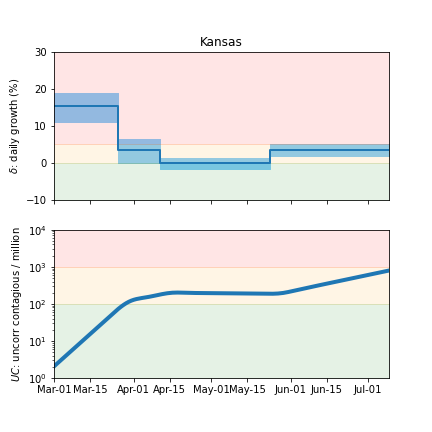
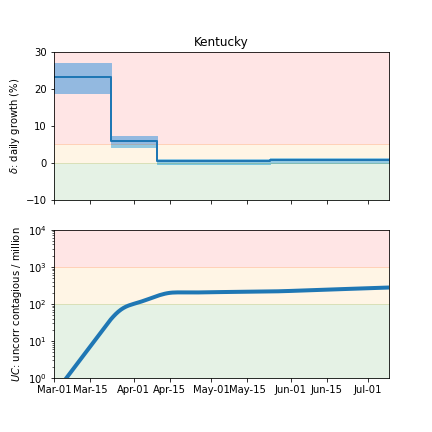
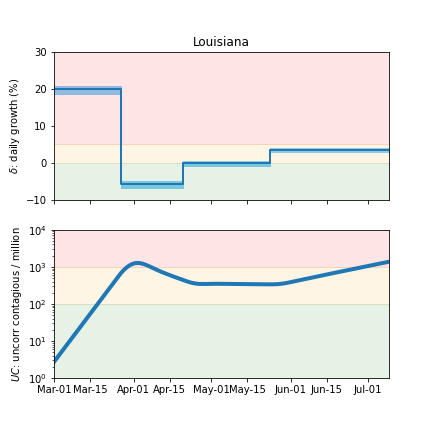
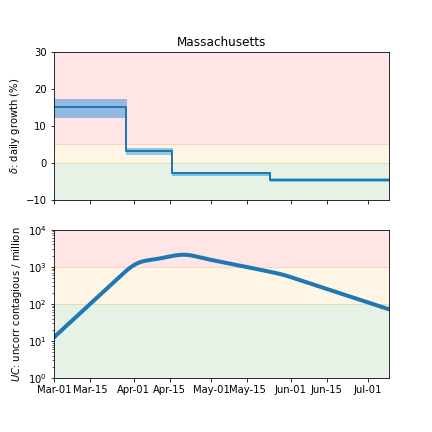
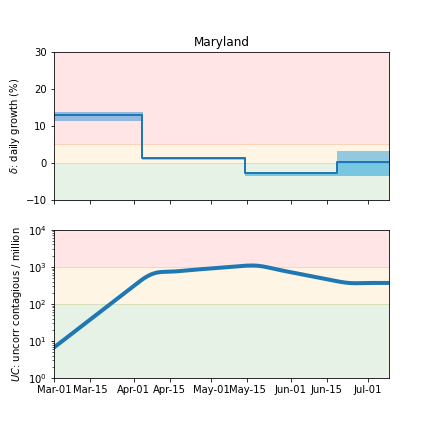
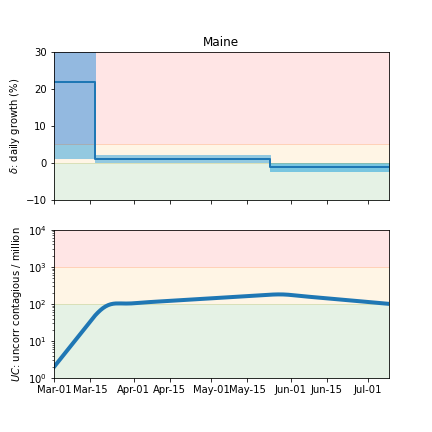
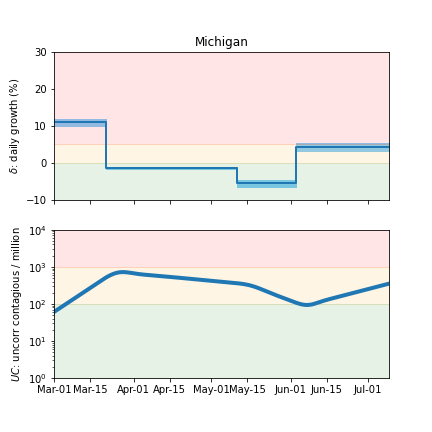
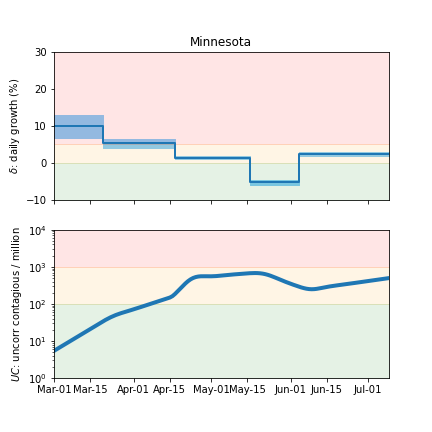
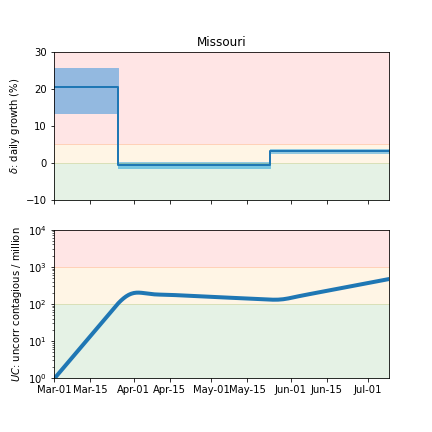
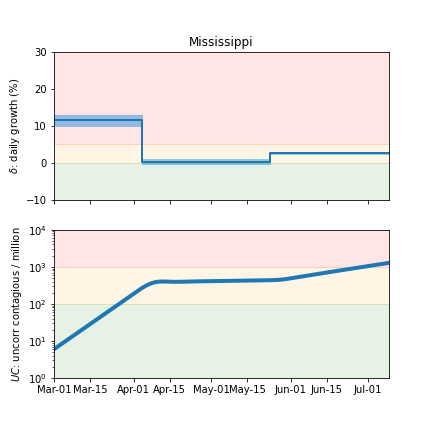
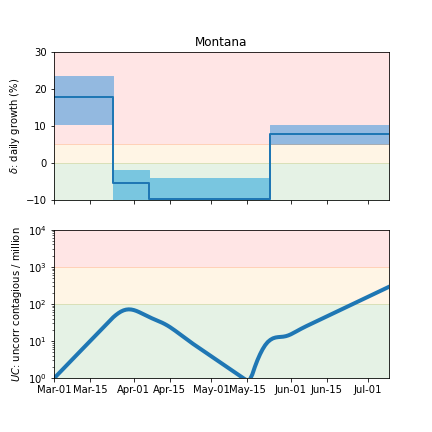
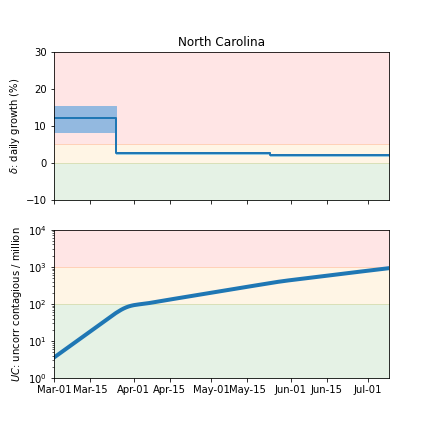
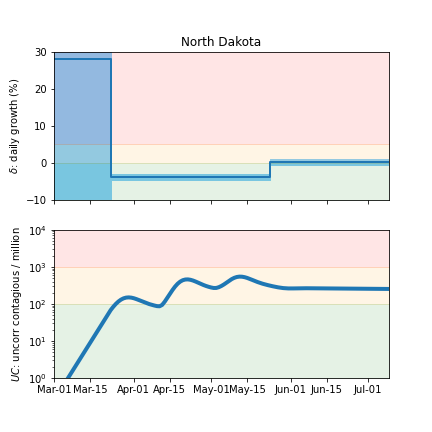
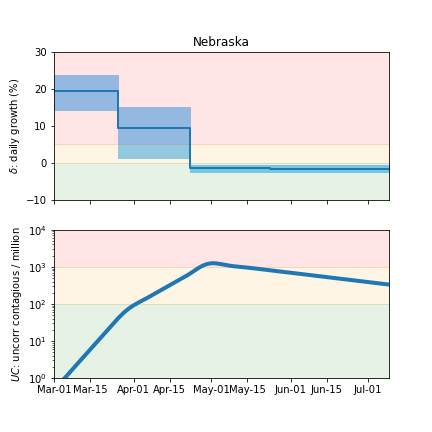
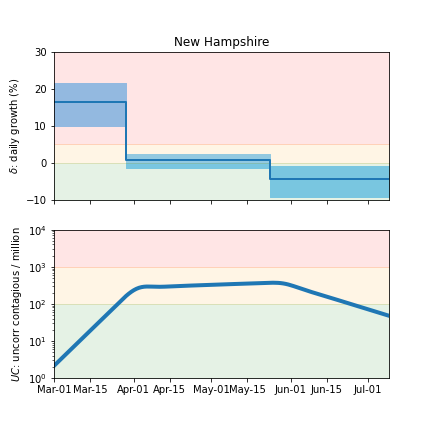
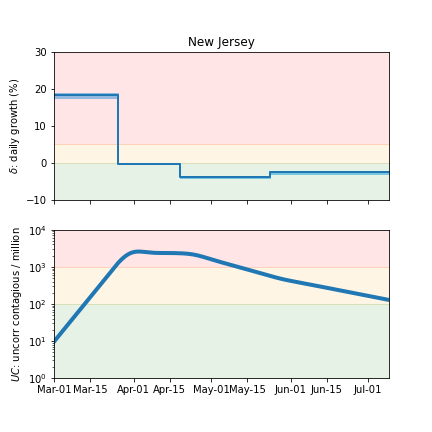
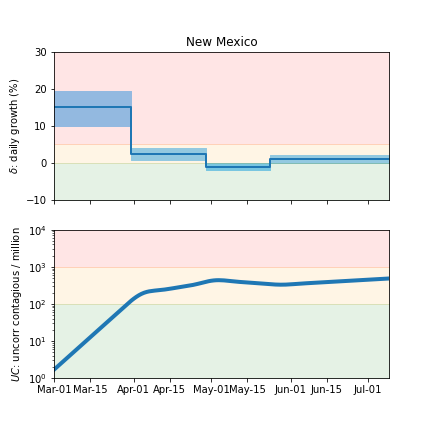
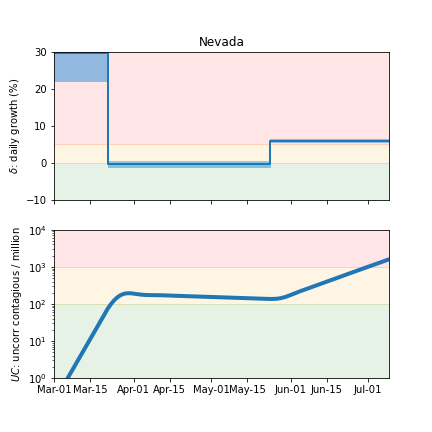
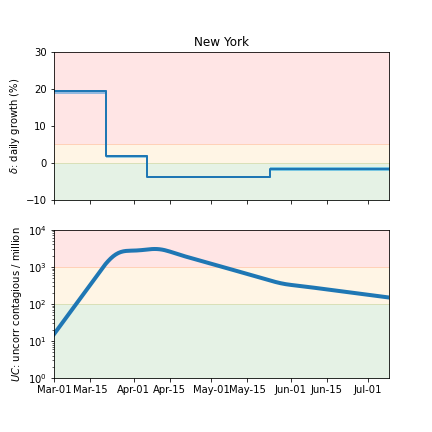
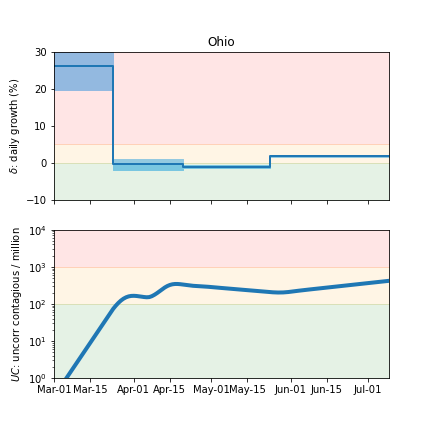
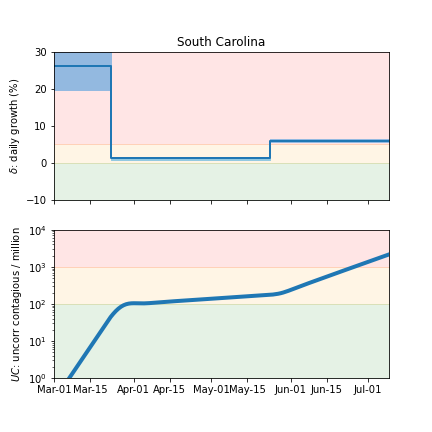
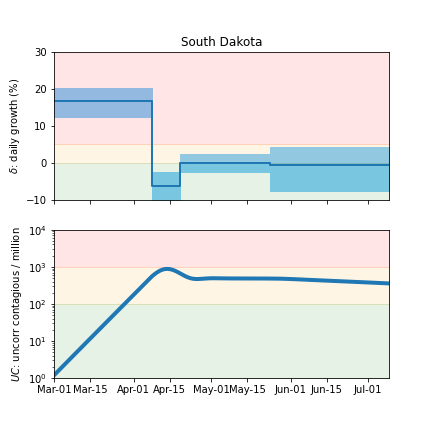
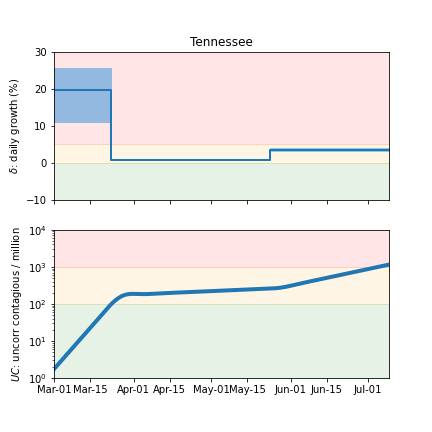
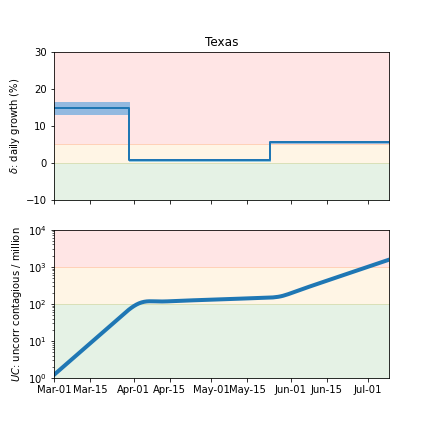
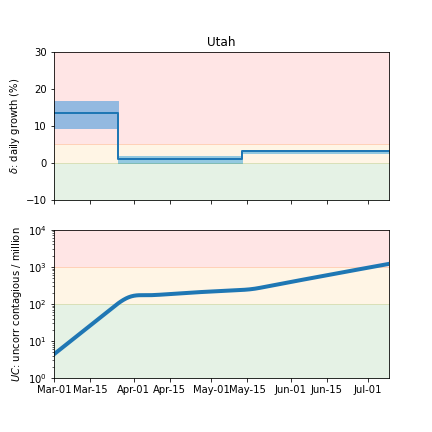
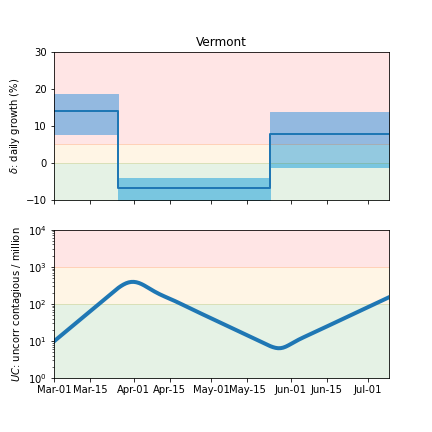
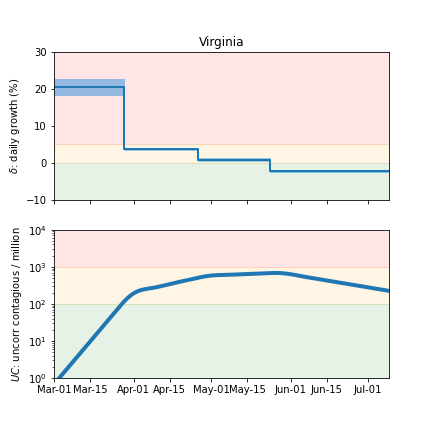
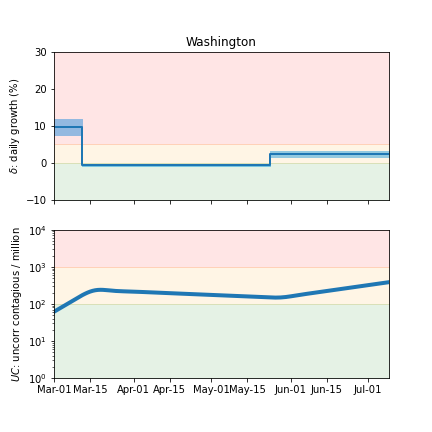
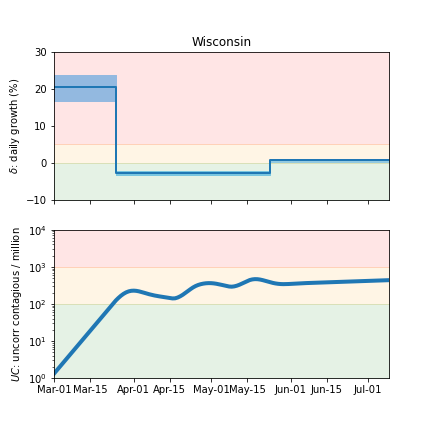
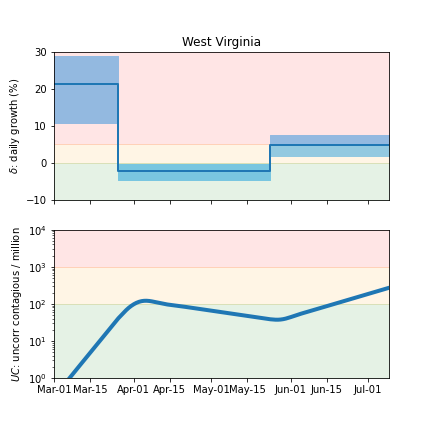
Infection status
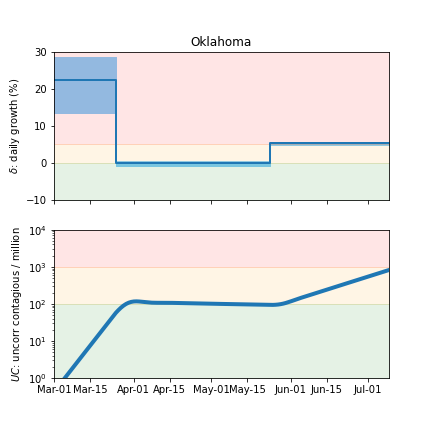
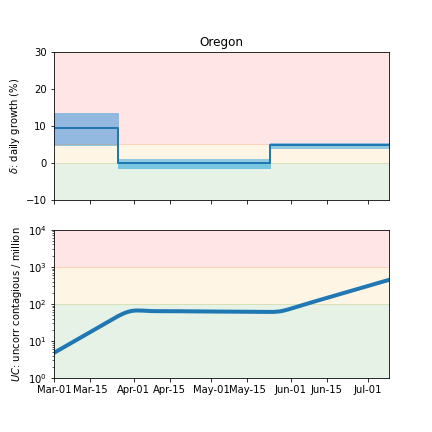
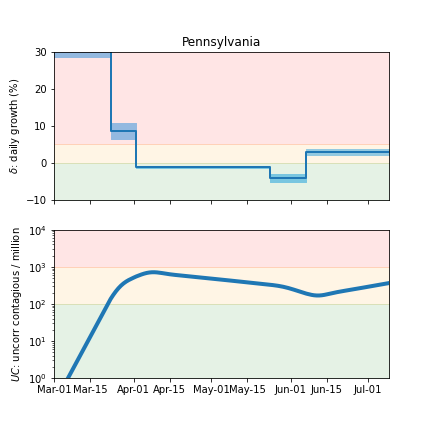
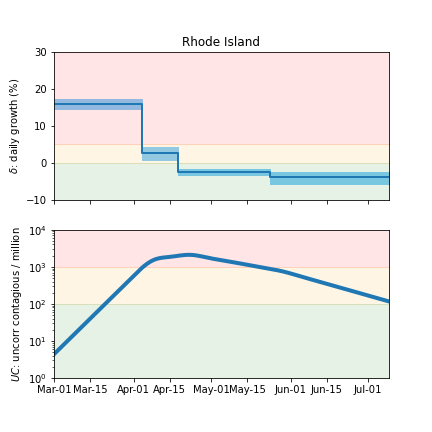
The following plots summarize the infection history. The upper plot shows the daily growth/decline from the fit. Bands show approximate 95% CL intervals. The lower plot shows the size of the infection: the uncorrected circulating contagious population per million.
Alabama
Arkansas
Arizona
California
Colorado
Connecticut
District Of Columbia
Delaware
Florida
Georgia
Hawaii
Iowa
Idaho
Illinois
Indiana
Kansas
Kentucky
Louisiana
Massachusetts
Maryland
Maine
Michigan
Minnesota
Missouri
Mississippi
Montana
North Carolina
North Dakota
Nebraska
New Hampshire
New Jersey
New Mexico
Nevada
New York
Ohio
Oklahoma
Oregon
Pennsylvania
Rhode Island
South Carolina
South Dakota
Tennessee
Texas
Utah
Vermont
Virginia
Washington
Wisconsin
West Virginia
Wyoming