May 21-25, 2020 Analysis of USA state data
As relaxation is getting underway, it is important to have a good fit to the data prior to the onset of changes due to relaxation.
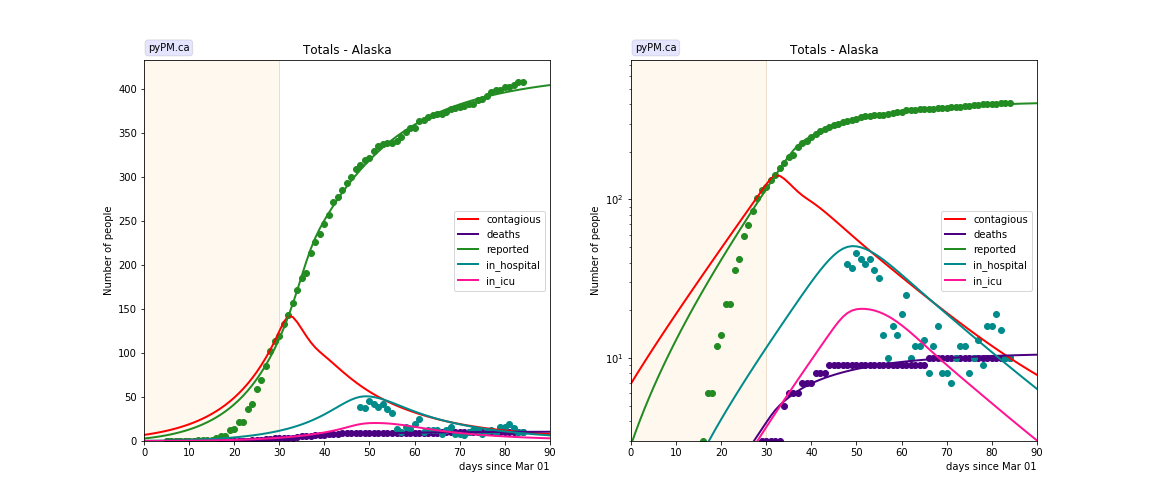
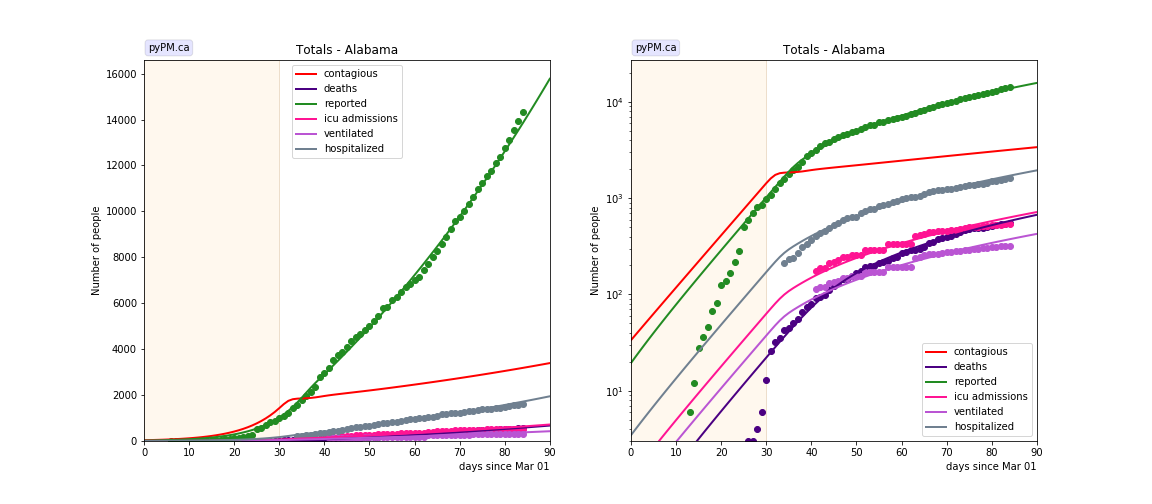
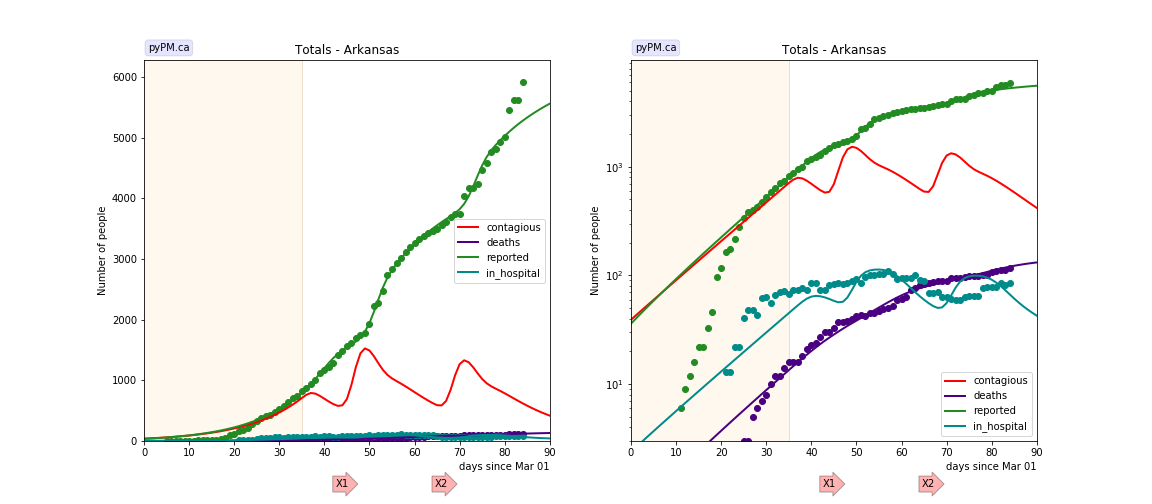
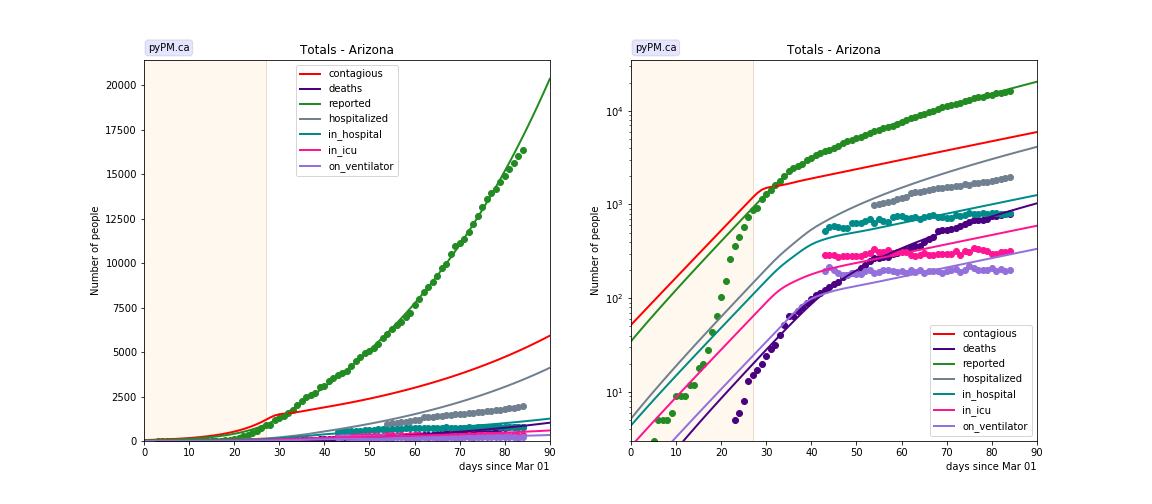
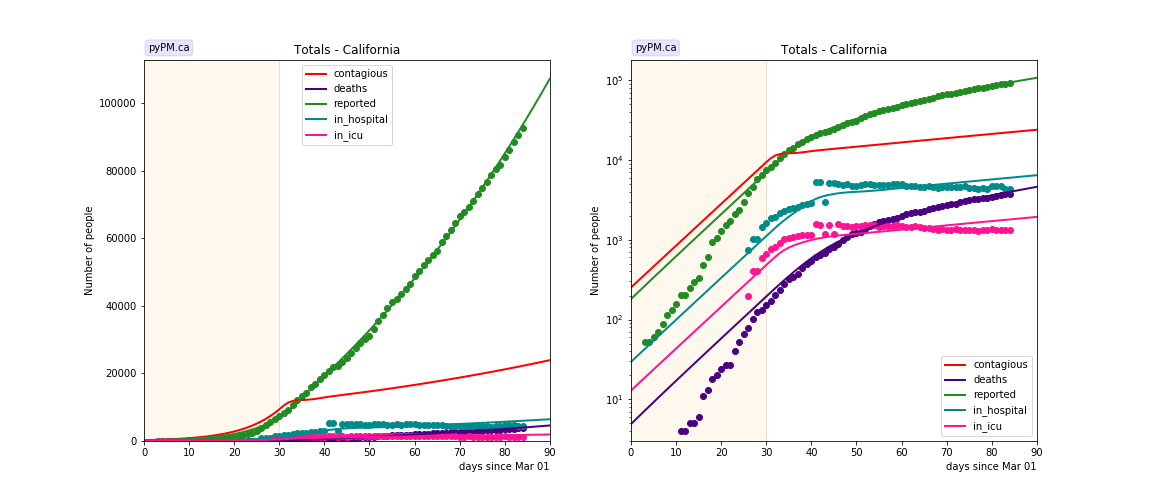
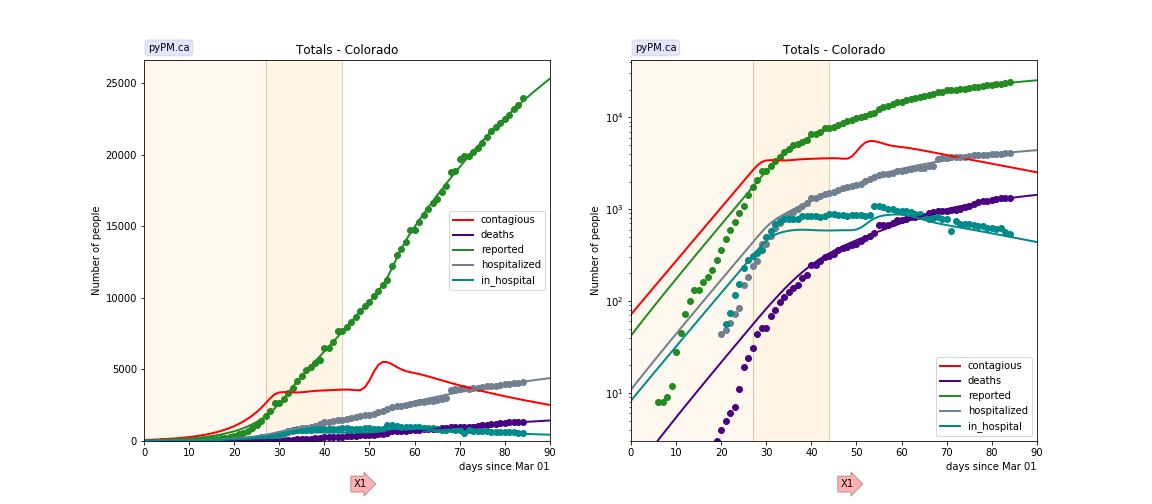
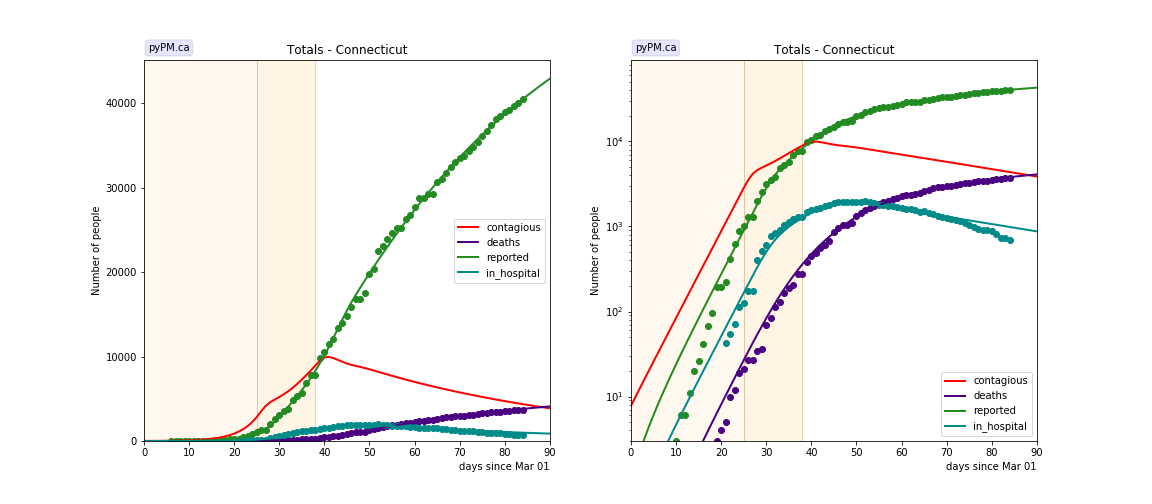
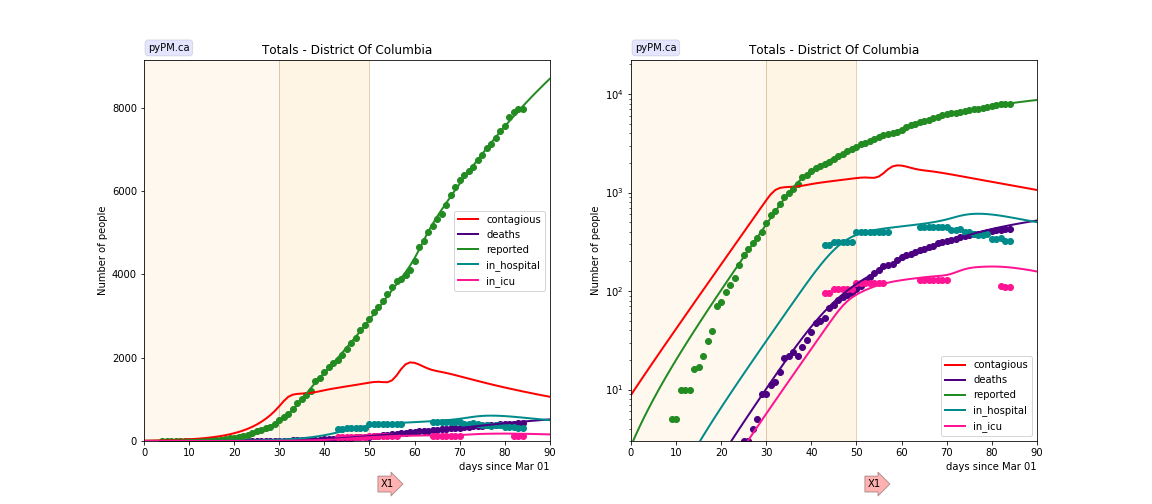
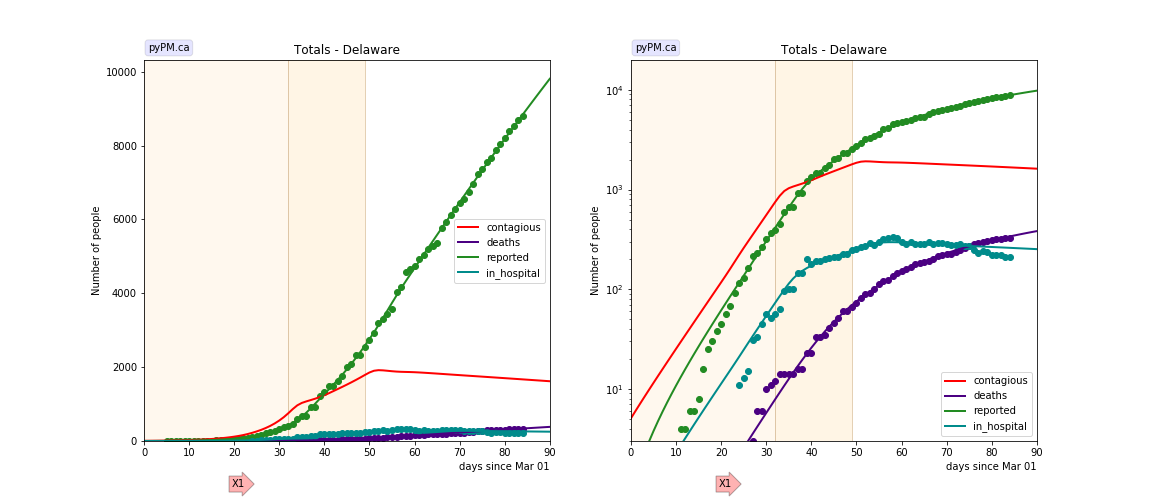
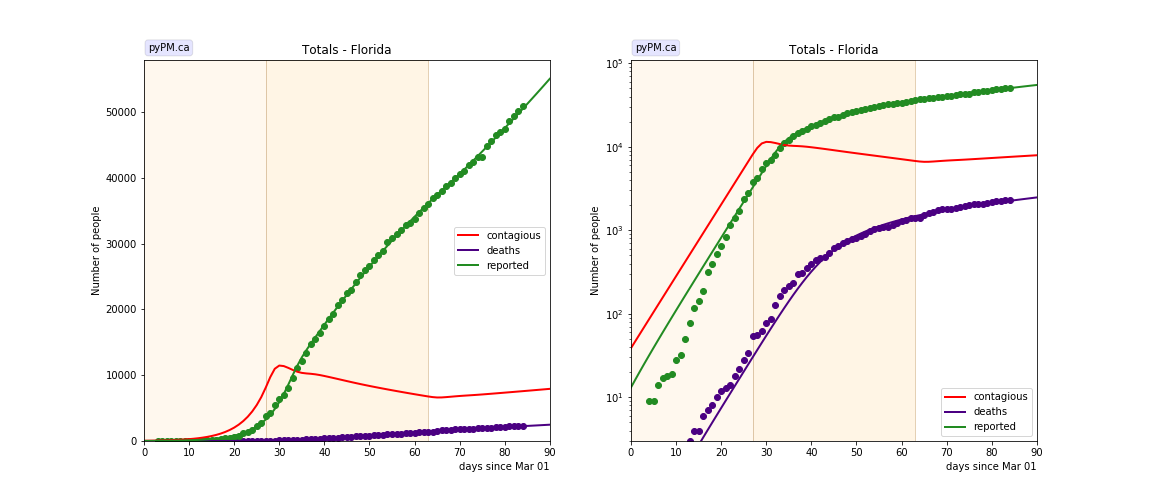
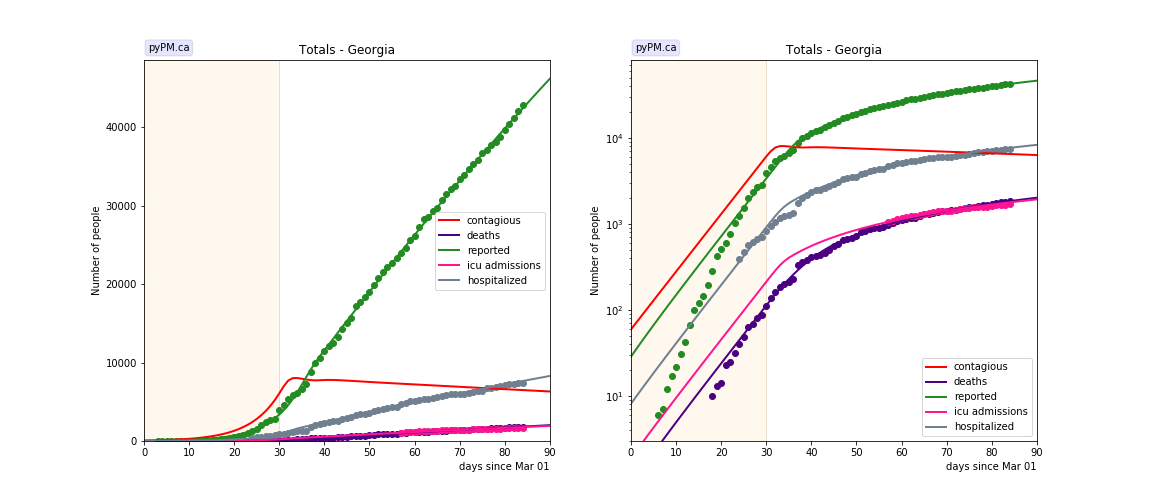
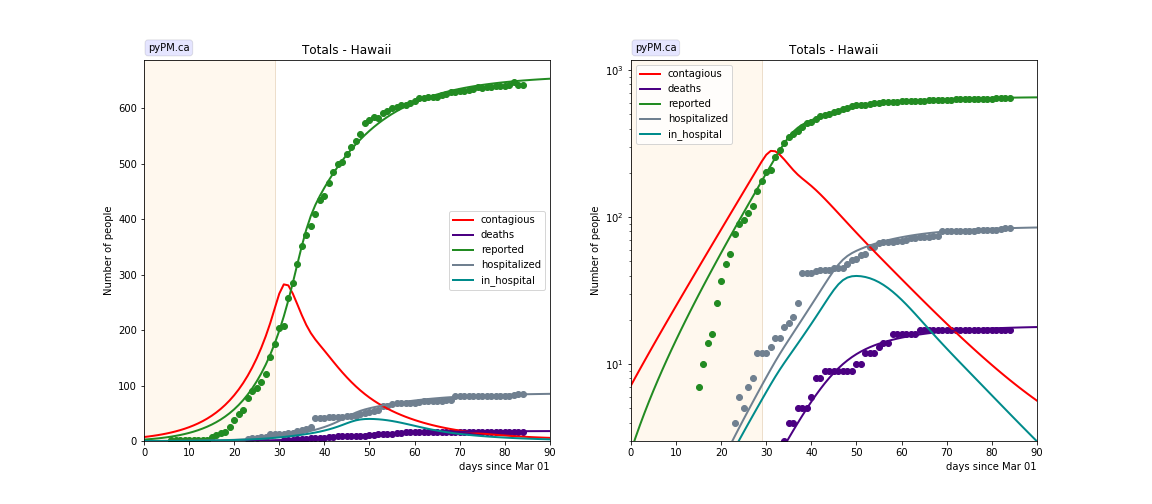
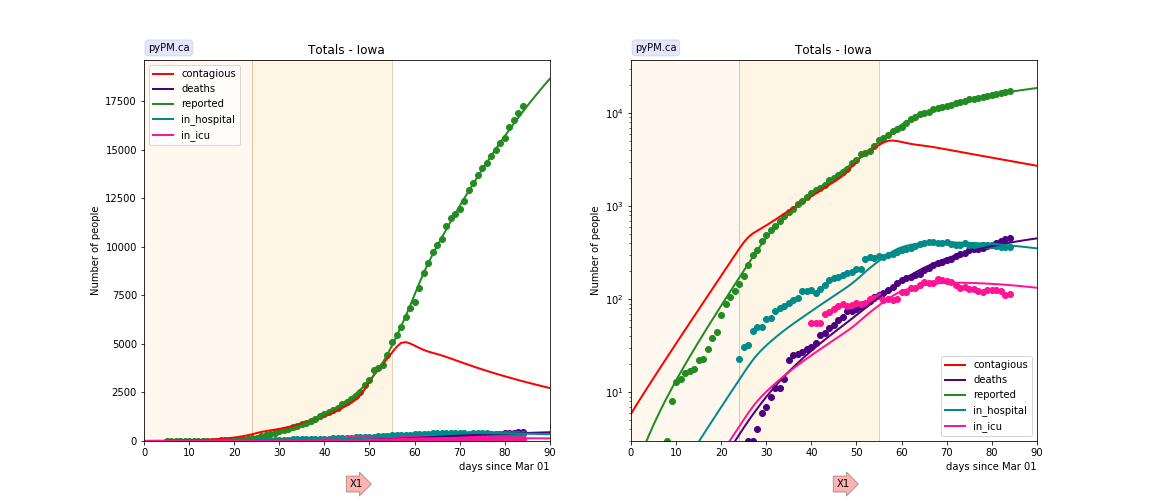
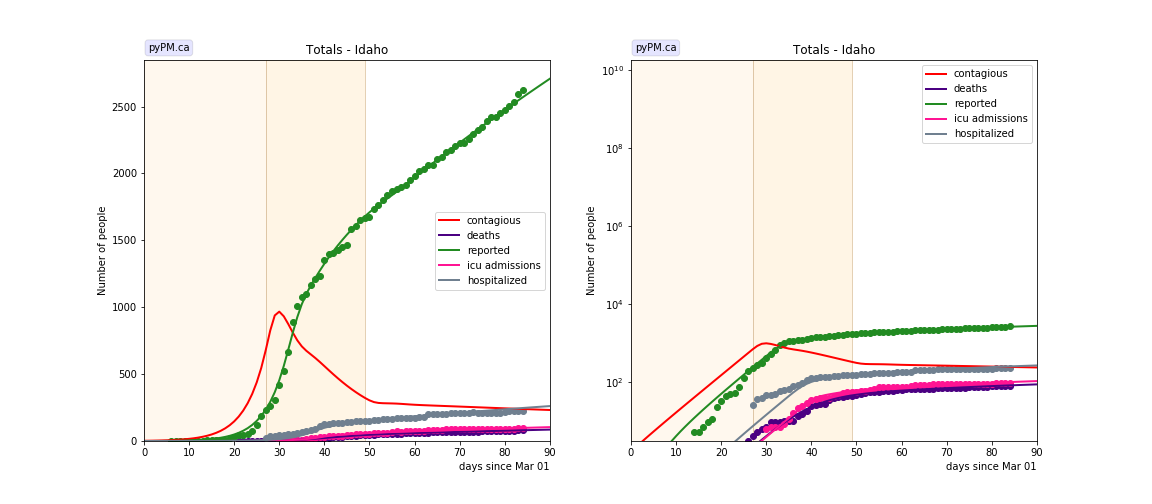
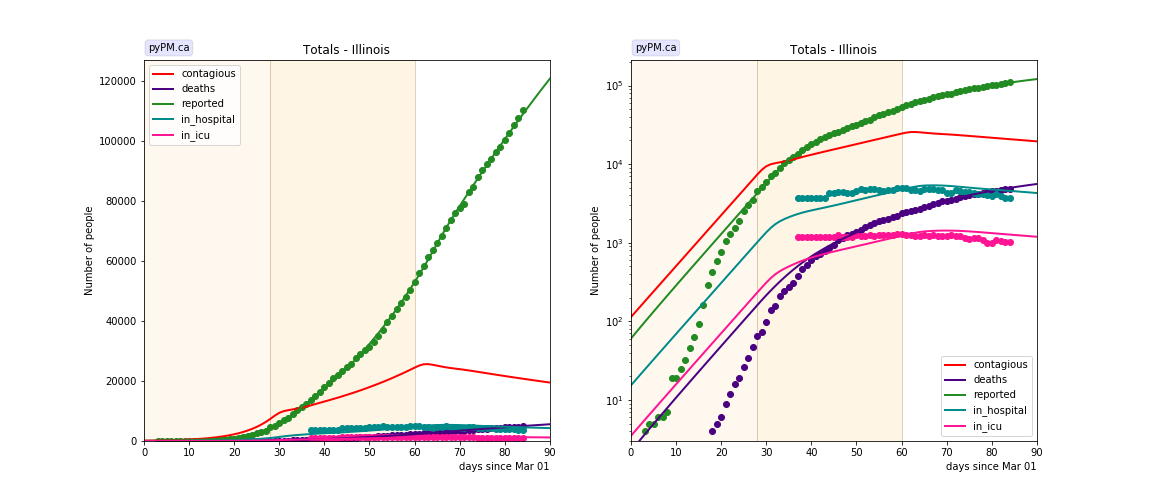
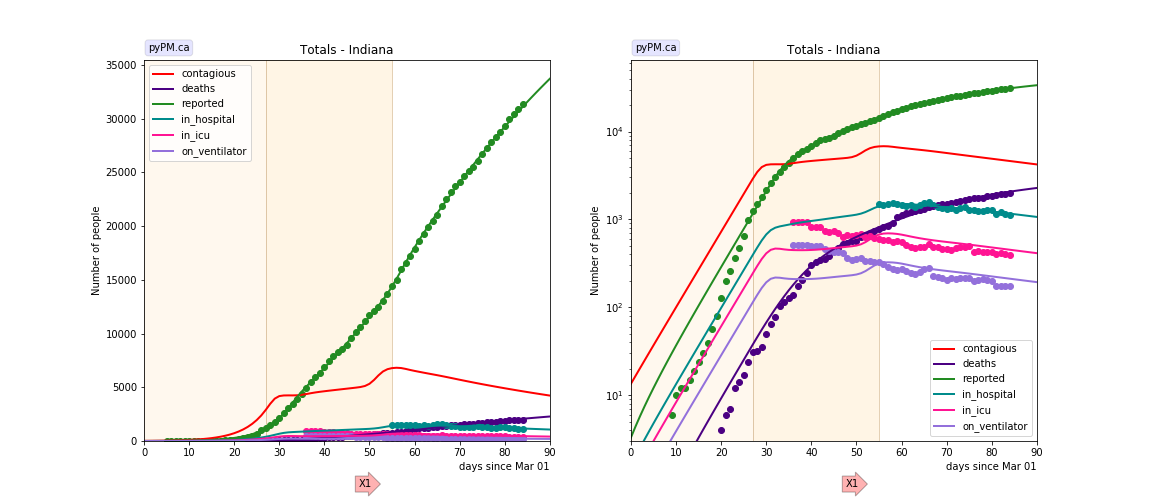
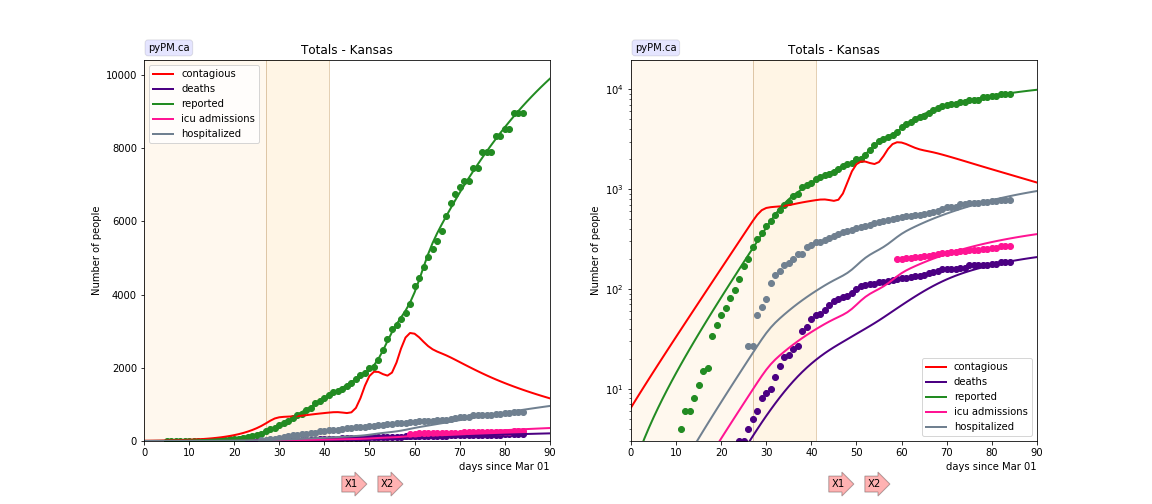
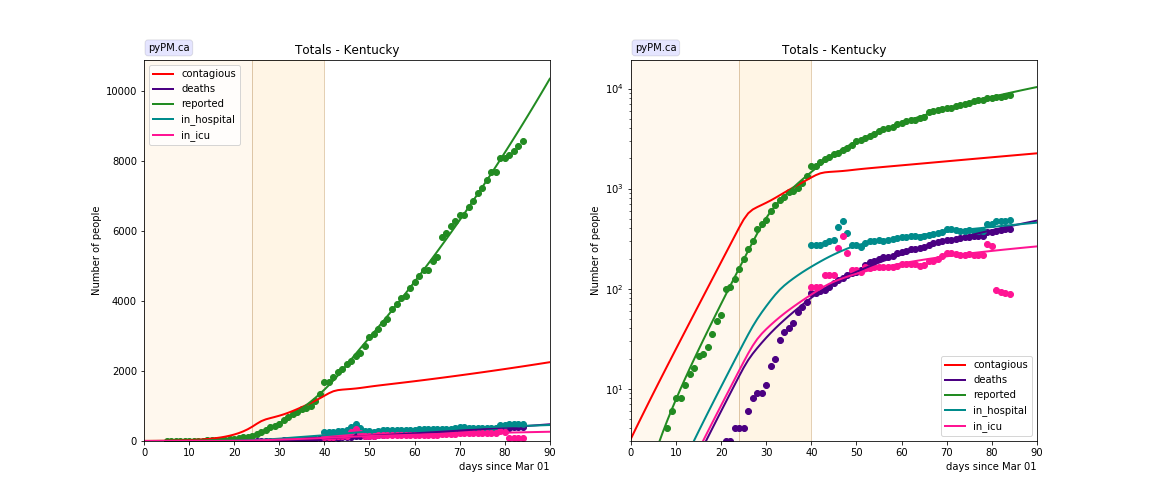
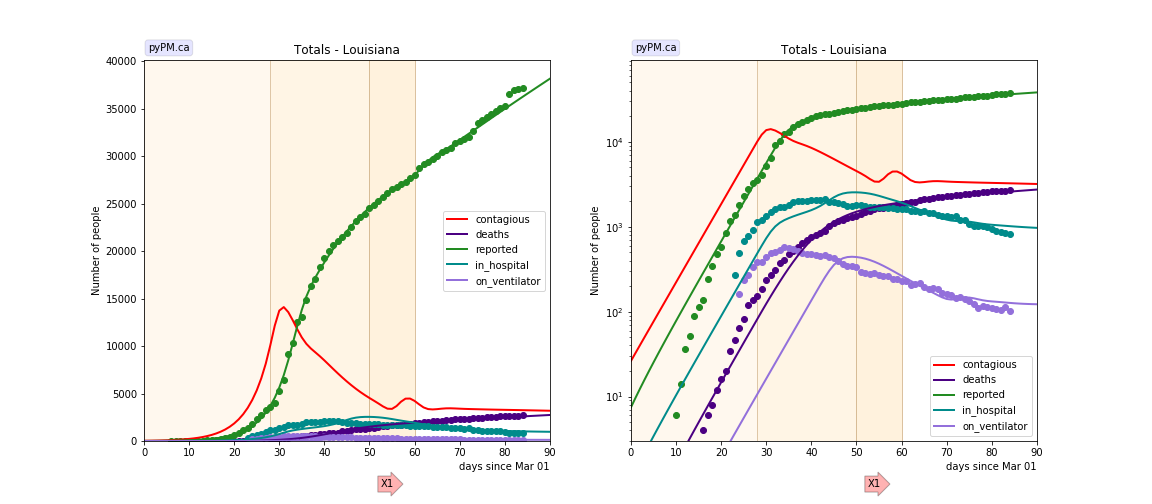
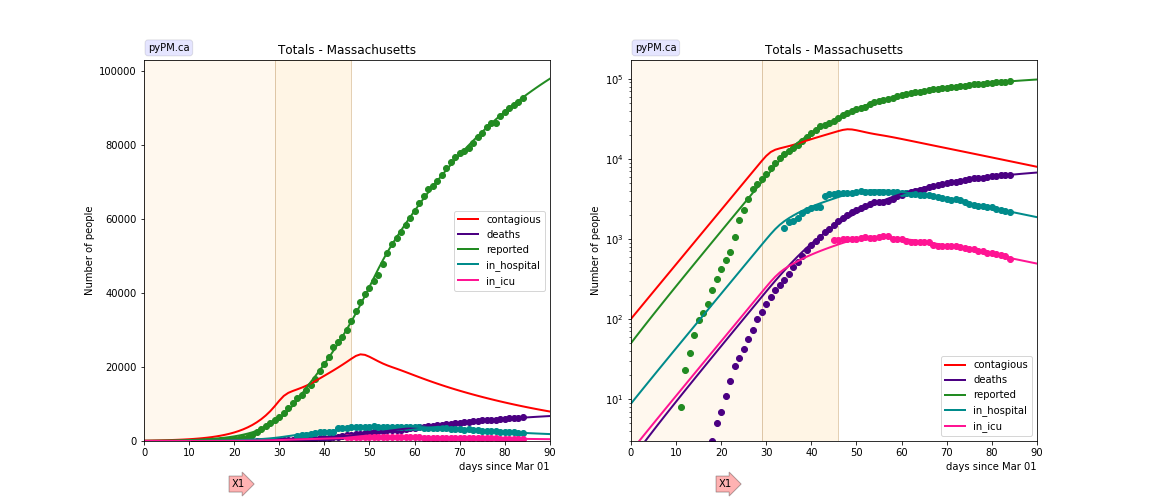
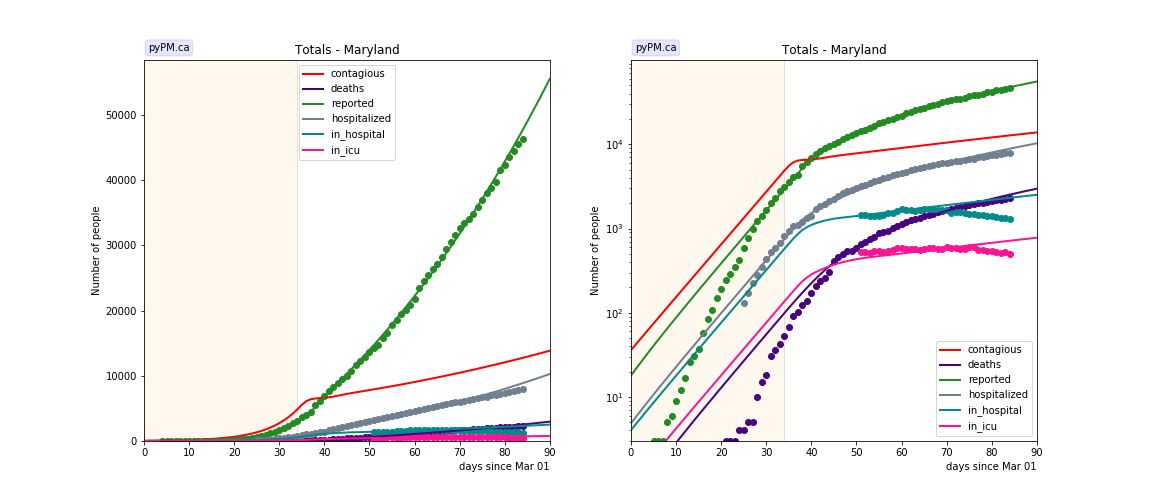
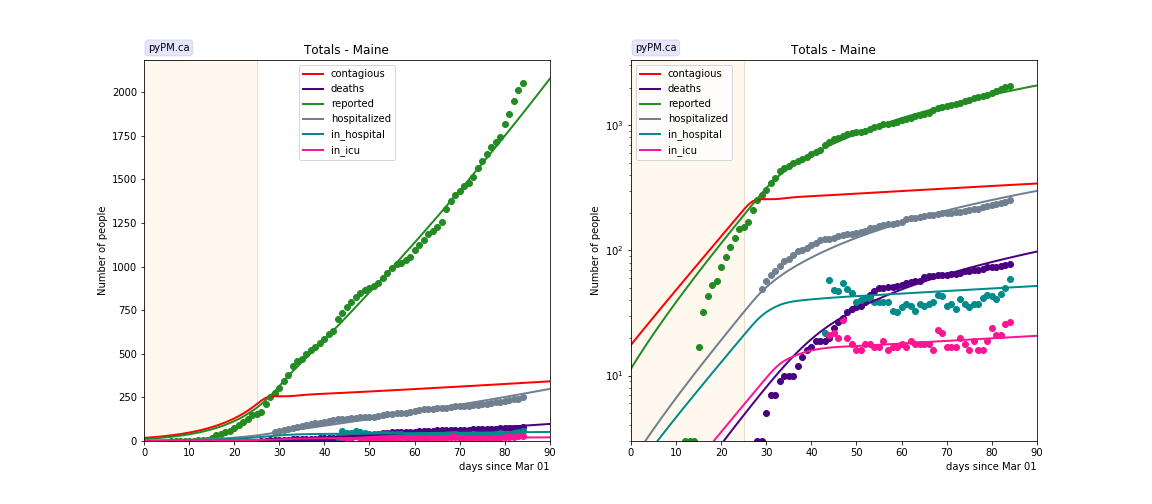
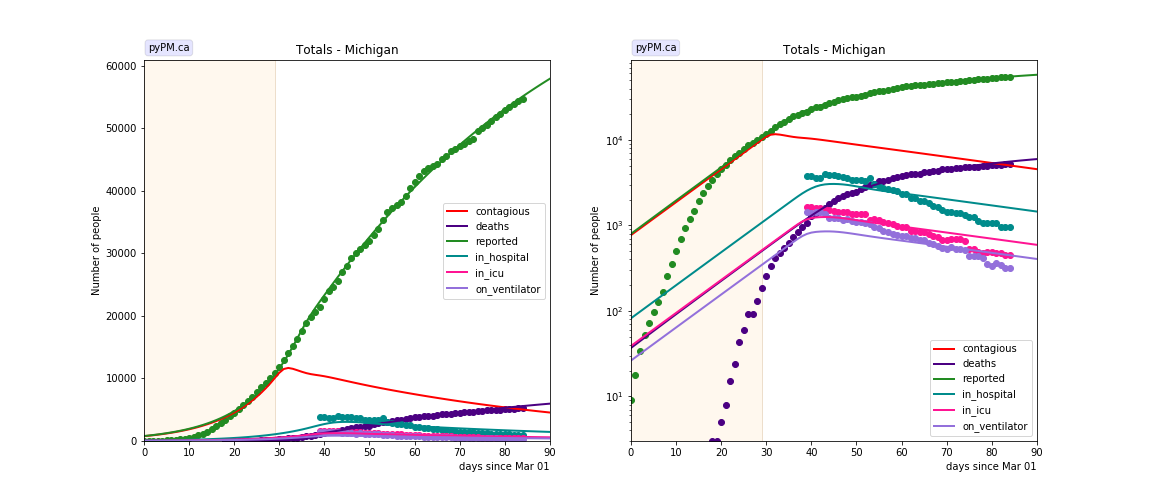
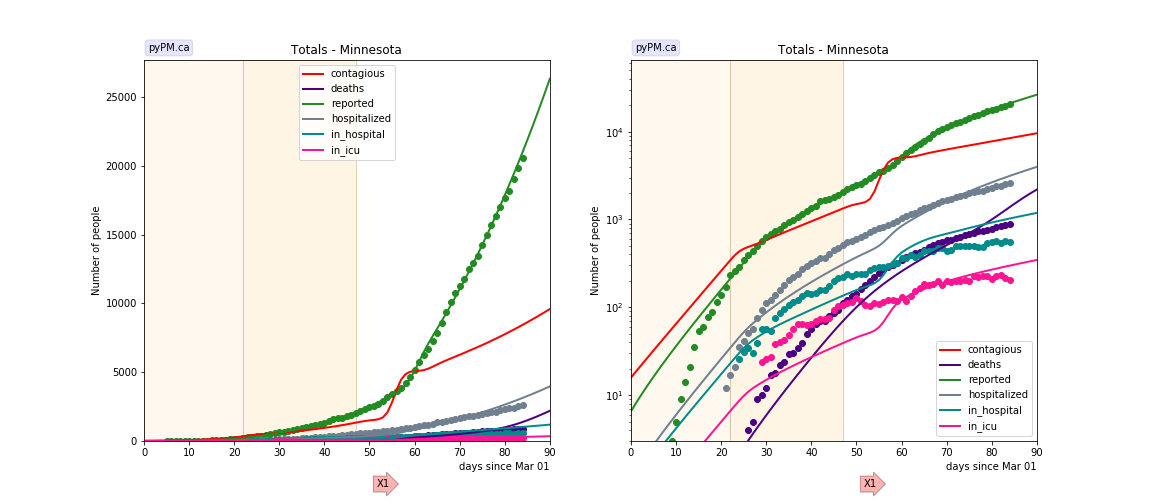
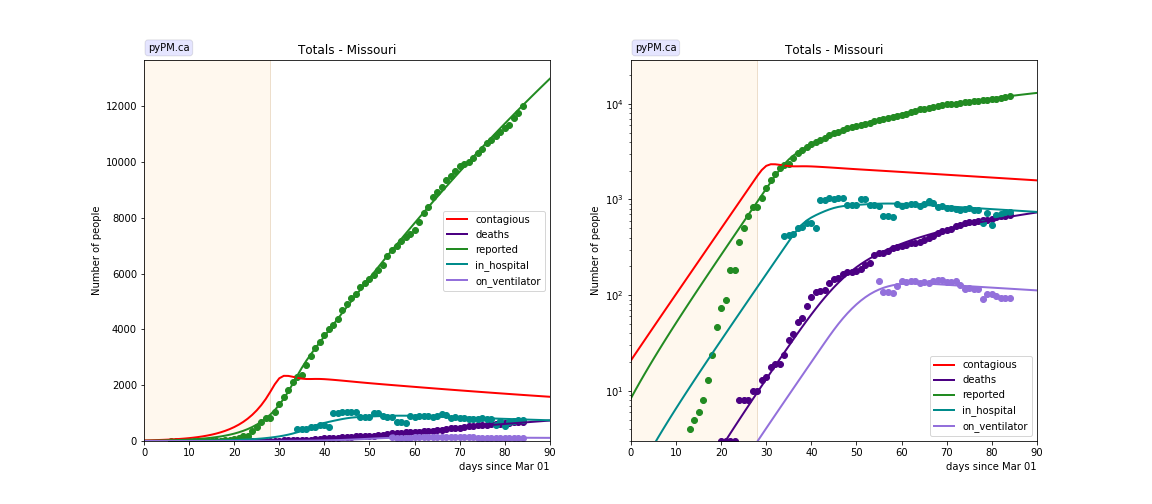
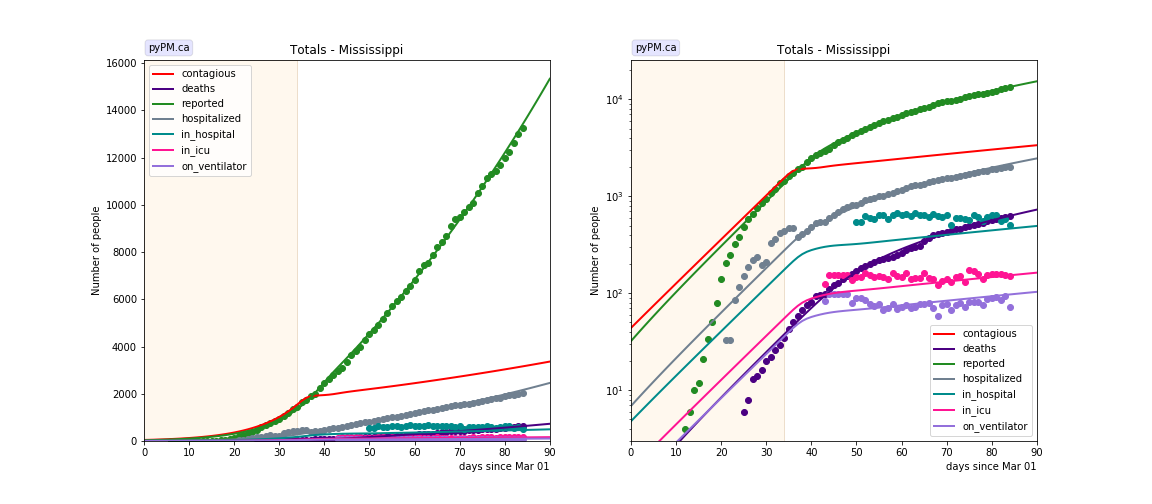
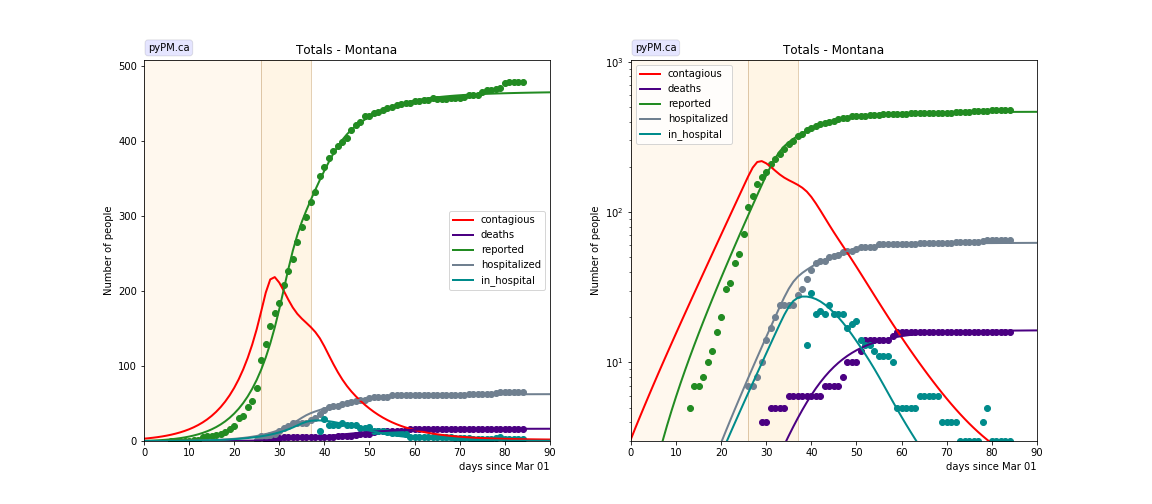
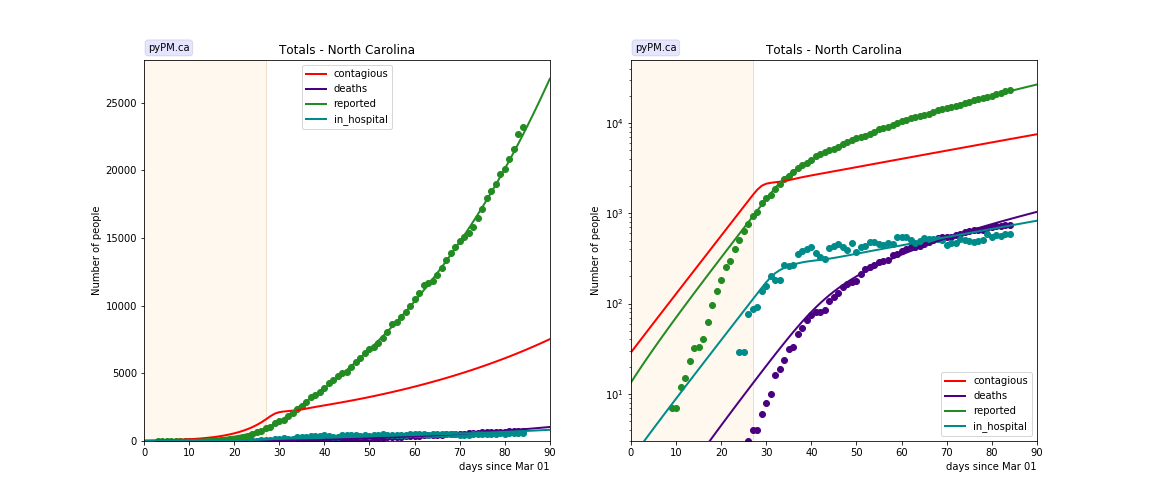
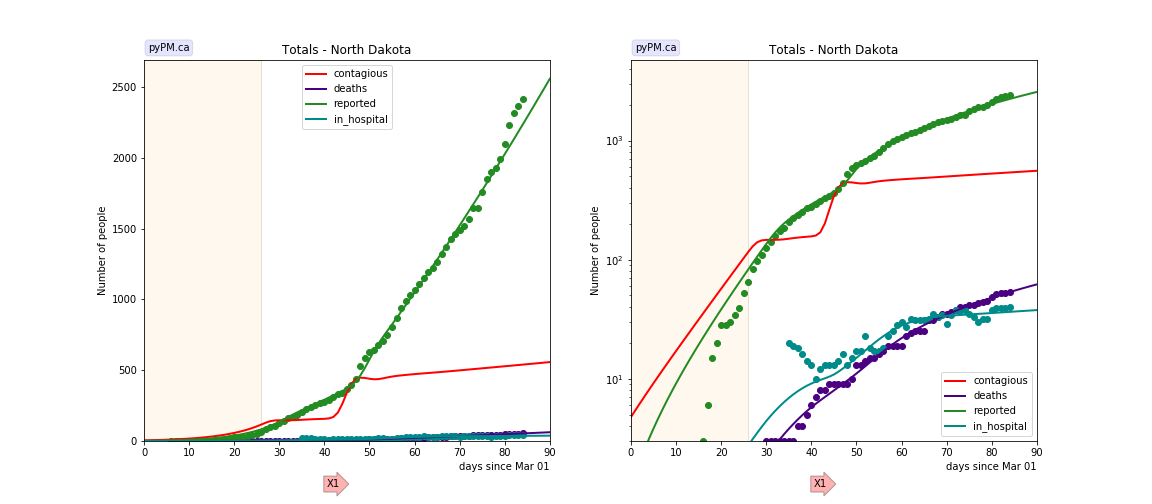
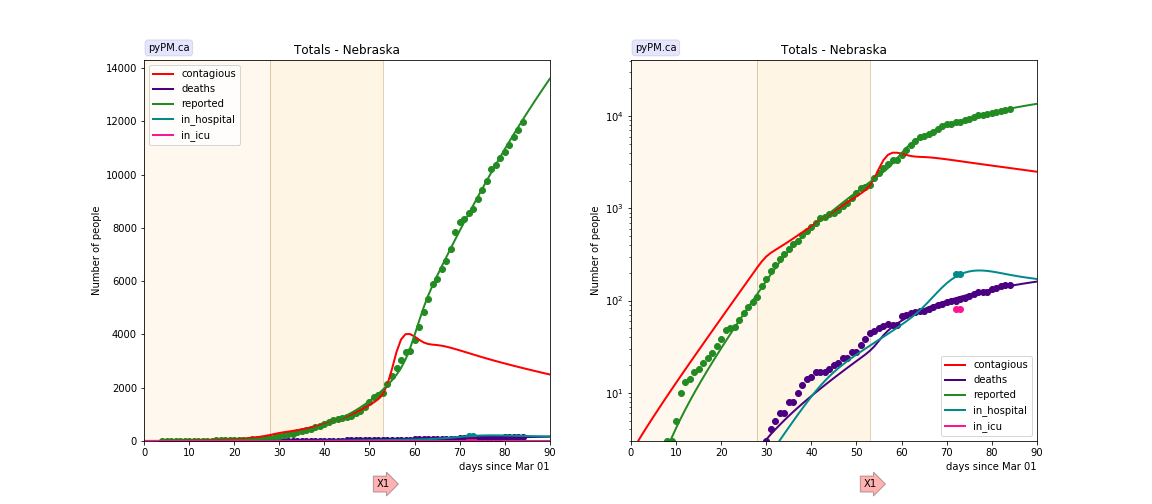
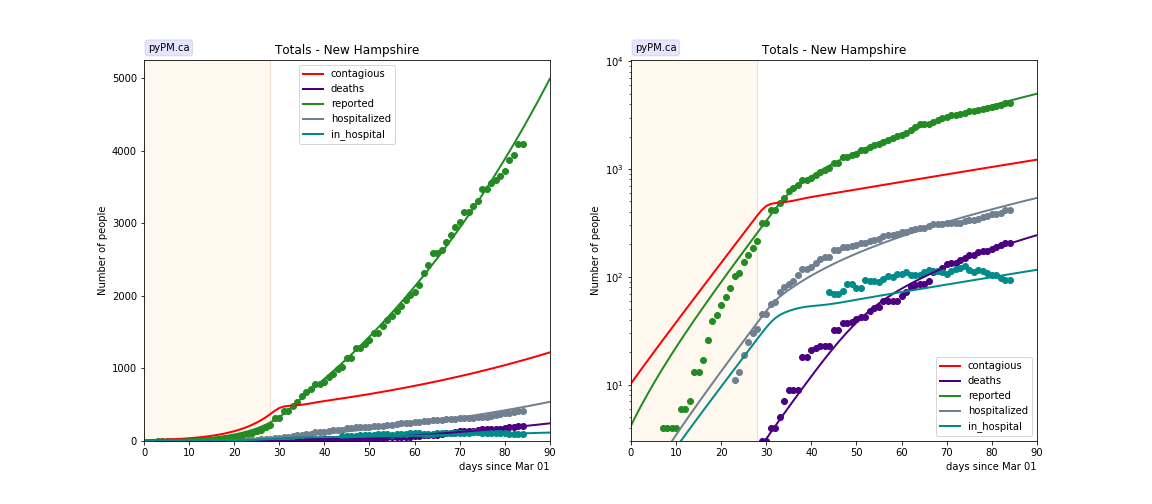
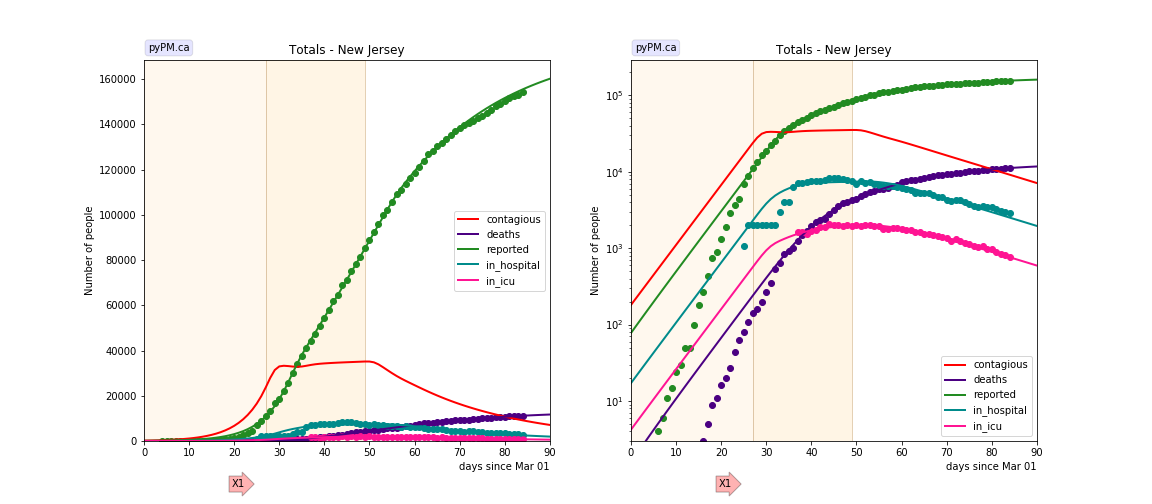
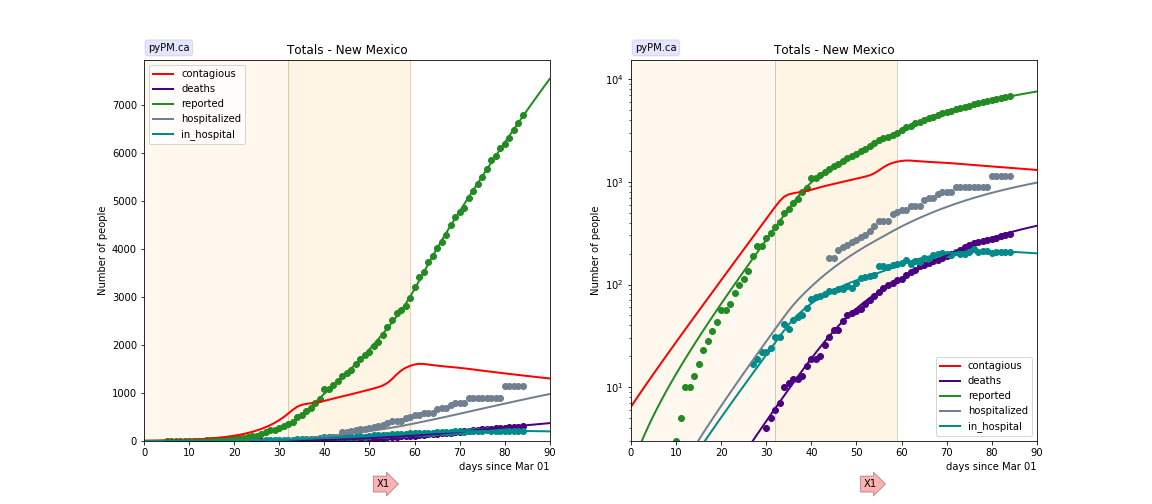
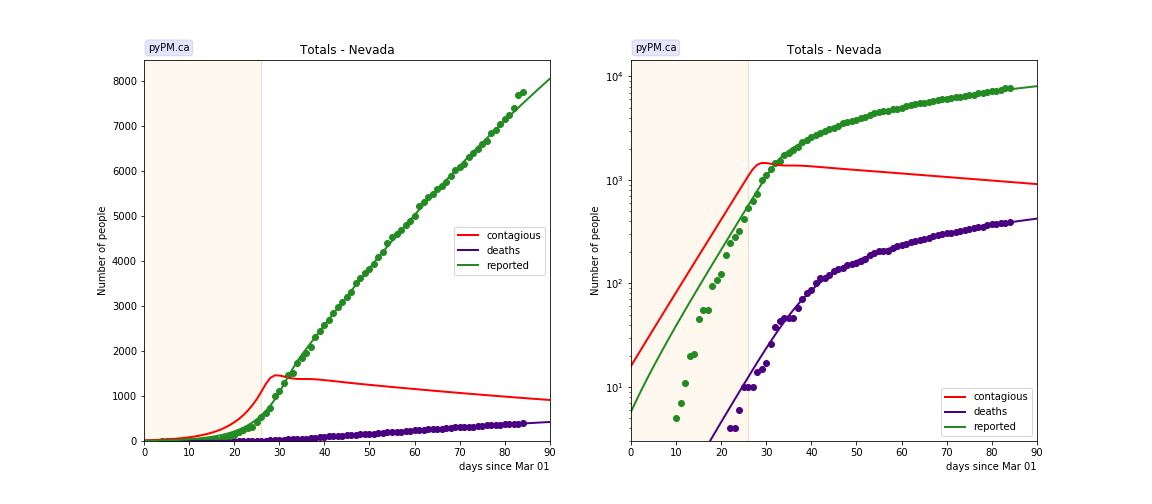
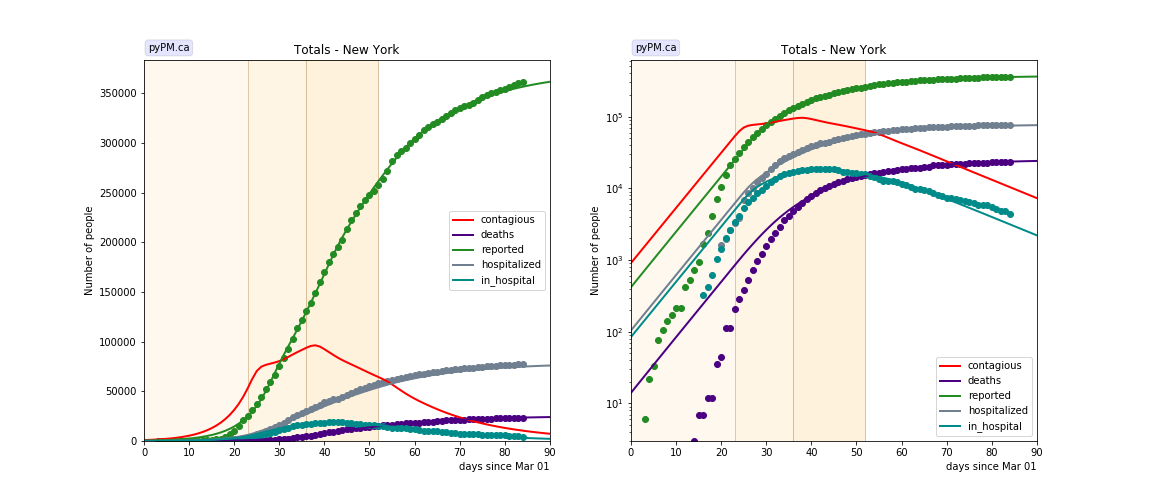
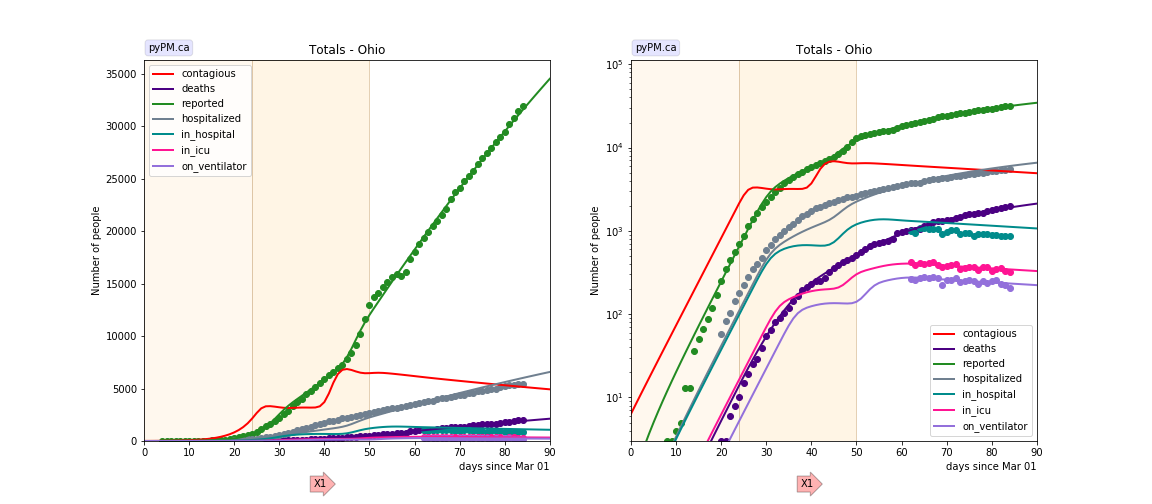
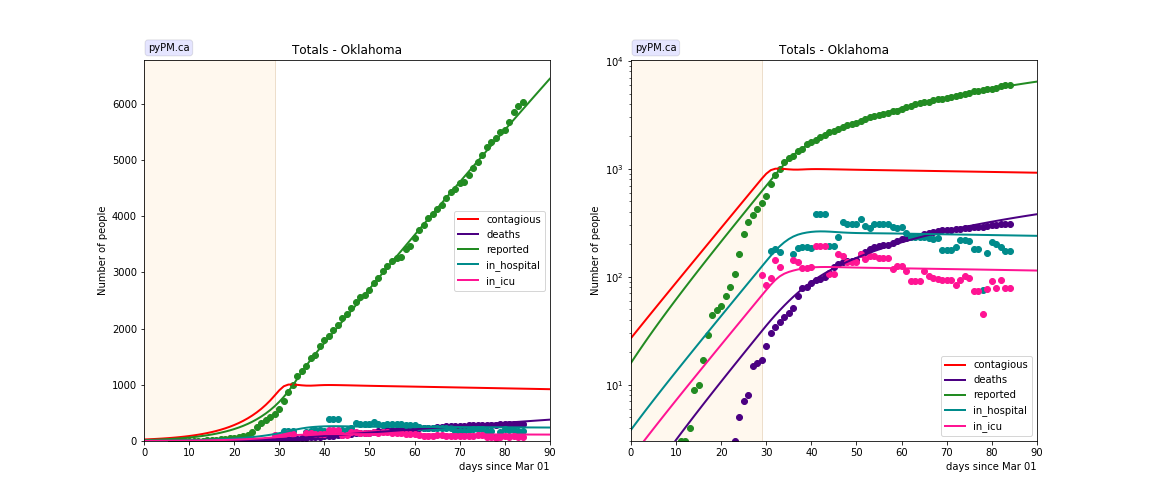
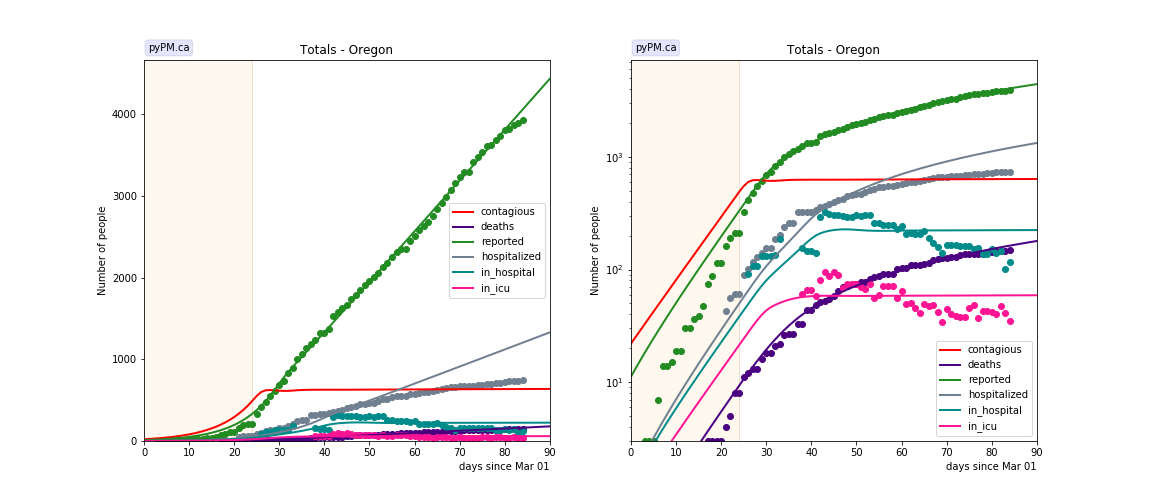
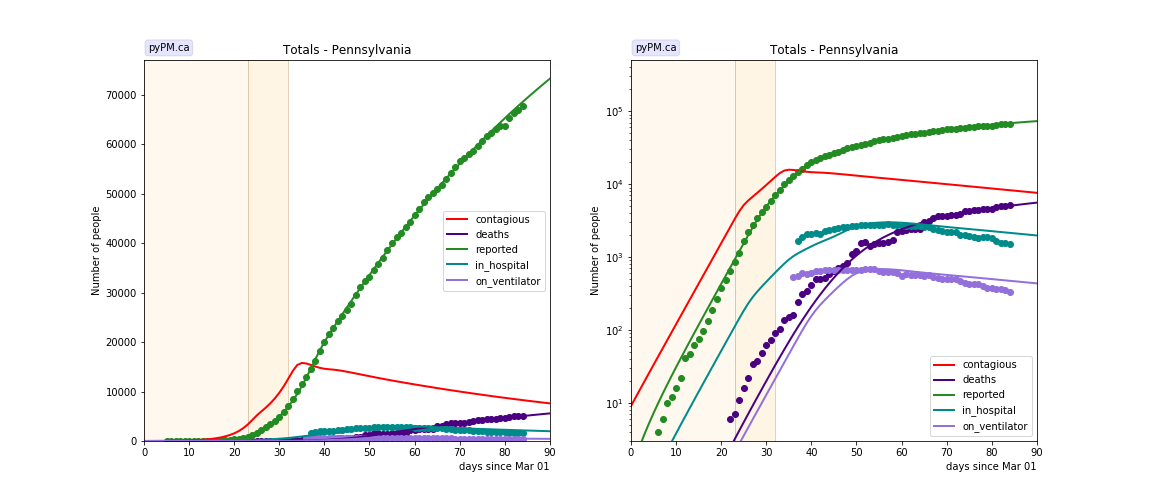
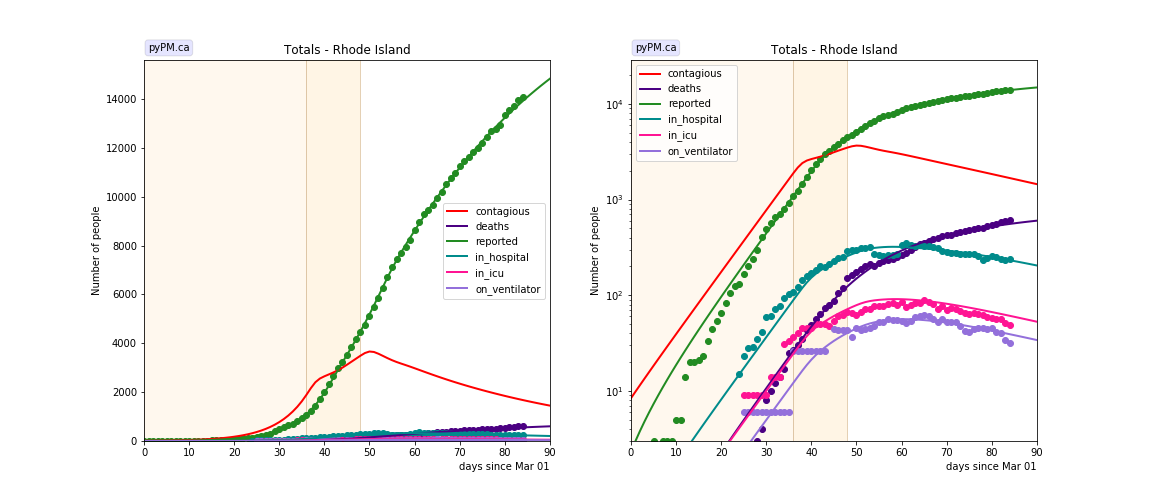
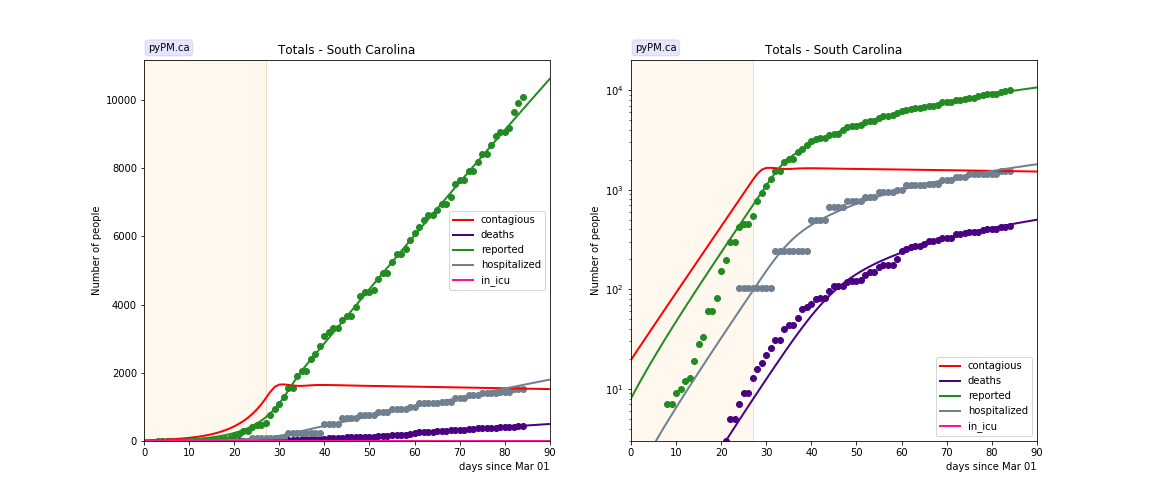
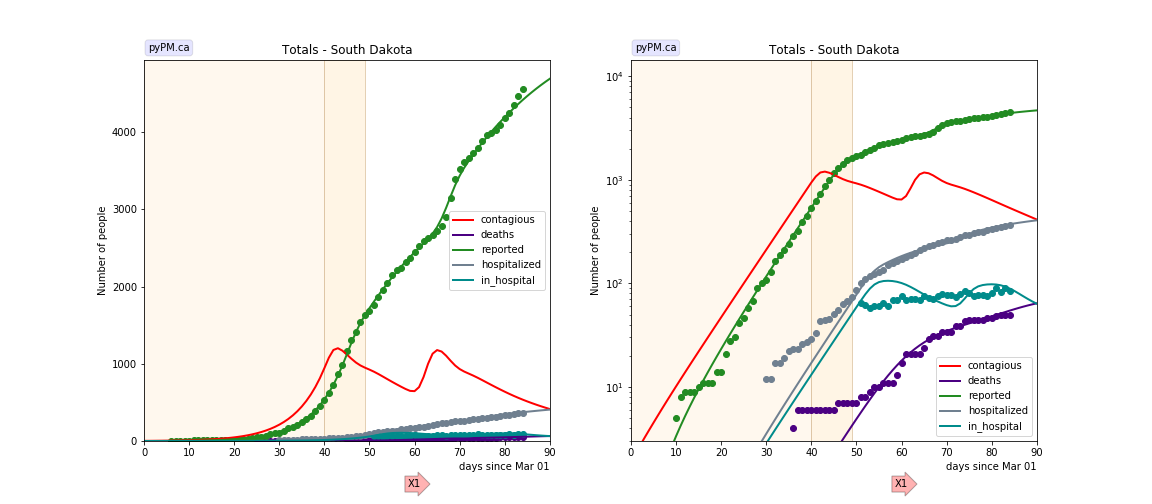
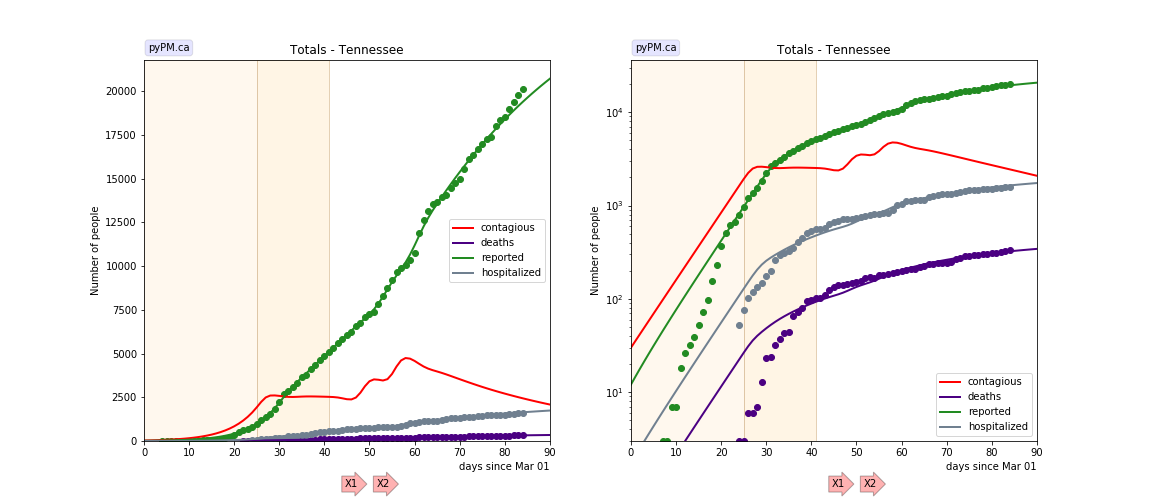
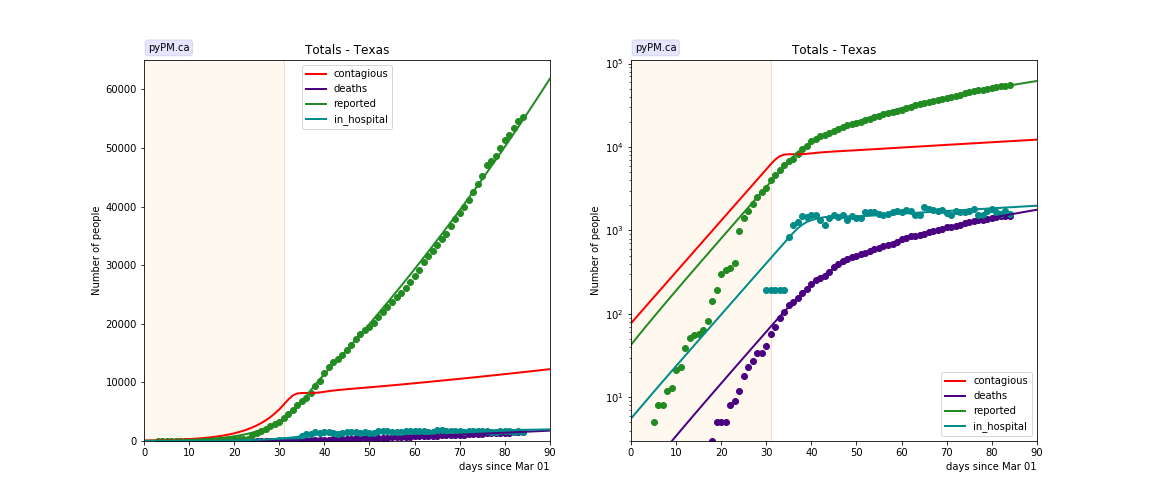
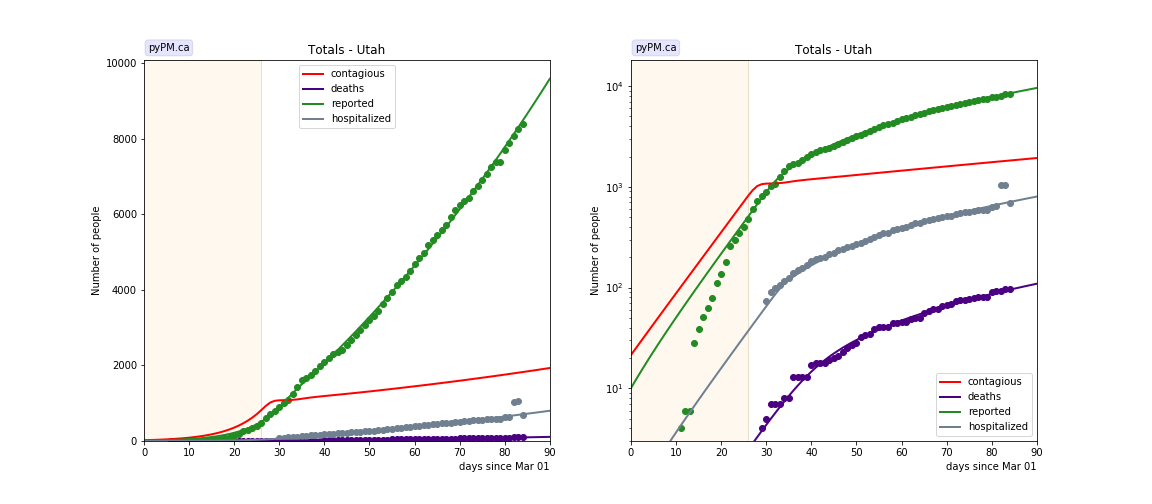
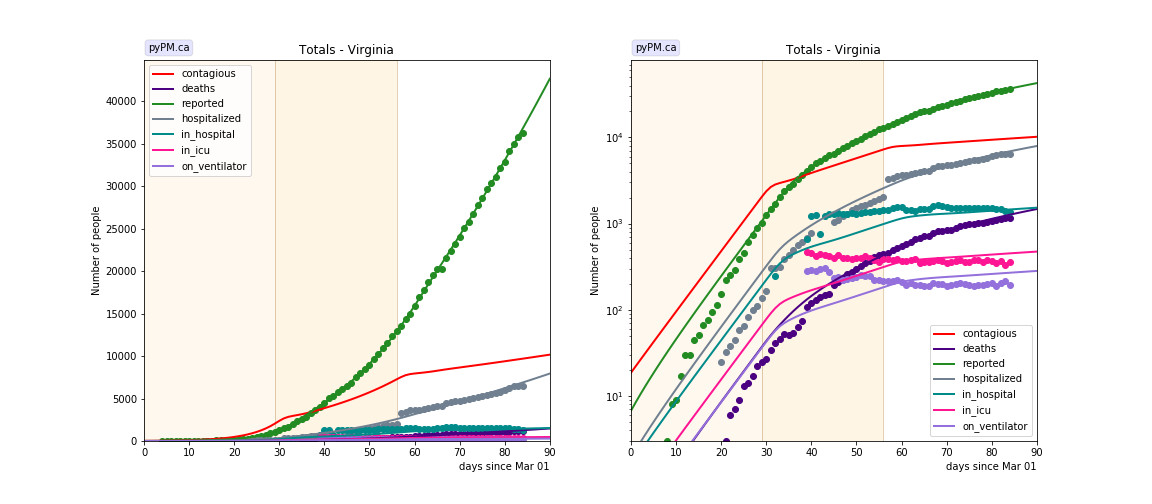
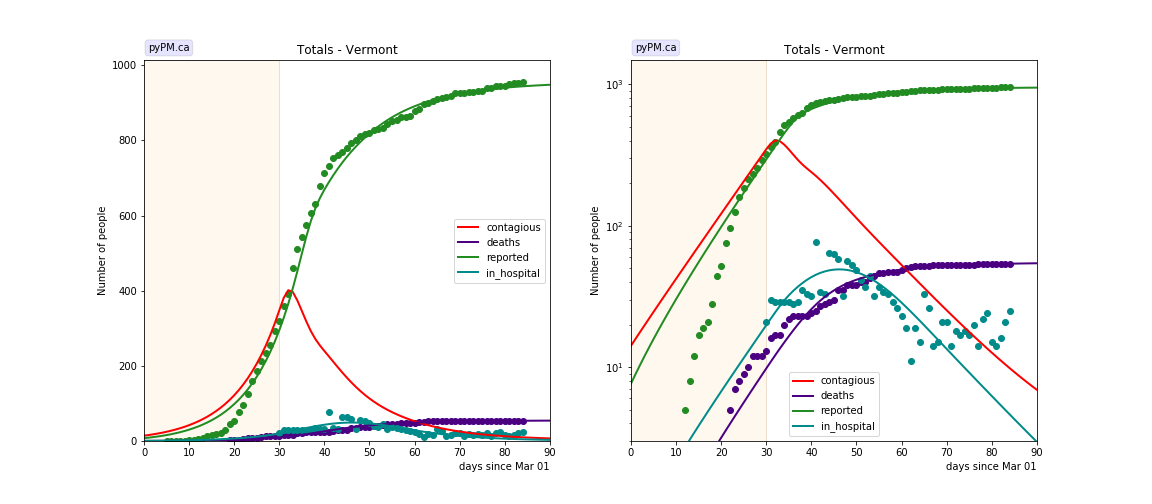
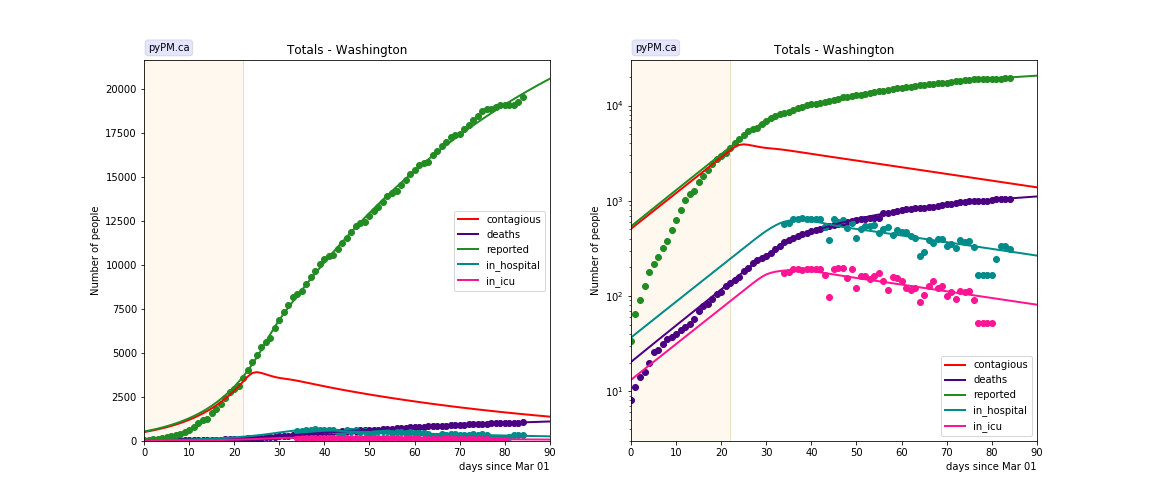
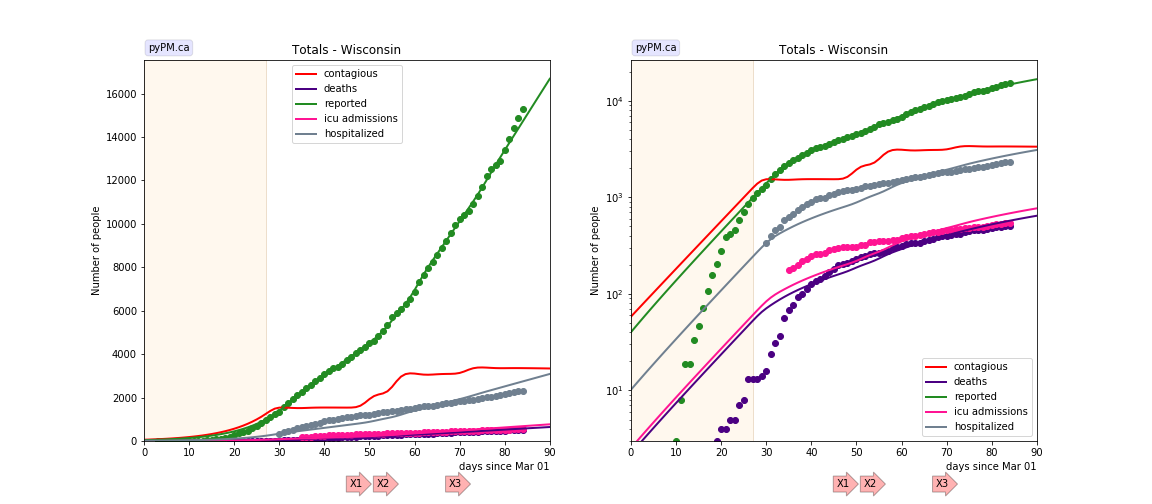
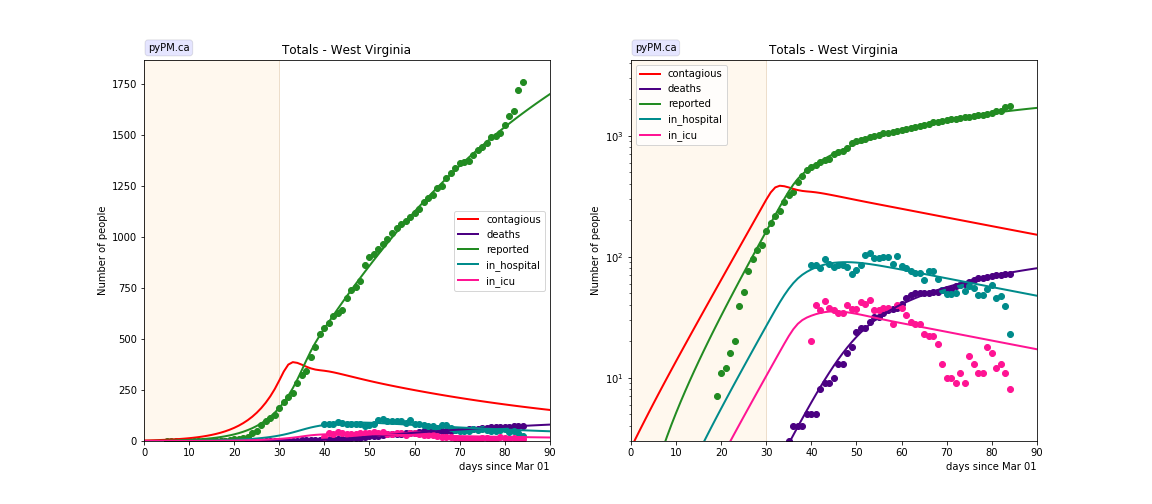
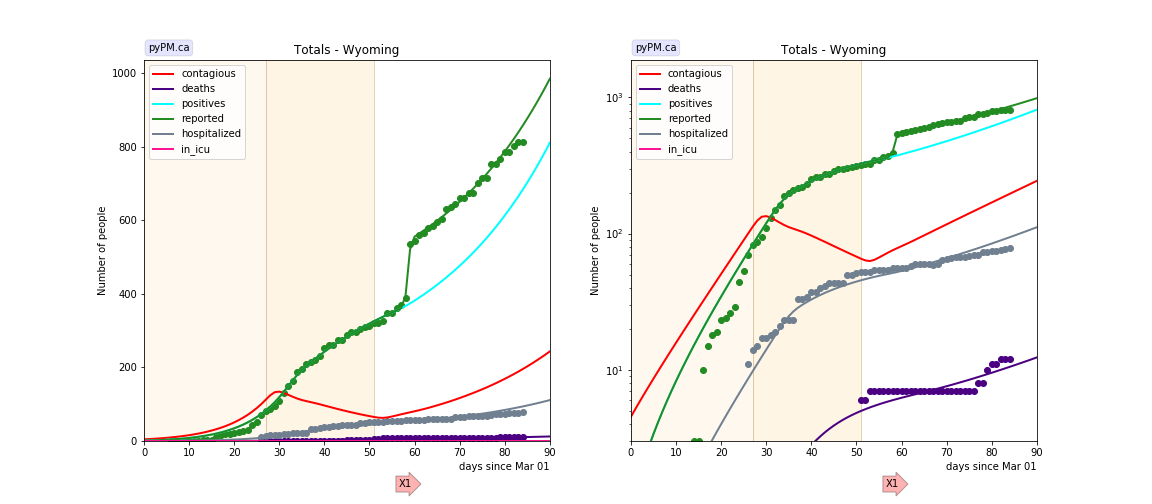
Below shows the case / hospitalization / deaths data for all 50 states and DC. The infection trajectory is determined by fits to the cumulative case data. Confirmation is seen for most states: hospitalization data follows the same exponential growth/decay as the contagious population.
The red curves (contagious population) is the inferred contagious population. Its shape is determined from the case data. Its scale is not well known.
The data fits were done using data up until May 21. The plots show data up until May 25.
Alaska
Alabama
Arkansas
Arizona
California
Colorado
Connecticut
District Of Columbia
Delaware
Florida
Georgia
Hawaii
Iowa
Idaho
Illinois
Indiana
Kansas
Kentucky
Louisiana
Massachusetts
Maryland
Maine
Michigan
Minnesota
Missouri
Mississippi
Montana
North Carolina
North Dakota
Nebraska
New Hampshire
New Jersey
New Mexico
Nevada
New York
Ohio
Oklahoma
Oregon
Pennsylvania
Rhode Island
South Carolina
South Dakota
Tennessee
Texas
Utah
Virginia
Vermont
Washington
Wisconsin
West Virginia
Wyoming
Tables
The tables below are results from the fits to reference model 2.1. These are shown for purposes of comparison.
Reproduction numbers
| state | cont_0 | R_0 | t_1 | R_1 | t2 | R_2 | t3 | R_3 |
|---|---|---|---|---|---|---|---|---|
| AK | 6.9 | 1.86 | 30 | 0.62 | ||||
| AL | 33.5 | 2.26 | 30 | 1.09 | ||||
| AR | 39.1 | 1.75 | 35 | 0.59 | ||||
| AZ | 51.9 | 2.14 | 27 | 1.18 | ||||
| CA | 252.4 | 2.21 | 30 | 1.10 | ||||
| CO | 71.4 | 2.38 | 27 | 1.03 | 44 | 0.85 | ||
| CT | 7.8 | 4.04 | 25 | 1.61 | 38 | 0.87 | ||
| DC | 8.8 | 2.61 | 30 | 1.11 | 50 | 0.88 | ||
| DE | 5.1 | 2.64 | 32 | 1.33 | 49 | 0.97 | ||
| FL | 38.8 | 3.36 | 27 | 0.88 | 63 | 1.06 | ||
| GA | 59.4 | 2.67 | 30 | 0.97 | ||||
| HI | 7.2 | 2.17 | 29 | 0.53 | ||||
| IA | 5.9 | 2.86 | 24 | 1.64 | 55 | 0.86 | ||
| ID | 1.6 | 3.74 | 27 | 0.61 | 49 | 0.96 | ||
| IL | 113.3 | 2.59 | 28 | 1.26 | 60 | 0.93 | ||
| IN | 13.5 | 3.36 | 27 | 1.08 | 55 | 0.90 | ||
| KS | 6.5 | 2.70 | 27 | 1.13 | 41 | 0.79 | ||
| KY | 3.2 | 3.38 | 24 | 1.50 | 40 | 1.07 | ||
| LA | 26.3 | 3.62 | 28 | 0.60 | 50 | 0.41 | 60 | 0.99 |
| MA | 100.5 | 2.70 | 29 | 1.33 | 46 | 0.83 | ||
| MD | 36.0 | 2.52 | 34 | 1.12 | ||||
| ME | 17.6 | 1.93 | 25 | 1.03 | ||||
| MI | 770.6 | 1.83 | 29 | 0.88 | ||||
| MN | 15.8 | 2.44 | 22 | 1.41 | 47 | 1.17 | ||
| MO | 20.9 | 2.72 | 28 | 0.95 | ||||
| MS | 43.9 | 2.01 | 34 | 1.09 | ||||
| MT | 3.1 | 2.58 | 26 | 0.67 | 37 | 0.36 | ||
| NC | 28.8 | 2.58 | 27 | 1.17 | ||||
| ND | 4.8 | 2.17 | 26 | 1.04 | ||||
| NE | 2.2 | 2.72 | 28 | 1.67 | 53 | 0.90 | ||
| NH | 10.2 | 2.28 | 28 | 1.13 | ||||
| NJ | 180.7 | 3.08 | 27 | 1.04 | 49 | 0.73 | ||
| NM | 6.5 | 2.43 | 32 | 1.19 | 59 | 0.94 | ||
| NV | 15.9 | 2.78 | 26 | 0.94 | ||||
| NY | 908.8 | 3.02 | 23 | 1.19 | 36 | 0.80 | 52 | 0.63 |
| OH | 6.4 | 4.17 | 24 | 0.97 | 50 | 0.95 | ||
| OK | 27.0 | 2.16 | 29 | 0.99 | ||||
| OR | 22.0 | 2.31 | 24 | 1.00 | ||||
| PA | 9.0 | 4.47 | 23 | 2.30 | 32 | 0.91 | ||
| RI | 8.4 | 2.59 | 36 | 1.29 | 48 | 0.84 | ||
| SC | 19.6 | 2.65 | 27 | 0.99 | ||||
| SD | 1.9 | 2.60 | 40 | 0.73 | 49 | 0.71 | ||
| TN | 30.0 | 2.84 | 25 | 0.98 | 41 | 0.82 | ||
| TX | 77.1 | 2.49 | 31 | 1.06 | ||||
| UT | 21.4 | 2.45 | 26 | 1.08 | ||||
| VA | 18.6 | 2.77 | 29 | 1.33 | 56 | 1.07 | ||
| VT | 14.2 | 2.01 | 30 | 0.52 | ||||
| WA | 508.3 | 1.80 | 22 | 0.88 | ||||
| WI | 58.1 | 2.11 | 27 | 1.00 | ||||
| WV | 2.6 | 2.64 | 30 | 0.88 | ||||
| WY | 4.5 | 2.11 | 27 | 0.75 | 51 | 1.30 |
- cont_0: size of contagious population on March 1, 2020
- reproduction values, R_i, for different periods, separated by the times t_i (days)
- for refence model 2, R = 6.58 * alpha. (Scale factor found empirically)