May 18, 2020 Analysis of BC regional data
As relaxation is getting underway, it is important to have a good fit to the data prior to the onset of changes due to relaxation.
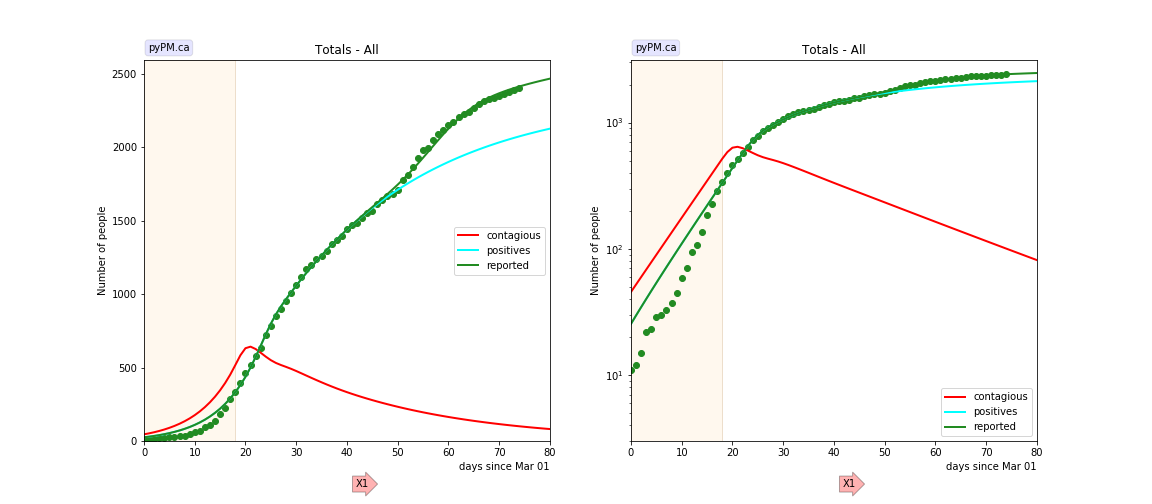
The following shows graphs followed by tables. All regional data are consistent with a single change in transmission rate and a case reporting anomaly. Cases from the Northern Health region are not shown because there are very few cases reported.
The models and data are conveniently made available through the ipypm user interface.
BC total
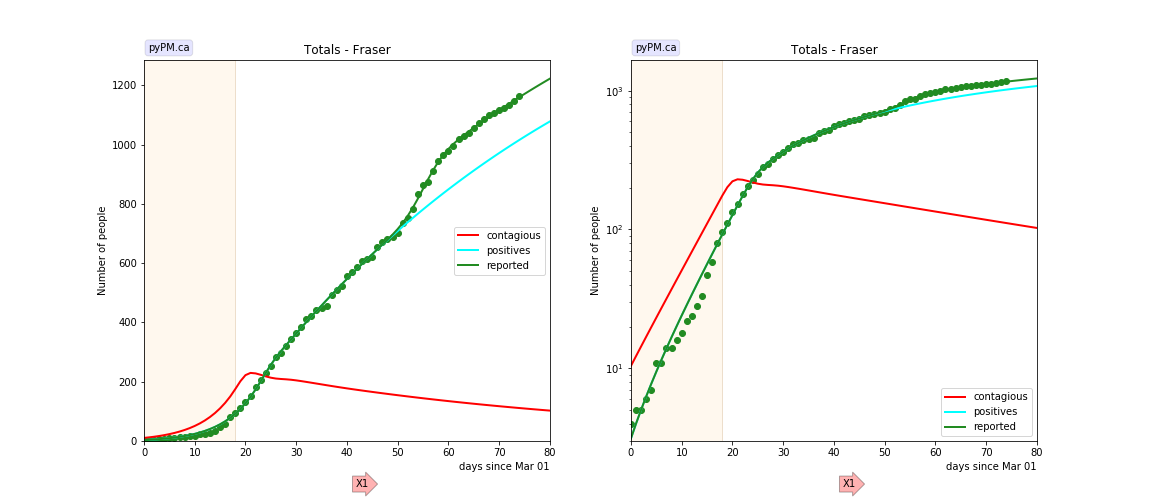
Fraser
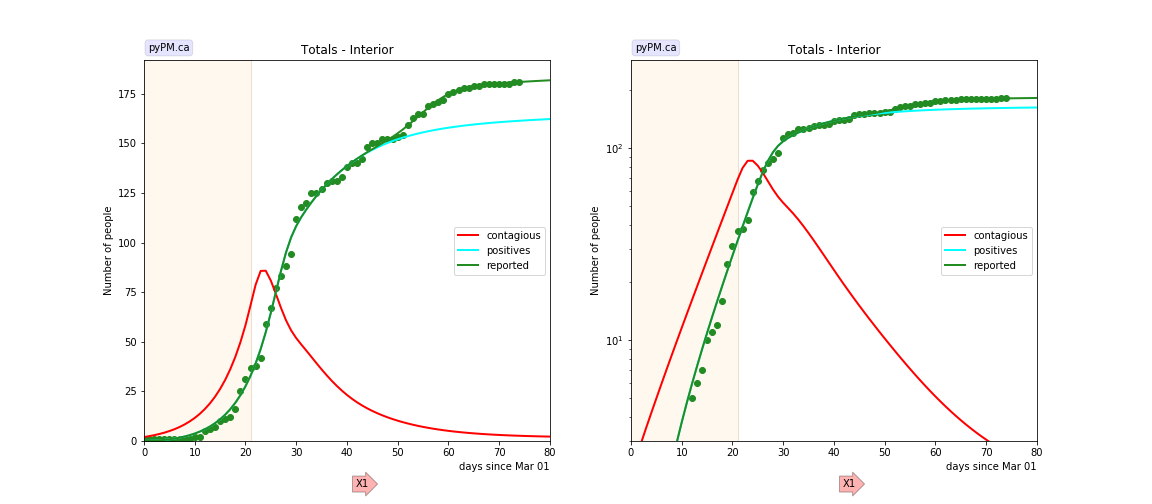
Interior
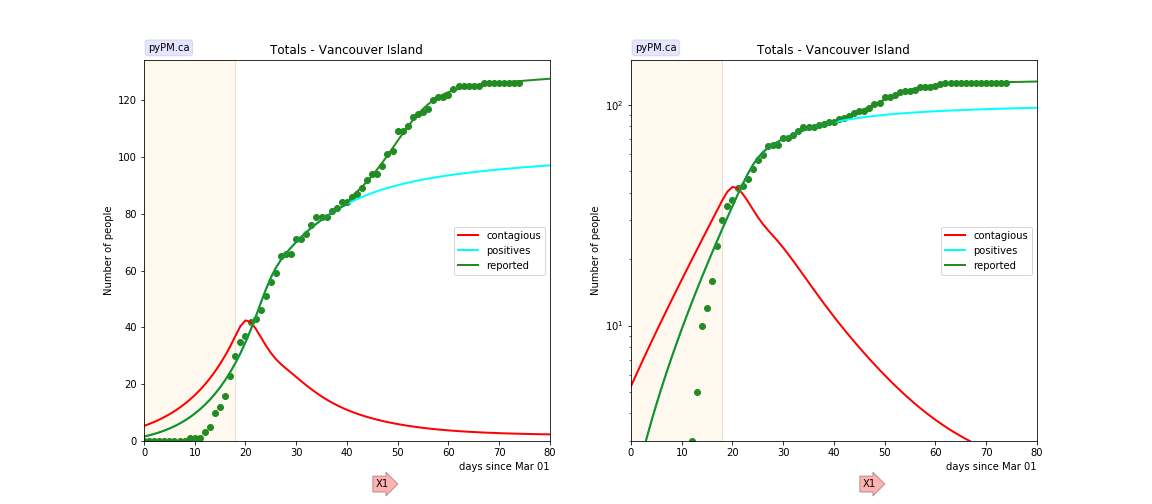
Island
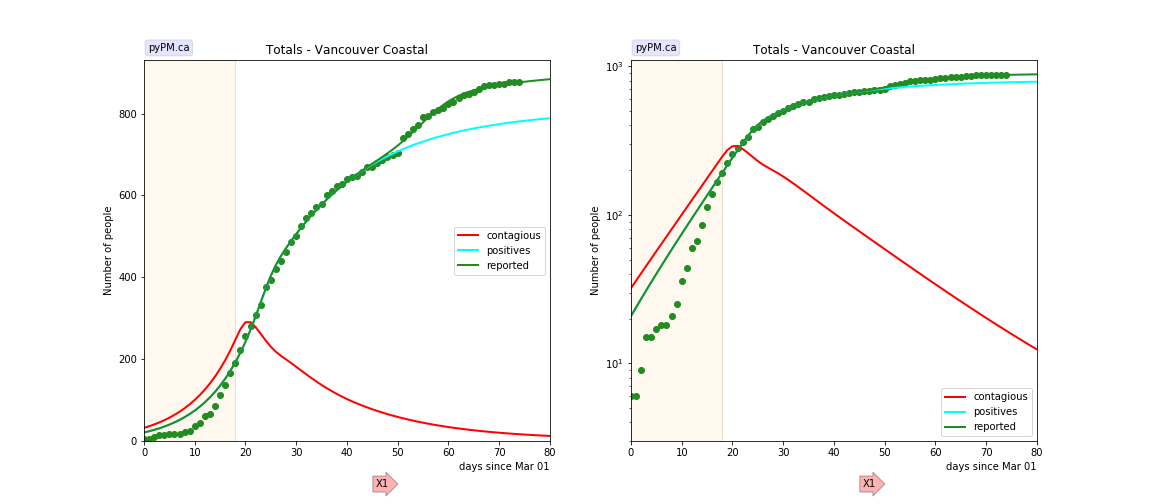
Coastal
Tables
The tables below are results from the fits to reference model 2.1. These are shown for purposes of comparison.
Reproduction numbers
| prov | cont_0 | R_0 | t_1 | R_1 |
|---|---|---|---|---|
| bc | 45.5 | 2.39 | 18 | 0.75 |
| bc* | 26.8 | 2.80 | 18 | 0.73 |
| fraser | 10.4 | 2.67 | 18 | 0.89 |
| interior | 2.0 | 2.72 | 21 | 0.46 |
| island | 5.3 | 1.95 | 18 | 0.50 |
| coastal | 32.1 | 2.10 | 18 | 0.62 |
- cont_0: size of contagious population on March 1, 2020
- reproduction values, R_i, for different periods, separated by the times t_i (days)
- for refence model 2.1, R = 6.58 * alpha. (Scale factor found empirically)
- bc* is the result from the Canada wide study that used case numbers reported at the daily briefings. The changes in the BC data (with modified case dates) affects the estimate for R_0.
Reporting anomaly
| prov | total | anomaly | day | std dev |
|---|---|---|---|---|
| bc | 2444 | 340.7 | 57.0 | 5.9 |
| fraser | 1195 | 144.4 | 54.7 | 3.0 |
| interior | 181 | 19.5 | 54.3 | 4.7 |
| island | 126 | 30.5 | 49.3 | 5.8 |
| coastal | 882 | 95.4 | 54.6 | 4.9 |
- total: total number of cases (May 18, 2020)
- anomaly: number of report anomaly cases
- day: mean day of report anomaly
- std dev: standard deviation of spread of report anomaly